| Param | Original file | Final file |
|---|---|---|
| Filename | modeM0/AS1C09_011T09_9000006494_53403cztM0_level2.fits | modeM0/AS1C09_011T09_9000006494_53403cztM0_level2_quad_clean.evt |
| Size (bytes) | 933,589,440 | 106,715,520 |
| Size | 890.3 MB | 101.8 MB |
| Events in quadrant A | 8,434,739 | 638,914 |
| Events in quadrant B | 7,111,934 | 770,812 |
| Events in quadrant C | 9,514,402 | 606,577 |
| Events in quadrant D | 8,863,927 | 644,231 |
| Mode SS | |||
|---|---|---|---|
| Quadrant | BADHDUFLAG | Total packets | Discarded packets |
| A | 0 | 164 | 0 |
| B | 0 | 164 | 0 |
| C | 0 | 164 | 0 |
| D | 0 | 164 | 0 |
| Mode M0 | |||
|---|---|---|---|
| Quadrant | BADHDUFLAG | Total packets | Discarded packets |
| A | 0 | 30817 | 0 |
| B | 0 | 26773 | 0 |
| C | 0 | 33977 | 0 |
| D | 0 | 32132 | 0 |
| Quadrant | Total seconds | Saturated seconds | Saturation percentage |
|---|---|---|---|
| A | 8205 | 1684 | 20.524071% |
| B | 8205 | 849 | 10.347349% |
| C | 8206 | 1727 | 21.045576% |
| D | 8206 | 852 | 10.382647% |
Noise dominated data is calculated using 1-second bins in cleaned event files. If a bin has >2000 counts, and if more than 50% of those come from <1% of pixels, then it is considered to be noise-dominated and hence unusable.
| Quadrant | # 1 sec bins | Bins with >0 counts | Bins with >2000 counts | High rate bins dominated by noise | Noise dominated (total time) | Noise dominated (detector-on time) | Marked lightcurve |
|---|---|---|---|---|---|---|---|
| A | 8205 | 8205 | 1233 | 1233 | 15.03% | 15.03% | 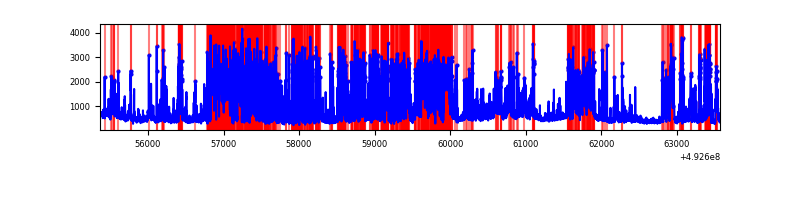 |
| B | 8205 | 8205 | 528 | 528 | 6.44% | 6.44% | 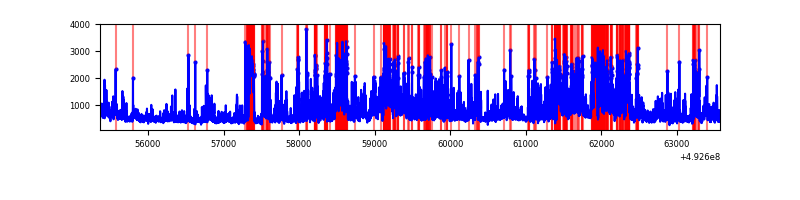 |
| C | 8206 | 8206 | 1533 | 1533 | 18.68% | 18.68% | 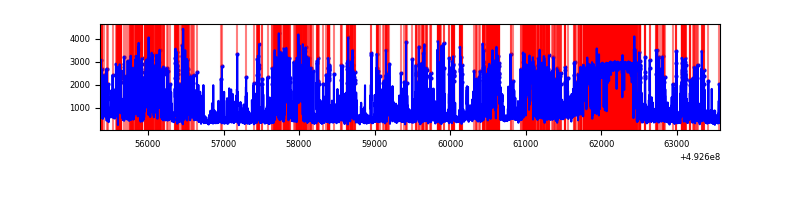 |
| D | 8206 | 8206 | 755 | 755 | 9.20% | 9.20% | 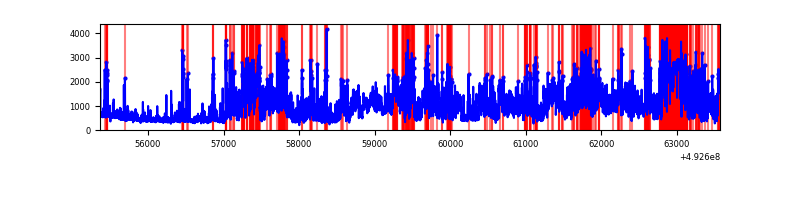 |
Top three noisy pixels from each quadrant. If the there are fewer than three noisy pixels in the level2.evt file, extra rows are filled as -1
| Pixel properties | Quadrant properties | ||||||
|---|---|---|---|---|---|---|---|
| Quadrant | DetID | PixID | Counts | Sigma | Mean | Median | Sigma |
| A | 7 | 190 | 1876442 | 9756.68 | 778 | 759 | 192.2 |
| A | 7 | 191 | 1703019 | 8854.59 | 778 | 759 | 192.2 |
| A | 0 | 8 | 561937 | 2919.06 | 778 | 759 | 192.2 |
| B | 4 | 171 | 1802632 | 10116.09 | 833 | 804 | 178.1 |
| B | 4 | 206 | 771586 | 4327.44 | 833 | 804 | 178.1 |
| B | 2 | 249 | 448583 | 2513.99 | 833 | 804 | 178.1 |
| C | 15 | 224 | 2811746 | 13518.36 | 757 | 750 | 207.9 |
| C | 1 | 241 | 2481702 | 11931.15 | 757 | 750 | 207.9 |
| C | 15 | 158 | 512642 | 2461.74 | 757 | 750 | 207.9 |
| D | 0 | 18 | 3396600 | 15175.16 | 795 | 760 | 223.8 |
| D | 12 | 16 | 1244166 | 5556.47 | 795 | 760 | 223.8 |
| D | 2 | 153 | 317159 | 1413.91 | 795 | 760 | 223.8 |
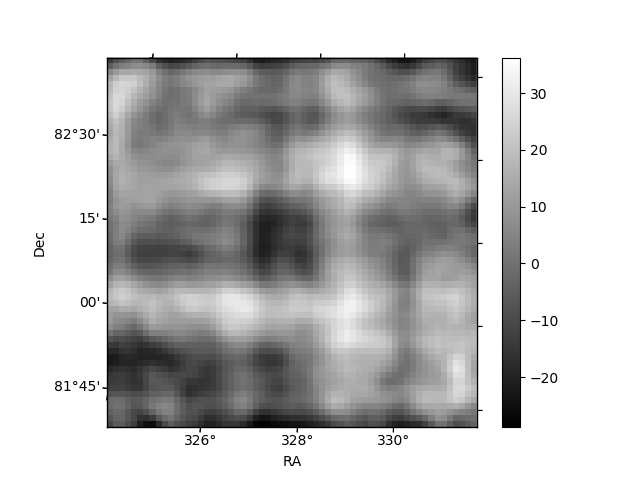
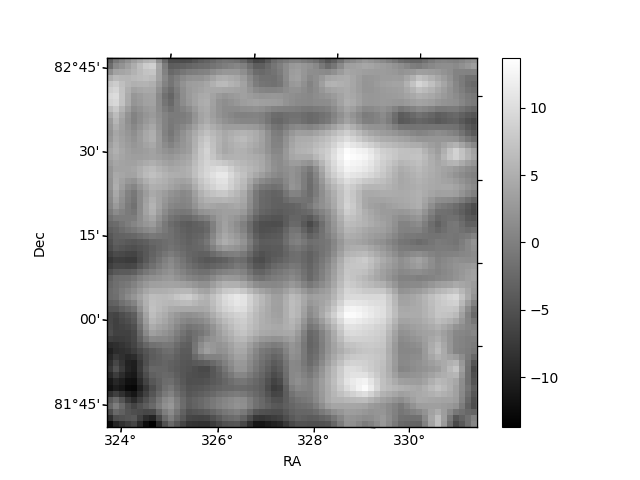
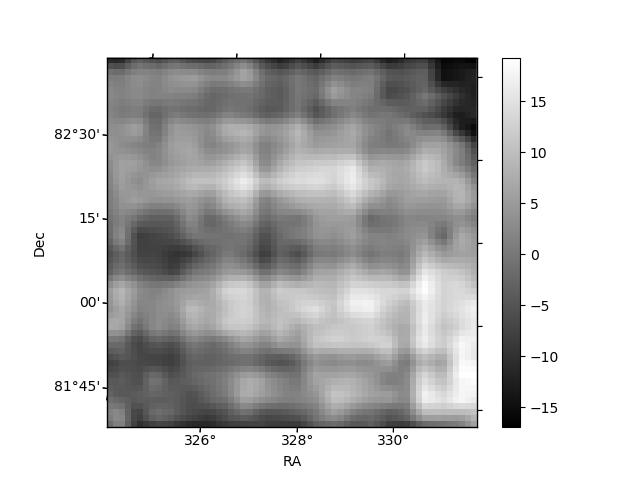
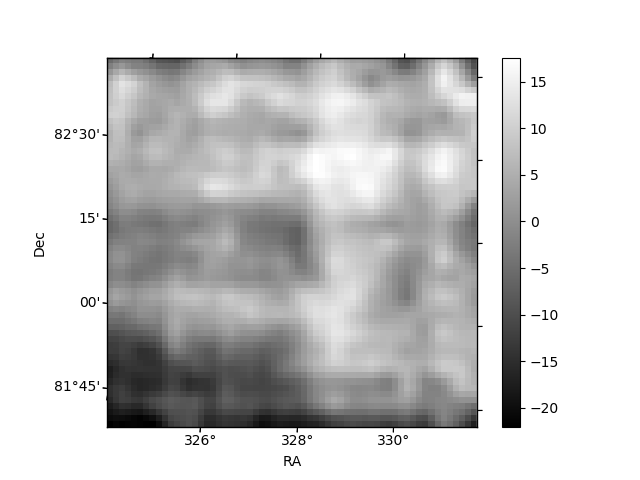
Histogram calculated using DETX and DETY for each event in the final _common_clean file
| Quadrant A | 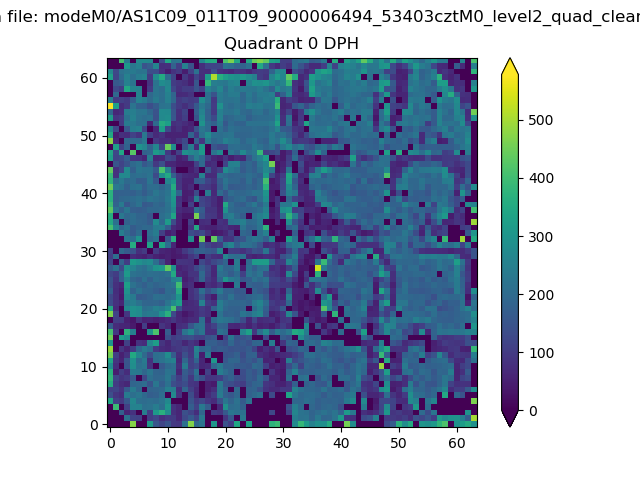 |
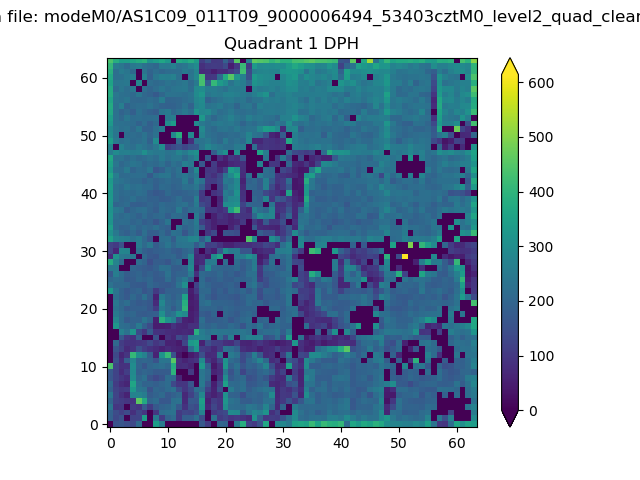 |
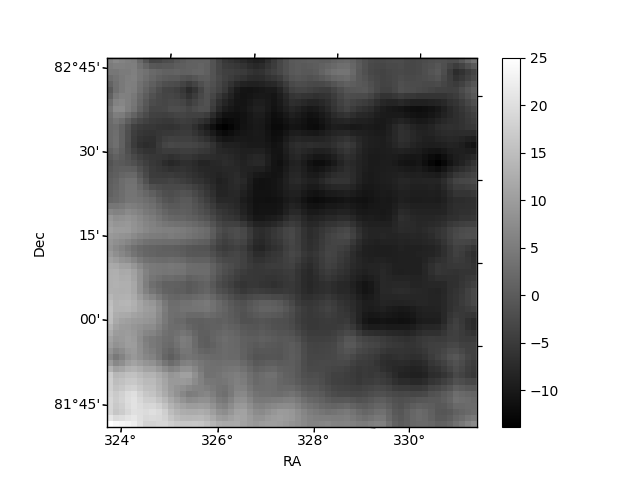
Quadrant B |
|---|---|---|---|
| Quadrant D | 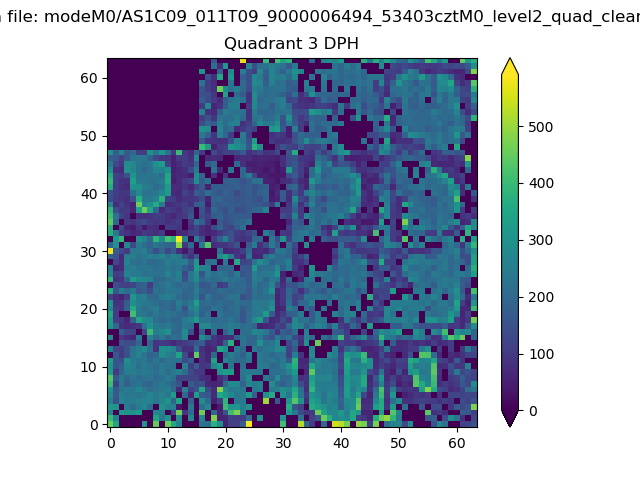 |
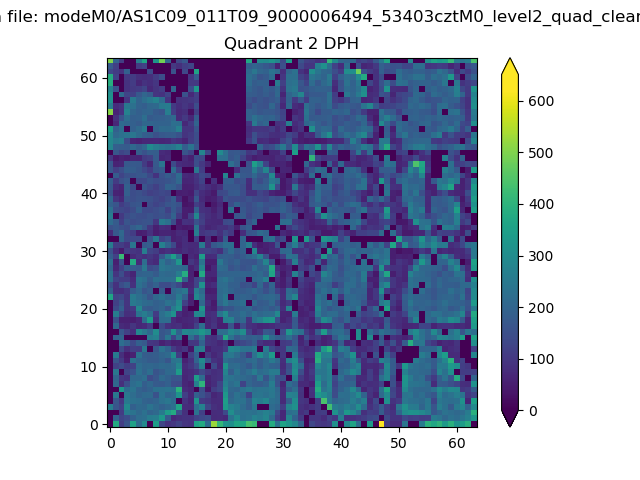 |
Quadrant C |
| Plot type | Count rate plots | Images |
|---|---|---|
| Comparison with Poisson distribution Blue bars denote a histogram of data divided into 1 sec bins. Red curve is a Poisson curve with rate = median count rate of data. |
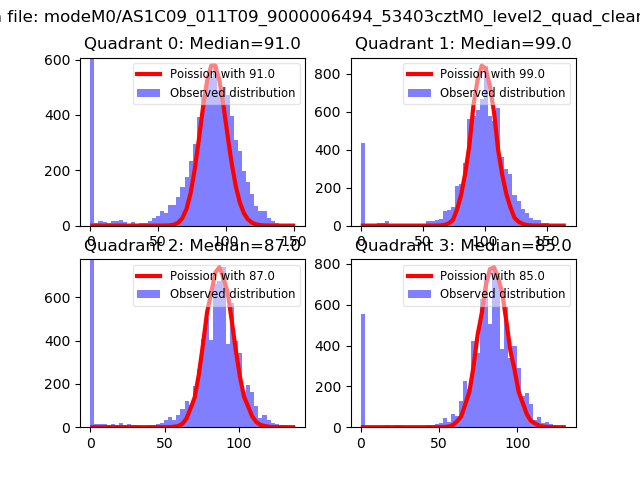 |
 |
| Quadrant-wise count rates Data is divided into 100 sec bins |
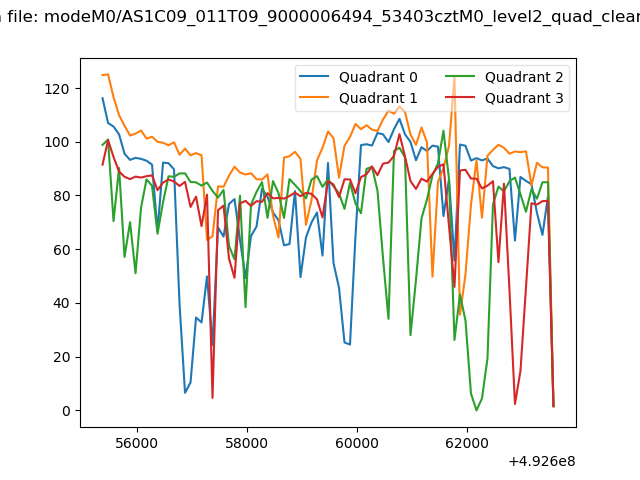 |
|
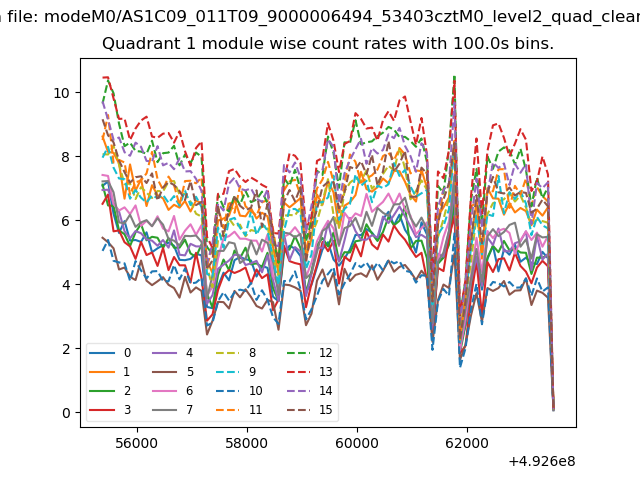
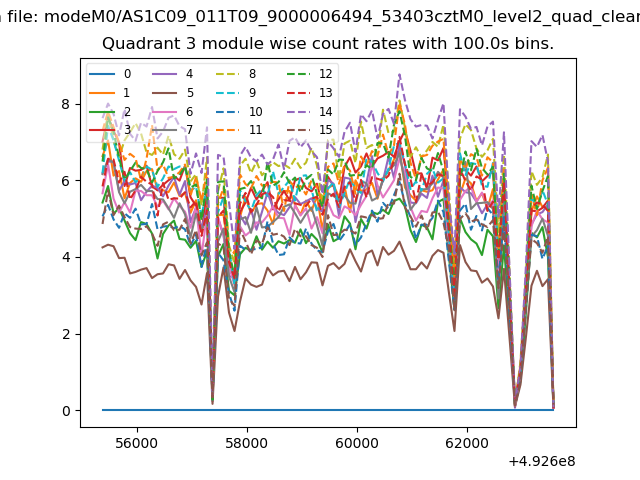
| Module-wise count rates for Quadrant A Data is divided into 100 sec bins |
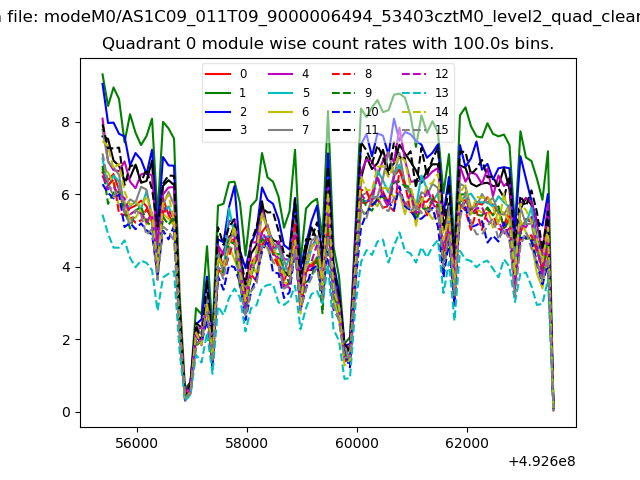 |
 |
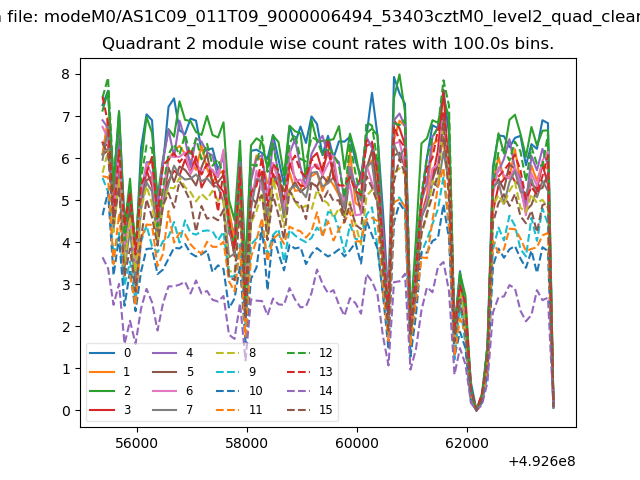
| Module-wise count rates for Quadrant B Data is divided into 100 sec bins |
 |
 |
| Module-wise count rates for Quadrant C Data is divided into 100 sec bins |
 |
 |
| Module-wise count rates for Quadrant D Data is divided into 100 sec bins |
 |
 |
| Parameter | Plot |
|---|---|
| CZT HV Monitor |  |
| D_VDD | 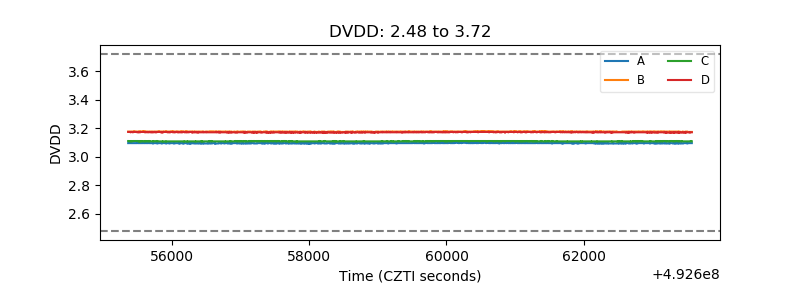 |
| Temperature 1 | 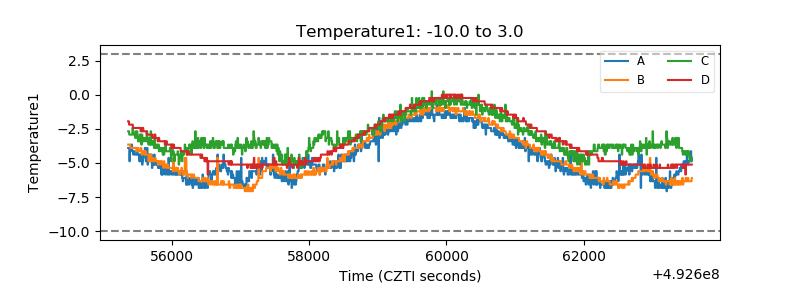 |
| Veto HV Monitor | 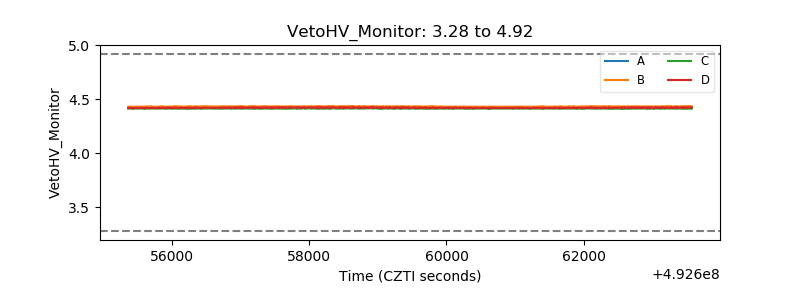 |
| Veto LLD | 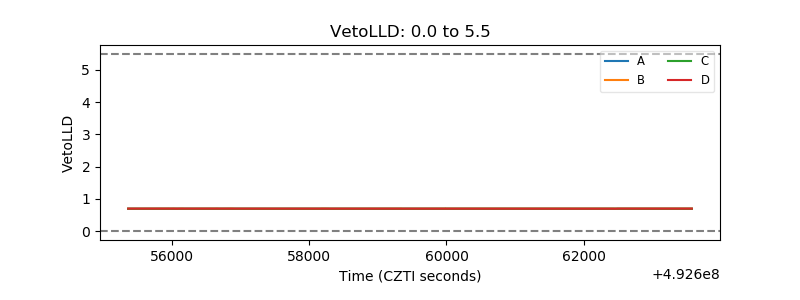 |
| Alpha Counter | 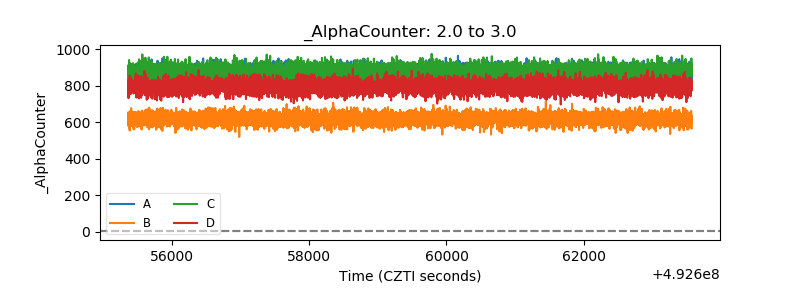 |
| _CPM_Rate | 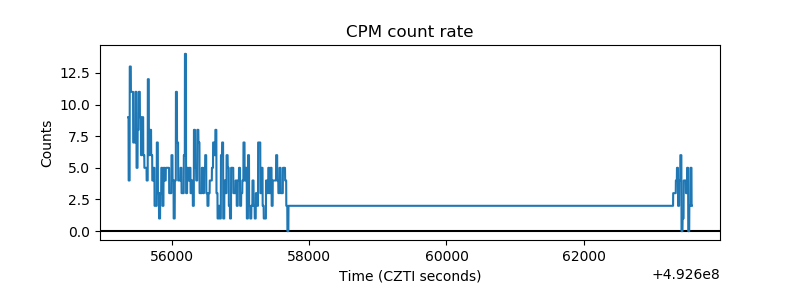 |
| CZT Counter | 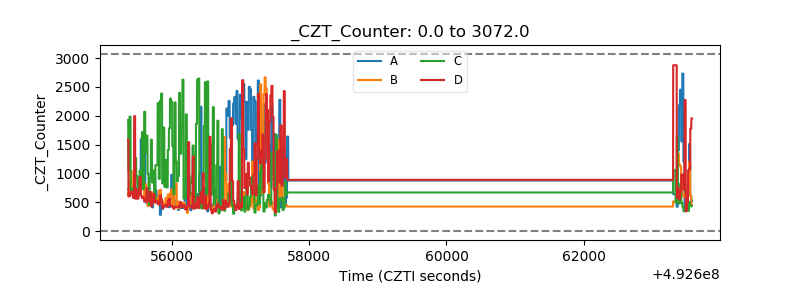 |
| +2.5 Volts monitor |  |
| +5 Volts monitor | 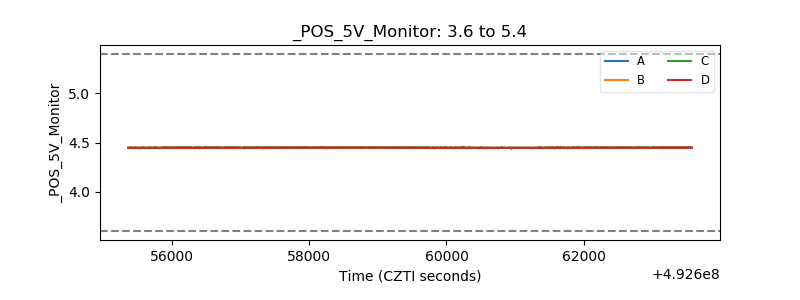 |
| _ROLL_ROT | 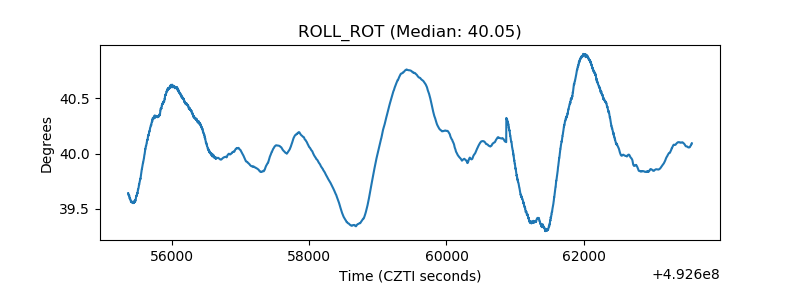 |
| _Roll_DEC | 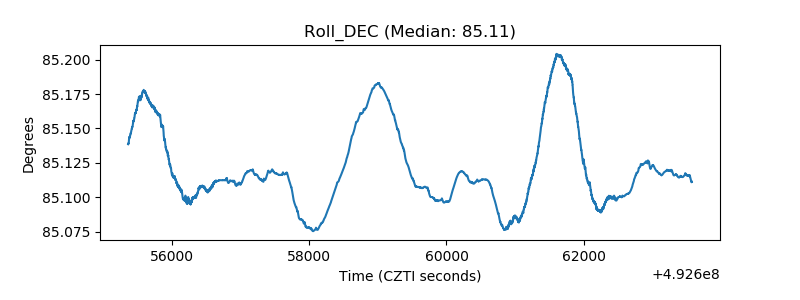 |
| _Roll_RA | 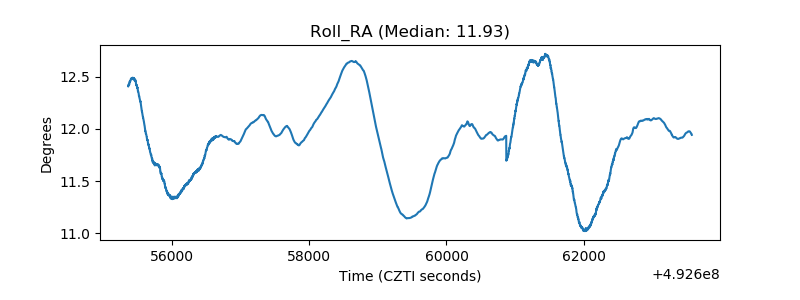 |
| Veto Counter | 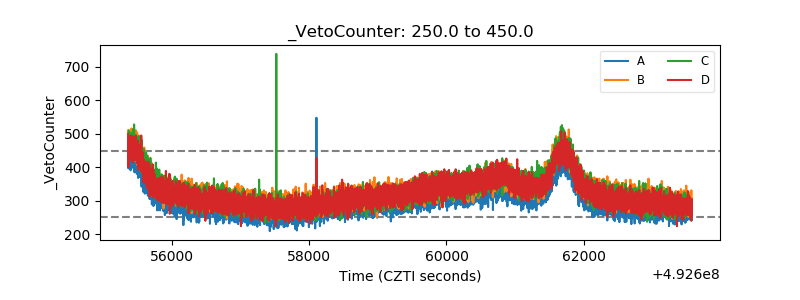 |