| Param | Original file | Final file |
|---|---|---|
| Filename | modeM0/AS1C09_011T09_9000006494_53407cztM0_level2.fits | modeM0/AS1C09_011T09_9000006494_53407cztM0_level2_quad_clean.evt |
| Size (bytes) | 1,131,770,880 | 91,166,400 |
| Size | 1.1 GB | 86.9 MB |
| Events in quadrant A | 5,131,405 | 748,551 |
| Events in quadrant B | 7,888,334 | 739,783 |
| Events in quadrant C | 20,710,670 | 59,341 |
| Events in quadrant D | 7,534,146 | 645,673 |
| Mode SS | |||
|---|---|---|---|
| Quadrant | BADHDUFLAG | Total packets | Discarded packets |
| A | 0 | 168 | 0 |
| B | 0 | 168 | 0 |
| C | 0 | 168 | 0 |
| D | 0 | 168 | 0 |
| Mode M0 | |||
|---|---|---|---|
| Quadrant | BADHDUFLAG | Total packets | Discarded packets |
| A | 0 | 20911 | 3 |
| B | 0 | 29063 | 2 |
| C | 0 | 66896 | 2 |
| D | 0 | 28012 | 2 |
| Mode M9 | |||
|---|---|---|---|
| Quadrant | BADHDUFLAG | Total packets | Discarded packets |
| A | 0 | 14 | 0 |
| B | 0 | 14 | 0 |
| C | 0 | 14 | 0 |
| D | 0 | 14 | 0 |
| Quadrant | Total seconds | Saturated seconds | Saturation percentage |
|---|---|---|---|
| A | 8148 | 396 | 4.860088% |
| B | 8149 | 1061 | 13.020002% |
| C | 8149 | 7621 | 93.520677% |
| D | 8149 | 775 | 9.510369% |
Noise dominated data is calculated using 1-second bins in cleaned event files. If a bin has >2000 counts, and if more than 50% of those come from <1% of pixels, then it is considered to be noise-dominated and hence unusable.
| Quadrant | # 1 sec bins | Bins with >0 counts | Bins with >2000 counts | High rate bins dominated by noise | Noise dominated (total time) | Noise dominated (detector-on time) | Marked lightcurve |
|---|---|---|---|---|---|---|---|
| A | 9558 | 8149 | 253 | 253 | 2.65% | 3.10% | 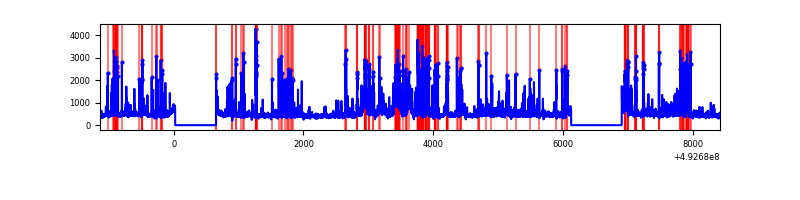 |
| B | 9559 | 8151 | 733 | 733 | 7.67% | 8.99% | 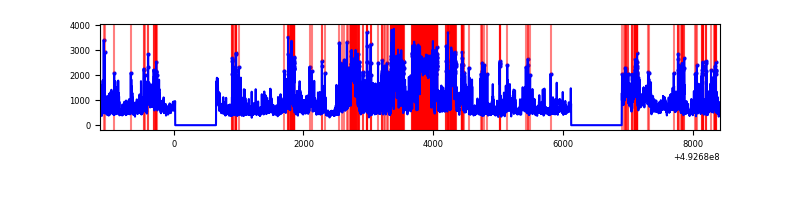 |
| C | 9559 | 8149 | 7452 | 7452 | 77.96% | 91.45% | 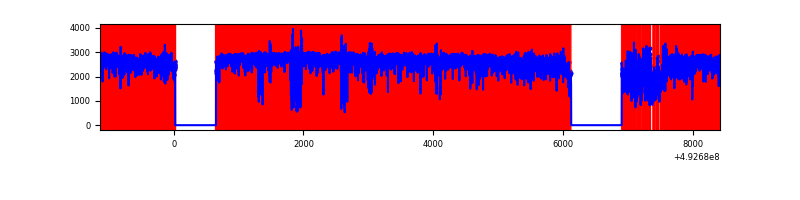 |
| D | 9559 | 8151 | 652 | 652 | 6.82% | 8.00% | 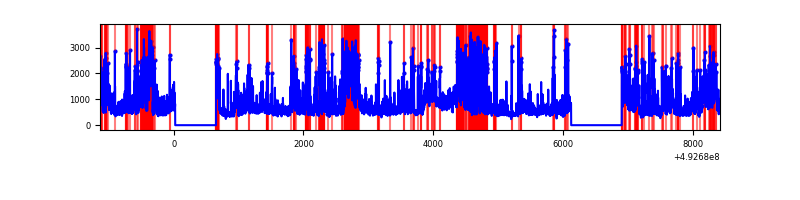 |
Top three noisy pixels from each quadrant. If the there are fewer than three noisy pixels in the level2.evt file, extra rows are filled as -1
| Pixel properties | Quadrant properties | ||||||
|---|---|---|---|---|---|---|---|
| Quadrant | DetID | PixID | Counts | Sigma | Mean | Median | Sigma |
| A | 15 | 174 | 385910 | 1800.16 | 860 | 839 | 213.9 |
| A | 4 | 249 | 357775 | 1668.63 | 860 | 839 | 213.9 |
| A | 7 | 191 | 264387 | 1232.05 | 860 | 839 | 213.9 |
| B | 4 | 206 | 1961548 | 11111.73 | 824 | 795 | 176.5 |
| B | 2 | 249 | 766225 | 4337.75 | 824 | 795 | 176.5 |
| B | 4 | 171 | 574475 | 3251.09 | 824 | 795 | 176.5 |
| C | 1 | 241 | 15607505 | 145318.94 | 390 | 386 | 107.4 |
| C | 15 | 224 | 2539065 | 23637.81 | 390 | 386 | 107.4 |
| C | 1 | 16 | 311932 | 2900.83 | 390 | 386 | 107.4 |
| D | 2 | 172 | 1991058 | 8435.47 | 824 | 786 | 235.9 |
| D | 12 | 17 | 771119 | 3264.94 | 824 | 786 | 235.9 |
| D | 2 | 153 | 340083 | 1438.06 | 824 | 786 | 235.9 |
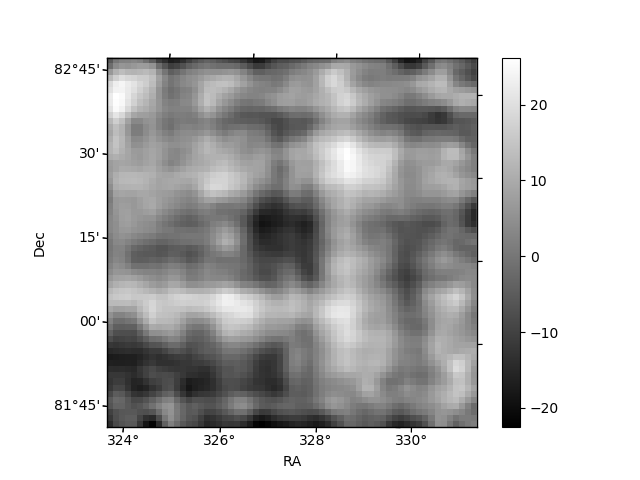
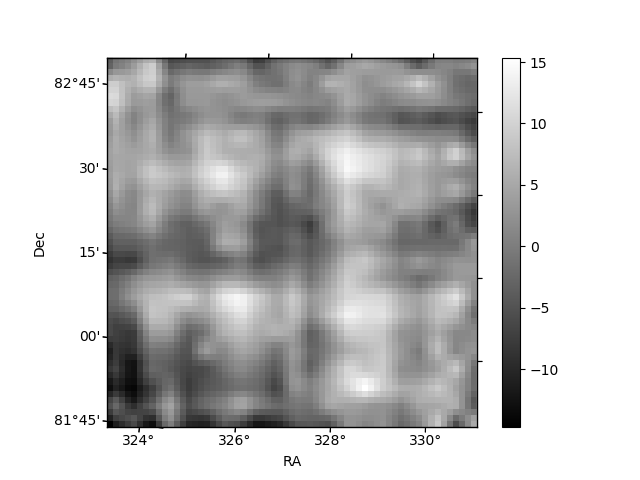
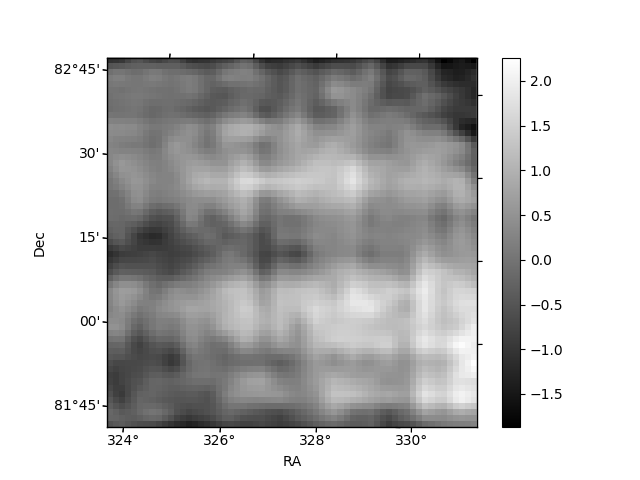
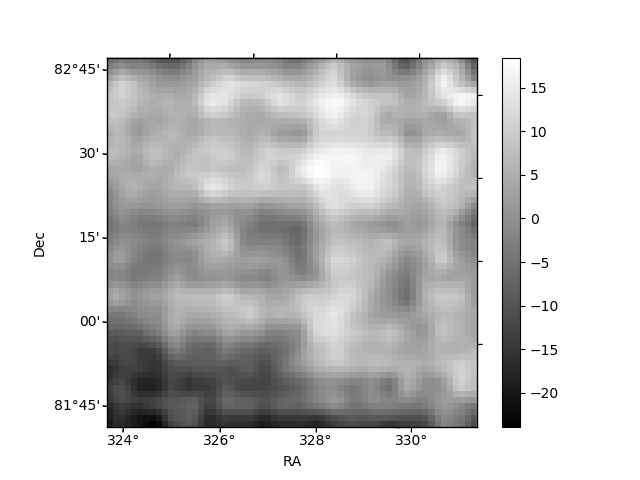
Histogram calculated using DETX and DETY for each event in the final _common_clean file
| Quadrant A | 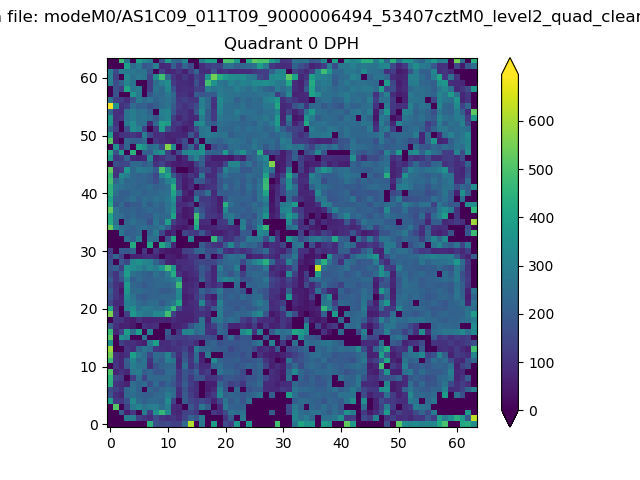 |
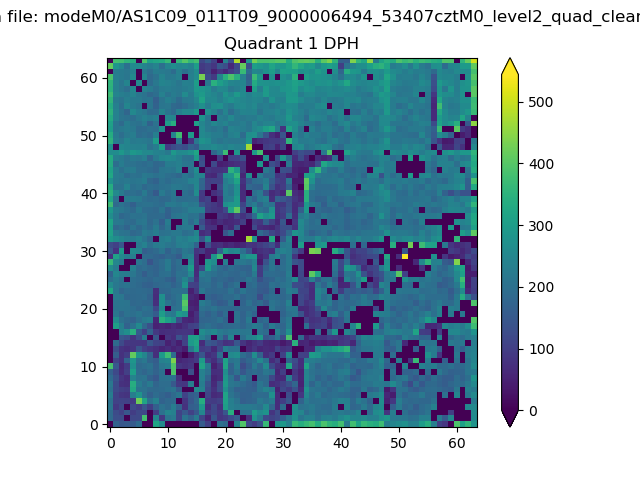 |
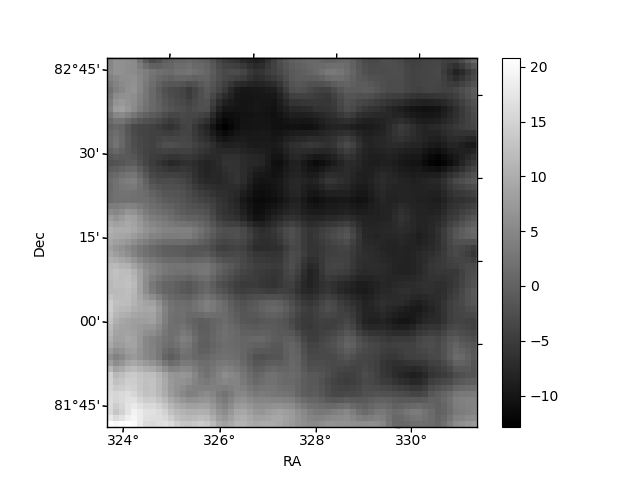
Quadrant B |
|---|---|---|---|
| Quadrant D | 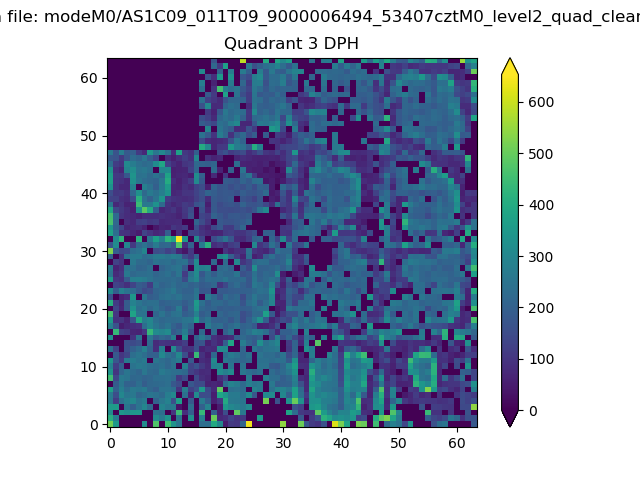 |
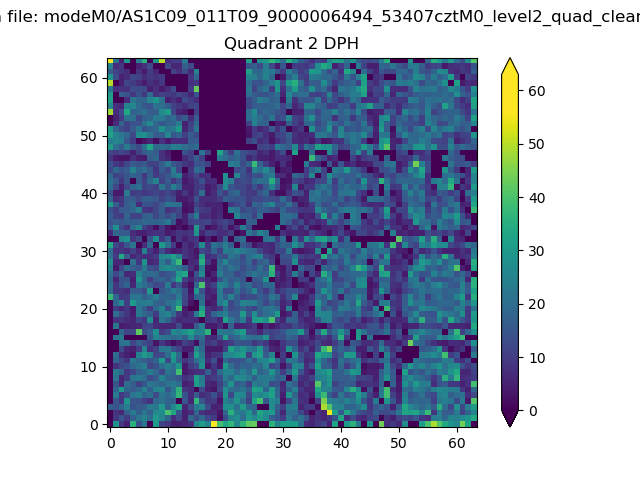 |
Quadrant C |
| Plot type | Count rate plots | Images |
|---|---|---|
| Comparison with Poisson distribution Blue bars denote a histogram of data divided into 1 sec bins. Red curve is a Poisson curve with rate = median count rate of data. |
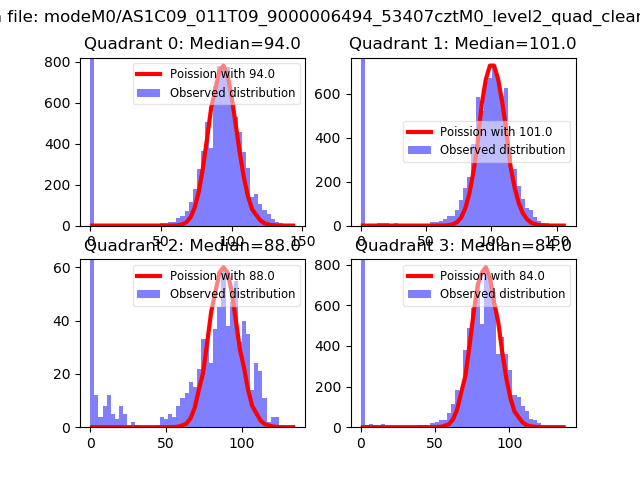 |
 |
| Quadrant-wise count rates Data is divided into 100 sec bins |
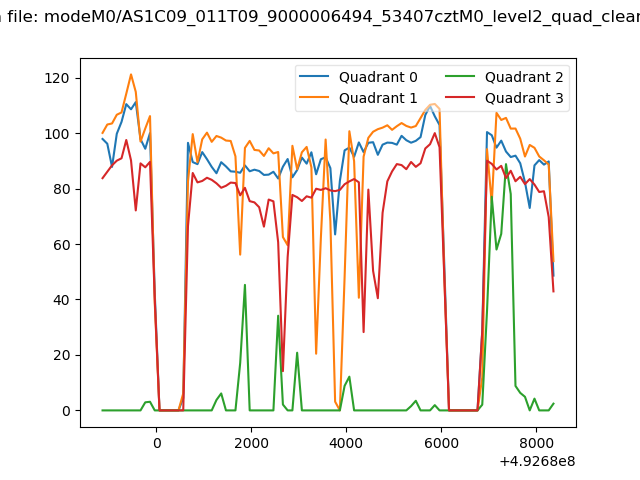 |
|
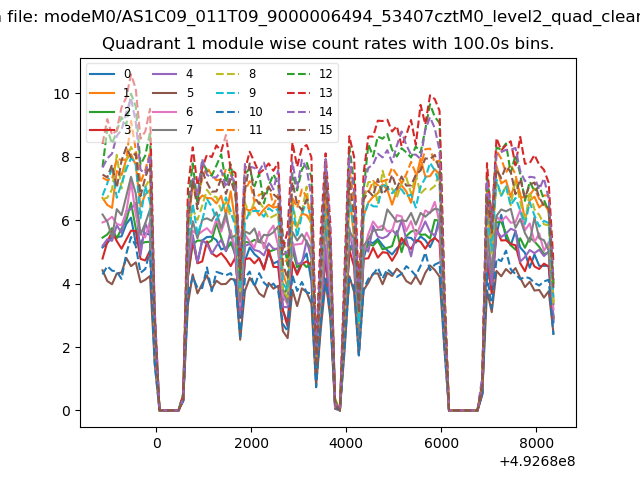
| Module-wise count rates for Quadrant A Data is divided into 100 sec bins |
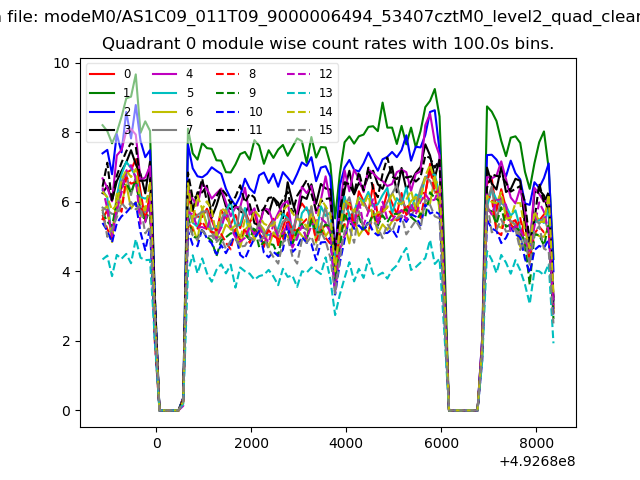 |
 |
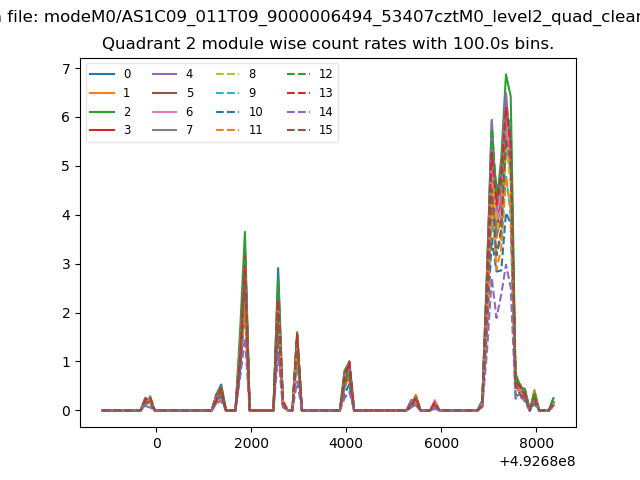
| Module-wise count rates for Quadrant B Data is divided into 100 sec bins |
 |
 |
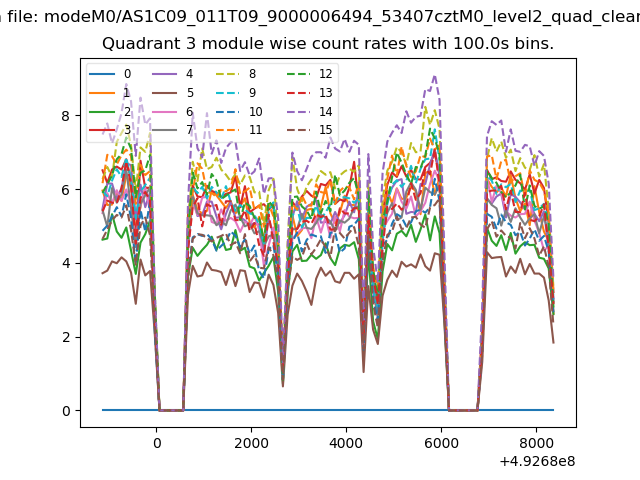
| Module-wise count rates for Quadrant C Data is divided into 100 sec bins |
 |
 |
| Module-wise count rates for Quadrant D Data is divided into 100 sec bins |
 |
 |
| Parameter | Plot |
|---|---|
| CZT HV Monitor | 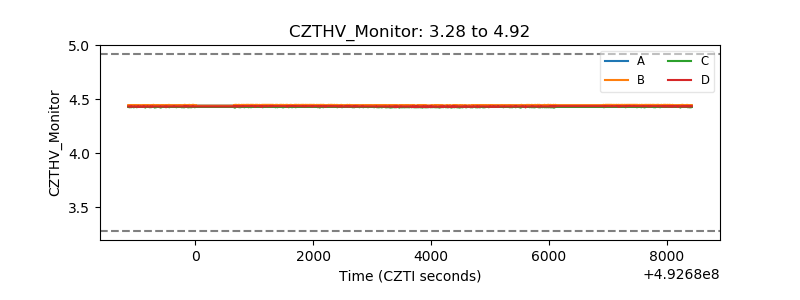 |
| D_VDD | 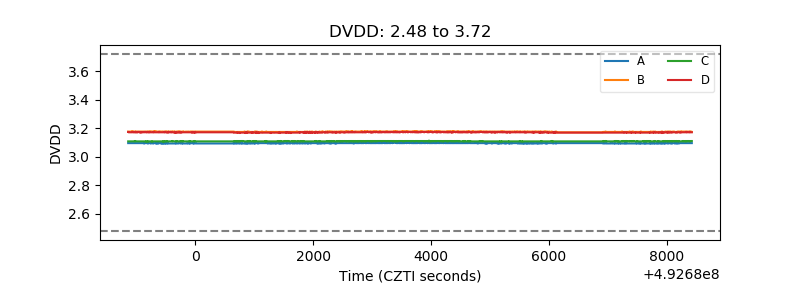 |
| Temperature 1 | 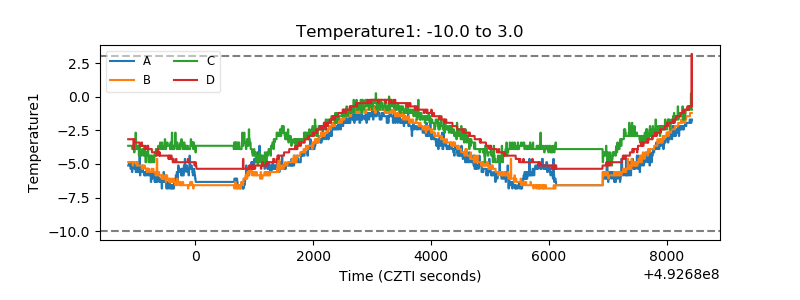 |
| Veto HV Monitor | 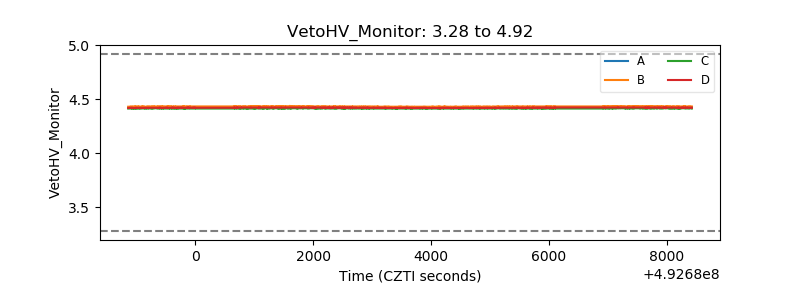 |
| Veto LLD | 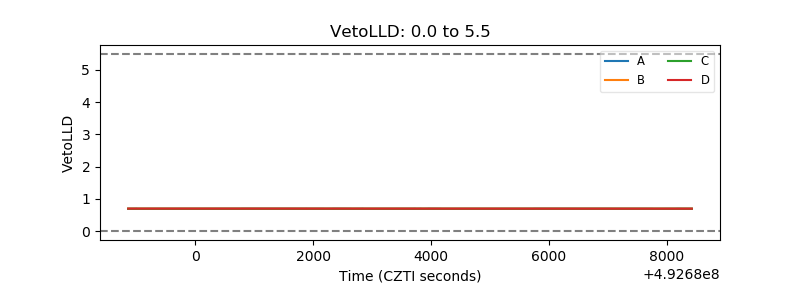 |
| Alpha Counter | 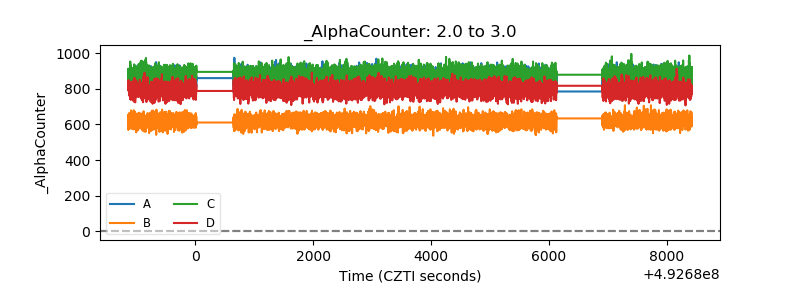 |
| _CPM_Rate | 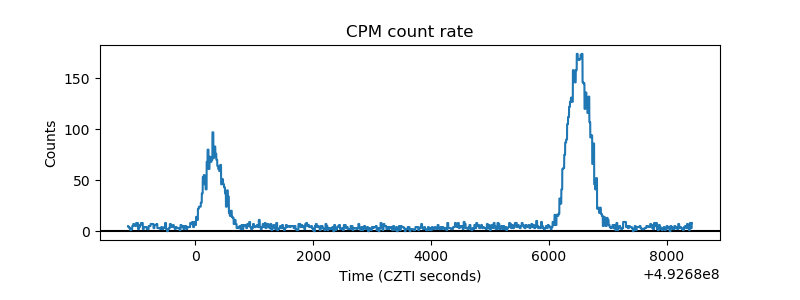 |
| CZT Counter | 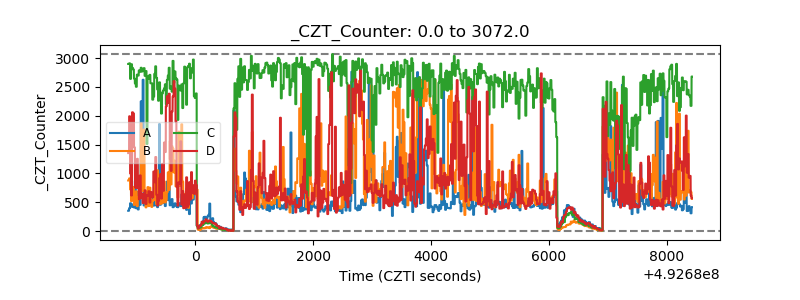 |
| +2.5 Volts monitor |  |
| +5 Volts monitor |  |
| _ROLL_ROT | 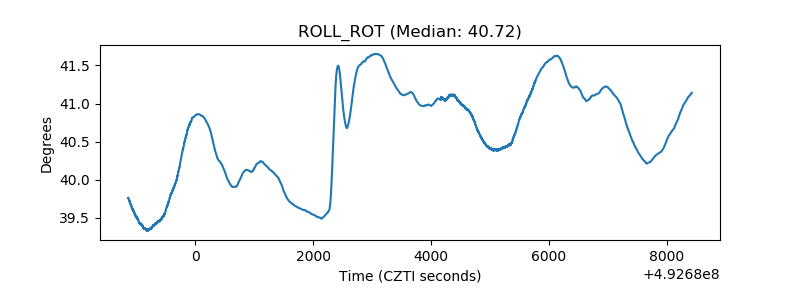 |
| _Roll_DEC | 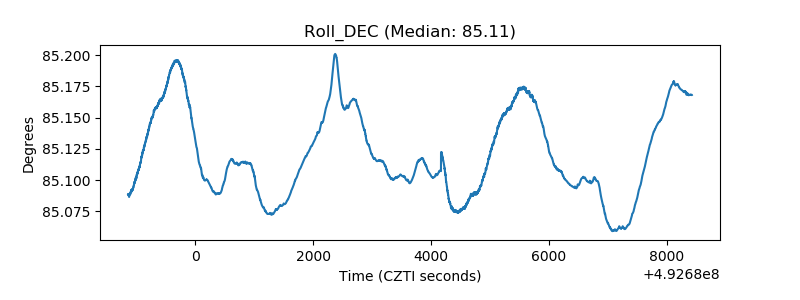 |
| _Roll_RA | 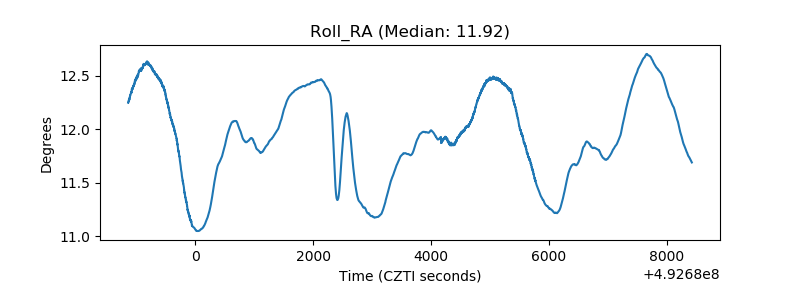 |
| Veto Counter | 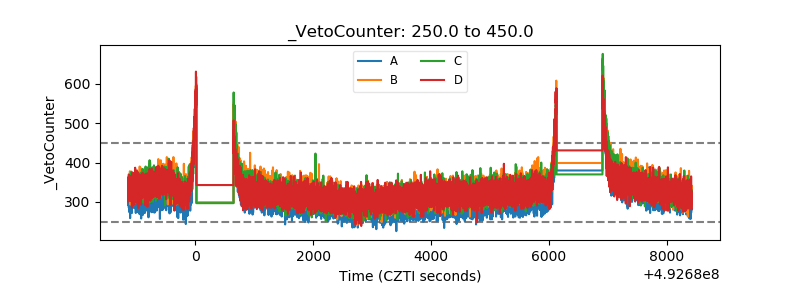 |