| Param | Original file | Final file |
|---|---|---|
| Filename | modeM0/AS1C09_011T09_9000006494_53408cztM0_level2.fits | modeM0/AS1C09_011T09_9000006494_53408cztM0_level2_quad_clean.evt |
| Size (bytes) | 853,266,240 | 69,595,200 |
| Size | 813.7 MB | 66.4 MB |
| Events in quadrant A | 4,925,423 | 514,731 |
| Events in quadrant B | 6,594,785 | 566,625 |
| Events in quadrant C | 14,328,184 | 100,233 |
| Events in quadrant D | 5,271,444 | 504,848 |
| Mode SS | |||
|---|---|---|---|
| Quadrant | BADHDUFLAG | Total packets | Discarded packets |
| A | 0 | 124 | 0 |
| B | 0 | 124 | 0 |
| C | 0 | 124 | 0 |
| D | 0 | 124 | 0 |
| Mode M0 | |||
|---|---|---|---|
| Quadrant | BADHDUFLAG | Total packets | Discarded packets |
| A | 0 | 18905 | 4 |
| B | 0 | 23798 | 1 |
| C | 0 | 46693 | 17 |
| D | 0 | 19827 | 5 |
| Mode M9 | |||
|---|---|---|---|
| Quadrant | BADHDUFLAG | Total packets | Discarded packets |
| A | 0 | 9 | 0 |
| B | 0 | 9 | 0 |
| C | 0 | 9 | 0 |
| D | 0 | 9 | 0 |
| Quadrant | Total seconds | Saturated seconds | Saturation percentage |
|---|---|---|---|
| A | 6012 | 812 | 13.506321% |
| B | 6014 | 883 | 14.682408% |
| C | 6013 | 5090 | 84.649925% |
| D | 6014 | 379 | 6.301962% |
Noise dominated data is calculated using 1-second bins in cleaned event files. If a bin has >2000 counts, and if more than 50% of those come from <1% of pixels, then it is considered to be noise-dominated and hence unusable.
| Quadrant | # 1 sec bins | Bins with >0 counts | Bins with >2000 counts | High rate bins dominated by noise | Noise dominated (total time) | Noise dominated (detector-on time) | Marked lightcurve |
|---|---|---|---|---|---|---|---|
| A | 6964 | 6014 | 699 | 699 | 10.04% | 11.62% | 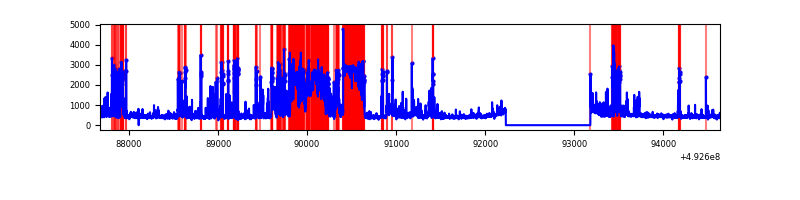 |
| B | 6964 | 6014 | 571 | 571 | 8.20% | 9.49% | 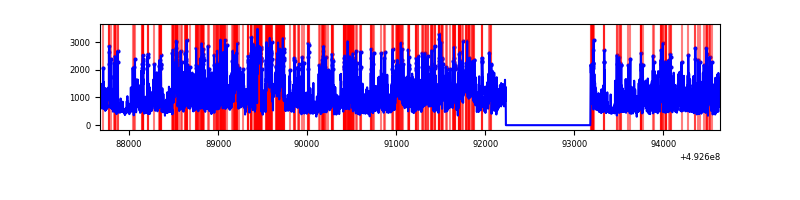 |
| C | 6965 | 6013 | 4995 | 4995 | 71.72% | 83.07% | 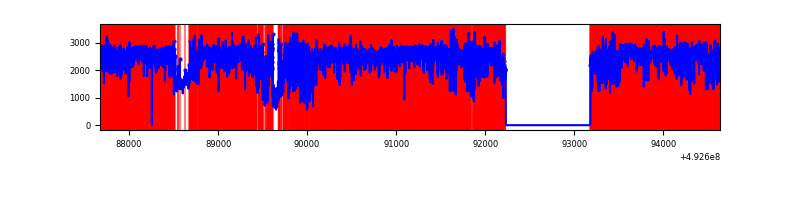 |
| D | 6964 | 6015 | 390 | 390 | 5.60% | 6.48% | 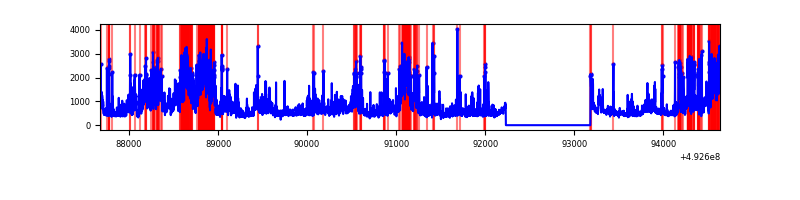 |
Top three noisy pixels from each quadrant. If the there are fewer than three noisy pixels in the level2.evt file, extra rows are filled as -1
| Pixel properties | Quadrant properties | ||||||
|---|---|---|---|---|---|---|---|
| Quadrant | DetID | PixID | Counts | Sigma | Mean | Median | Sigma |
| A | 15 | 174 | 1239824 | 8370.58 | 598 | 583 | 148.0 |
| A | 3 | 63 | 538376 | 3632.58 | 598 | 583 | 148.0 |
| A | 0 | 8 | 413536 | 2789.33 | 598 | 583 | 148.0 |
| B | 4 | 206 | 1395654 | 10894.36 | 601 | 580 | 128.1 |
| B | 4 | 171 | 975164 | 7610.68 | 601 | 580 | 128.1 |
| B | 2 | 249 | 868906 | 6780.9 | 601 | 580 | 128.1 |
| C | 1 | 241 | 8172592 | 78092.61 | 382 | 379 | 104.6 |
| C | 15 | 224 | 1968048 | 18802.79 | 382 | 379 | 104.6 |
| C | 1 | 240 | 642268 | 6133.81 | 382 | 379 | 104.6 |
| D | 10 | 172 | 1219007 | 7104.96 | 607 | 581 | 171.5 |
| D | 13 | 46 | 418963 | 2439.69 | 607 | 581 | 171.5 |
| D | 2 | 249 | 267596 | 1557.03 | 607 | 581 | 171.5 |
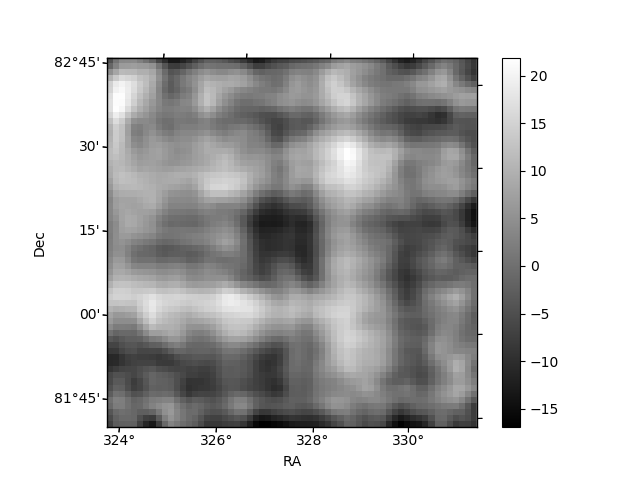
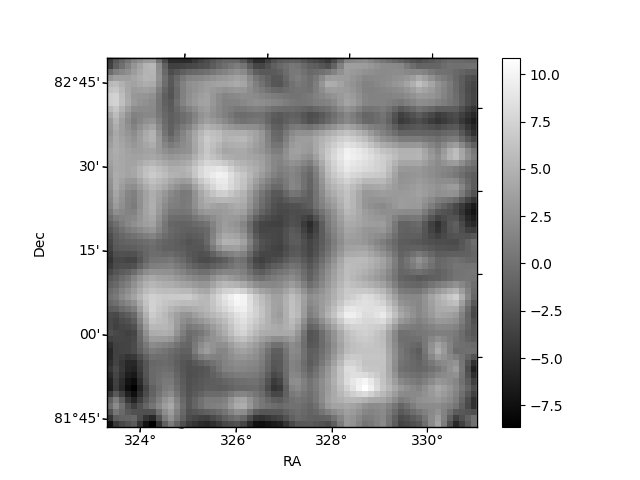
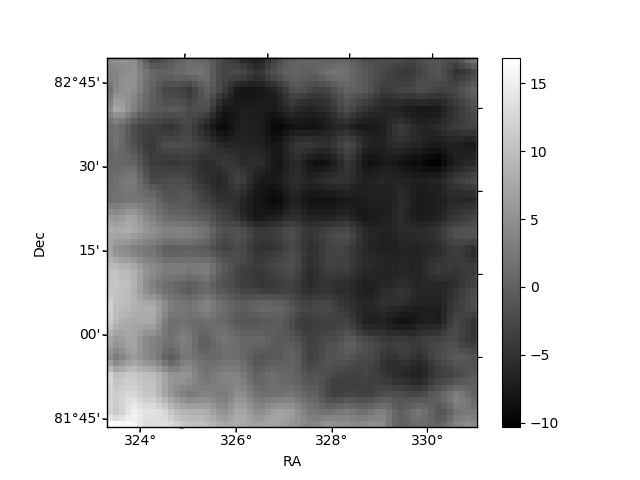
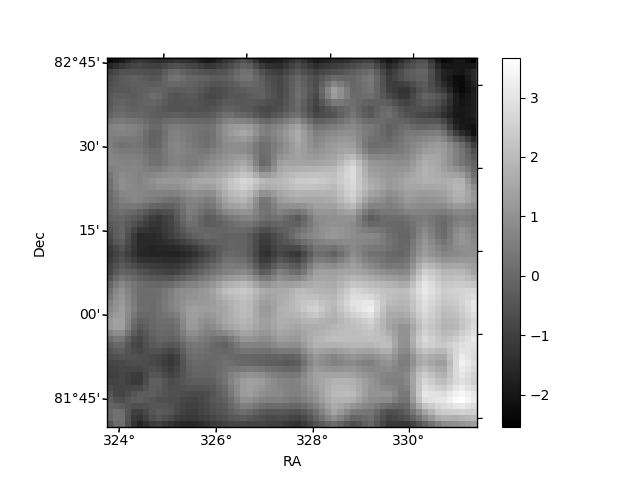
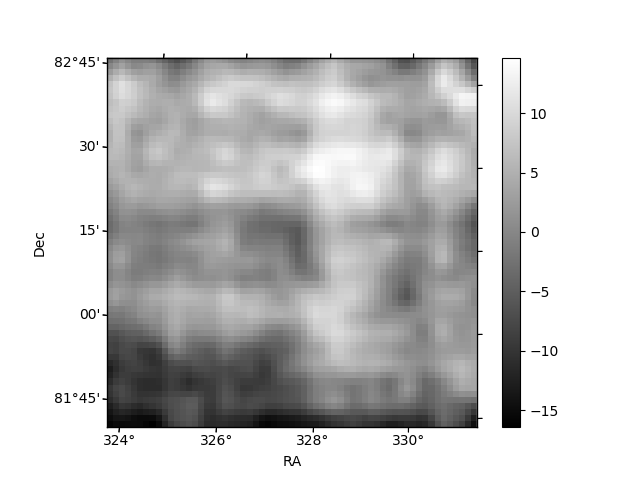
Histogram calculated using DETX and DETY for each event in the final _common_clean file
| Quadrant A | 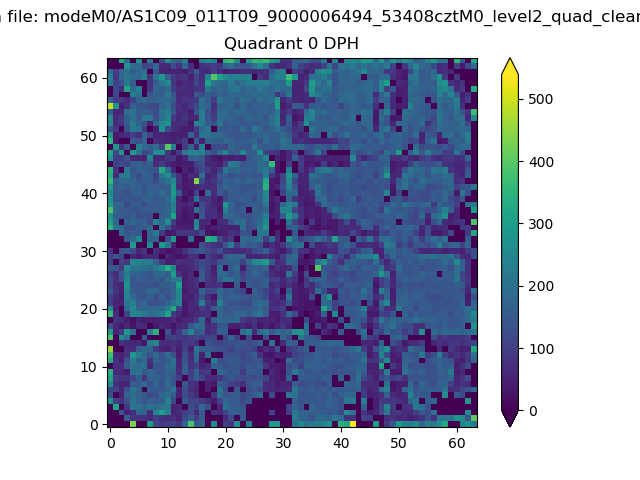 |
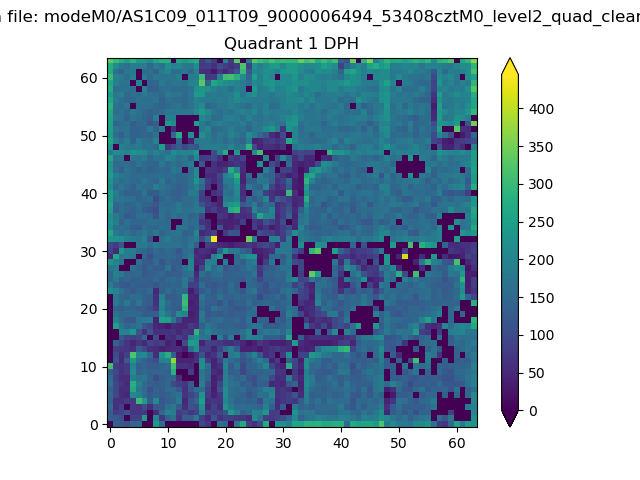 |
Quadrant B |
|---|---|---|---|
| Quadrant D | 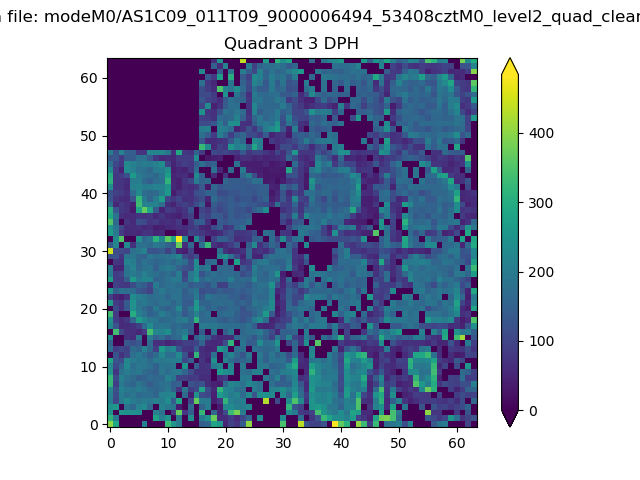 |
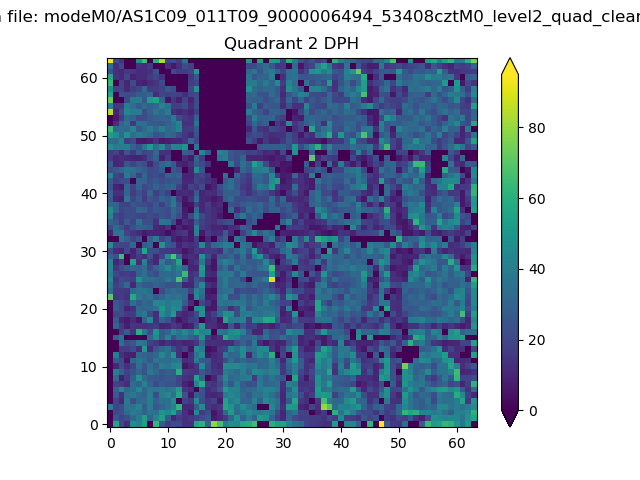 |
Quadrant C |
| Plot type | Count rate plots | Images |
|---|---|---|
| Comparison with Poisson distribution Blue bars denote a histogram of data divided into 1 sec bins. Red curve is a Poisson curve with rate = median count rate of data. |
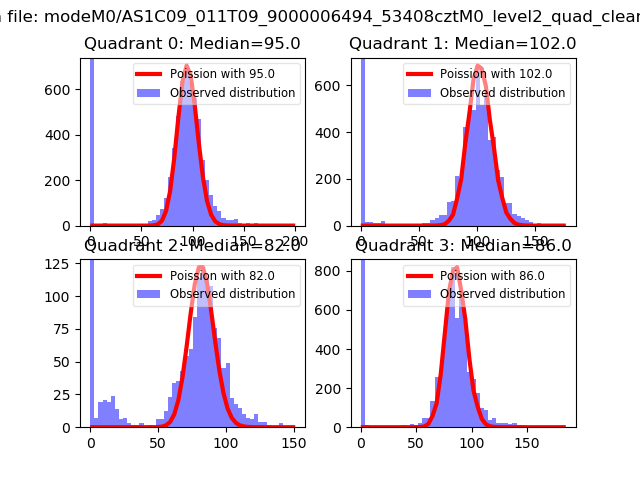 |
 |
| Quadrant-wise count rates Data is divided into 100 sec bins |
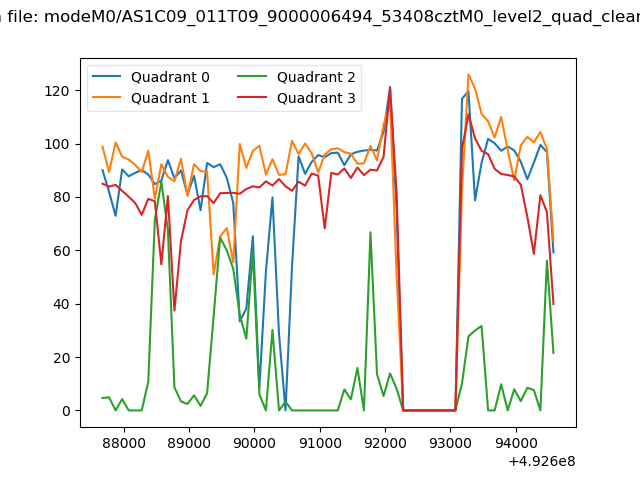 |
|
| Module-wise count rates for Quadrant A Data is divided into 100 sec bins |
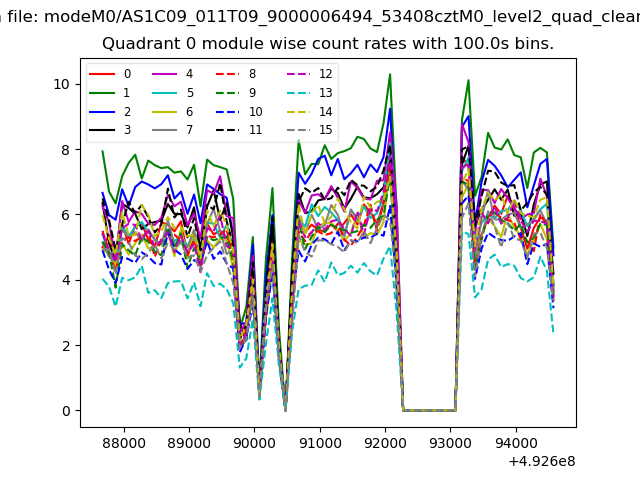 |
 |
| Module-wise count rates for Quadrant B Data is divided into 100 sec bins |
 |
 |
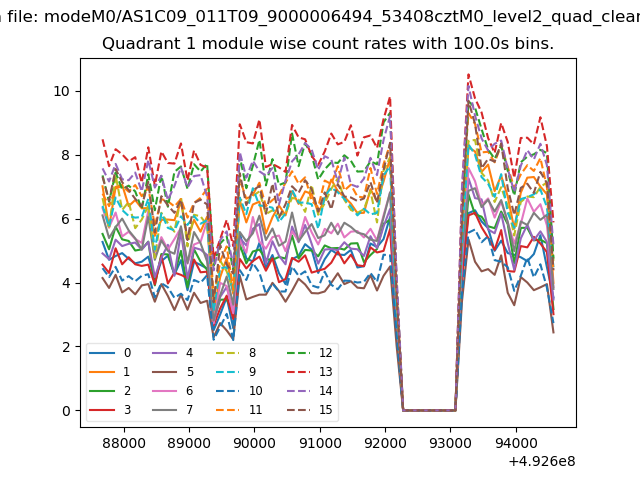
| Module-wise count rates for Quadrant C Data is divided into 100 sec bins |
 |
 |
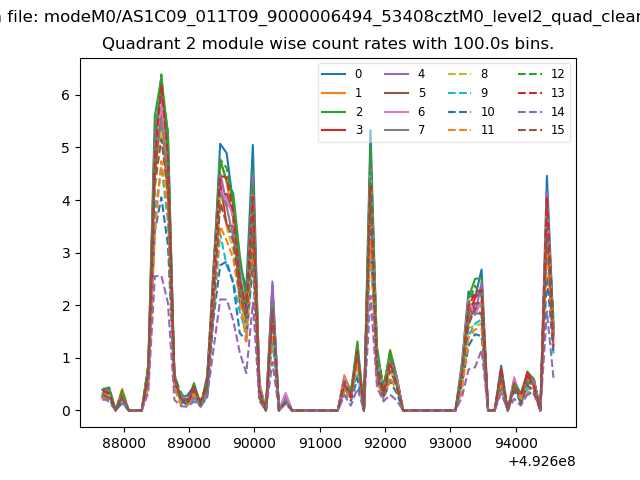
| Module-wise count rates for Quadrant D Data is divided into 100 sec bins |
 |
 |
| Parameter | Plot |
|---|---|
| CZT HV Monitor | 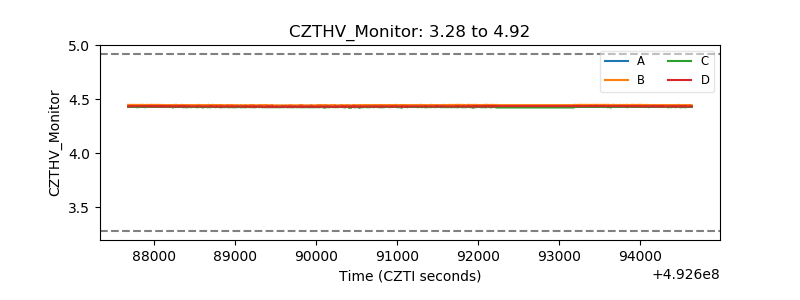 |
| D_VDD | 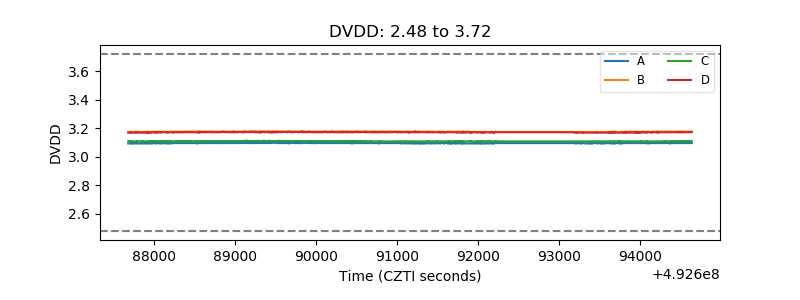 |
| Temperature 1 | 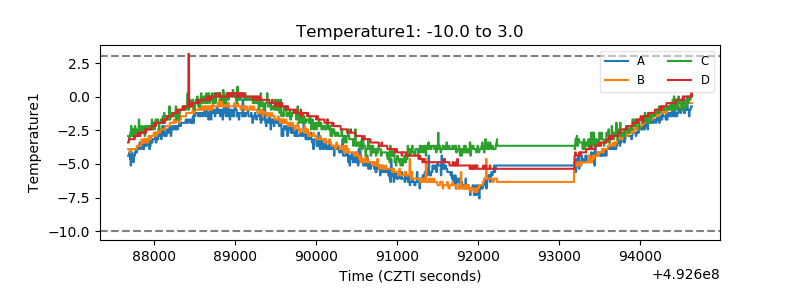 |
| Veto HV Monitor |  |
| Veto LLD | 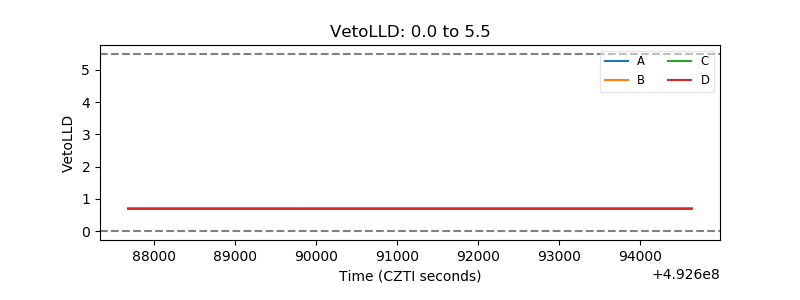 |
| Alpha Counter | 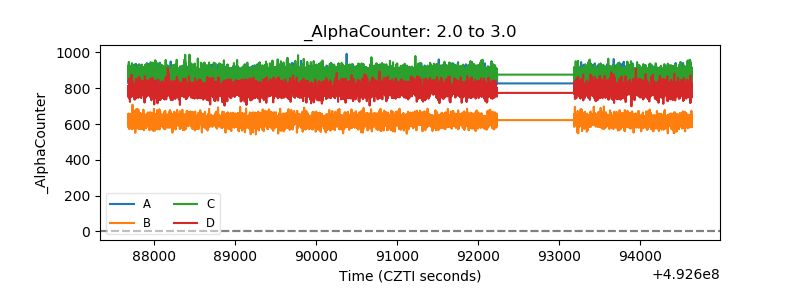 |
| _CPM_Rate |  |
| CZT Counter | 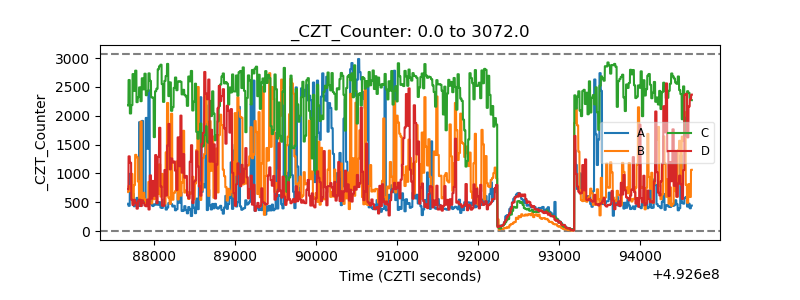 |
| +2.5 Volts monitor |  |
| +5 Volts monitor |  |
| _ROLL_ROT | 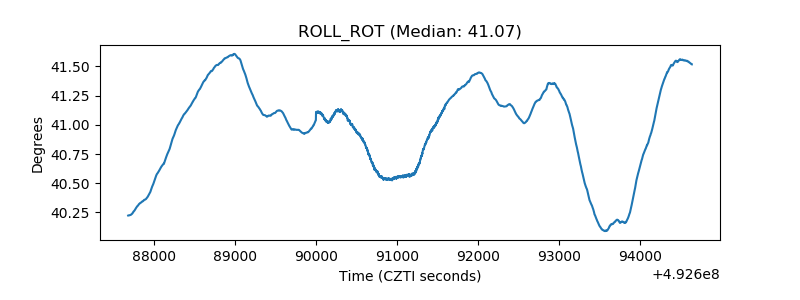 |
| _Roll_DEC | 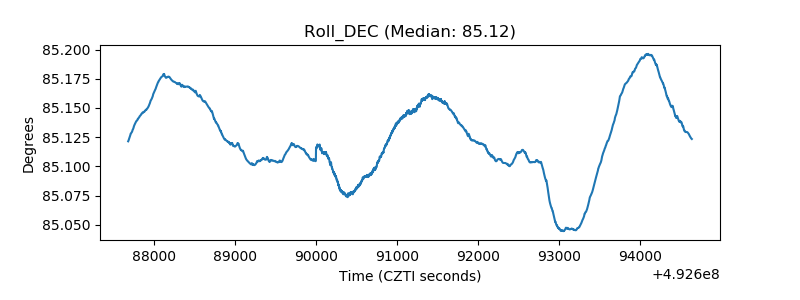 |
| _Roll_RA | 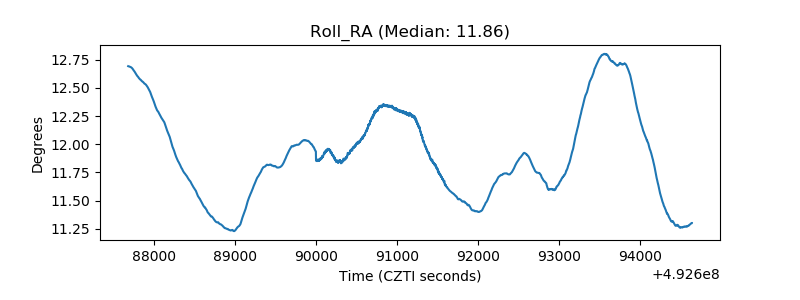 |
| Veto Counter | 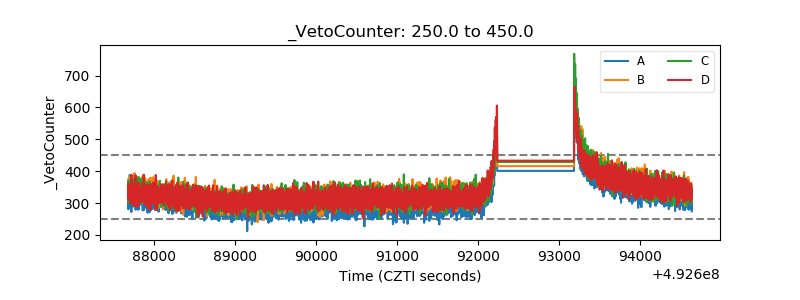 |