| Param | Original file | Final file |
|---|---|---|
| Filename | modeM0/AS1C09_011T09_9000006494_53410cztM0_level2.fits | modeM0/AS1C09_011T09_9000006494_53410cztM0_level2_quad_clean.evt |
| Size (bytes) | 998,968,320 | 69,730,560 |
| Size | 952.7 MB | 66.5 MB |
| Events in quadrant A | 4,152,435 | 600,357 |
| Events in quadrant B | 8,945,337 | 470,535 |
| Events in quadrant C | 15,330,288 | 132,097 |
| Events in quadrant D | 8,055,950 | 461,392 |
| Mode SS | |||
|---|---|---|---|
| Quadrant | BADHDUFLAG | Total packets | Discarded packets |
| A | 0 | 128 | 0 |
| B | 0 | 128 | 0 |
| C | 0 | 128 | 0 |
| D | 0 | 128 | 0 |
| Mode M0 | |||
|---|---|---|---|
| Quadrant | BADHDUFLAG | Total packets | Discarded packets |
| A | 0 | 16843 | 1 |
| B | 0 | 30997 | 1 |
| C | 0 | 49818 | 1 |
| D | 0 | 28395 | 6 |
| Mode M9 | |||
|---|---|---|---|
| Quadrant | BADHDUFLAG | Total packets | Discarded packets |
| A | 0 | 11 | 0 |
| B | 0 | 11 | 0 |
| C | 0 | 11 | 0 |
| D | 0 | 11 | 0 |
| Quadrant | Total seconds | Saturated seconds | Saturation percentage |
|---|---|---|---|
| A | 6405 | 406 | 6.338798% |
| B | 6406 | 2216 | 34.592569% |
| C | 6406 | 5269 | 82.251015% |
| D | 6405 | 1440 | 22.482436% |
Noise dominated data is calculated using 1-second bins in cleaned event files. If a bin has >2000 counts, and if more than 50% of those come from <1% of pixels, then it is considered to be noise-dominated and hence unusable.
| Quadrant | # 1 sec bins | Bins with >0 counts | Bins with >2000 counts | High rate bins dominated by noise | Noise dominated (total time) | Noise dominated (detector-on time) | Marked lightcurve |
|---|---|---|---|---|---|---|---|
| A | 7455 | 6405 | 238 | 238 | 3.19% | 3.72% | 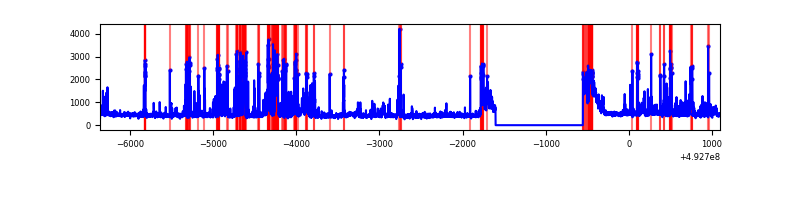 |
| B | 7455 | 6405 | 1791 | 1791 | 24.02% | 27.96% | 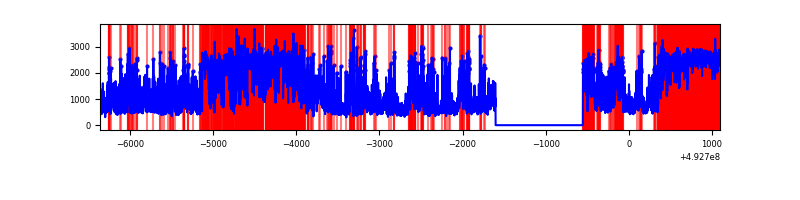 |
| C | 7455 | 6405 | 5124 | 5124 | 68.73% | 80.00% | 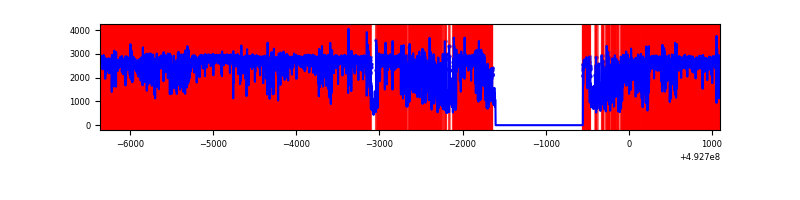 |
| D | 7454 | 6404 | 1233 | 1233 | 16.54% | 19.25% | 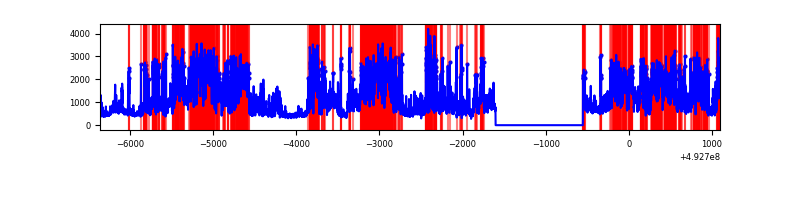 |
Top three noisy pixels from each quadrant. If the there are fewer than three noisy pixels in the level2.evt file, extra rows are filled as -1
| Pixel properties | Quadrant properties | ||||||
|---|---|---|---|---|---|---|---|
| Quadrant | DetID | PixID | Counts | Sigma | Mean | Median | Sigma |
| A | 3 | 63 | 445200 | 2659.95 | 671 | 653 | 167.1 |
| A | 15 | 174 | 418817 | 2502.09 | 671 | 653 | 167.1 |
| A | 7 | 191 | 146541 | 872.92 | 671 | 653 | 167.1 |
| B | 4 | 206 | 4333712 | 35554.67 | 574 | 553 | 121.9 |
| B | 4 | 171 | 894877 | 7338.16 | 574 | 553 | 121.9 |
| B | 2 | 249 | 261965 | 2144.95 | 574 | 553 | 121.9 |
| C | 1 | 241 | 8464154 | 89111.92 | 340 | 336 | 95.0 |
| C | 15 | 224 | 1419391 | 14940.62 | 340 | 336 | 95.0 |
| C | 6 | 13 | 1157128 | 12179.37 | 340 | 336 | 95.0 |
| D | 2 | 172 | 1599782 | 9157.6 | 617 | 590 | 174.6 |
| D | 2 | 249 | 1511534 | 8652.26 | 617 | 590 | 174.6 |
| D | 10 | 172 | 1254207 | 7178.7 | 617 | 590 | 174.6 |
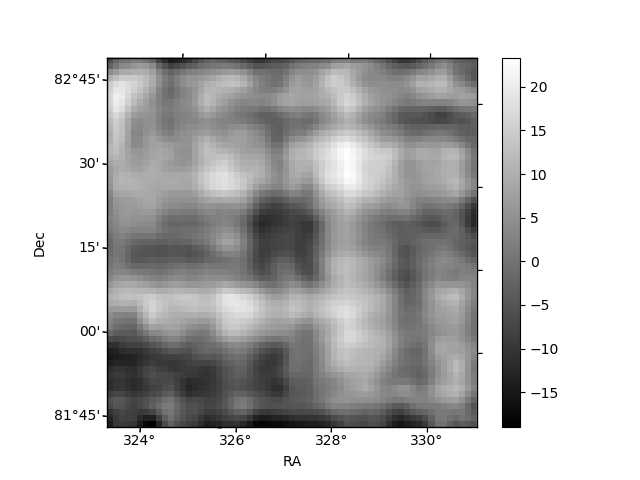
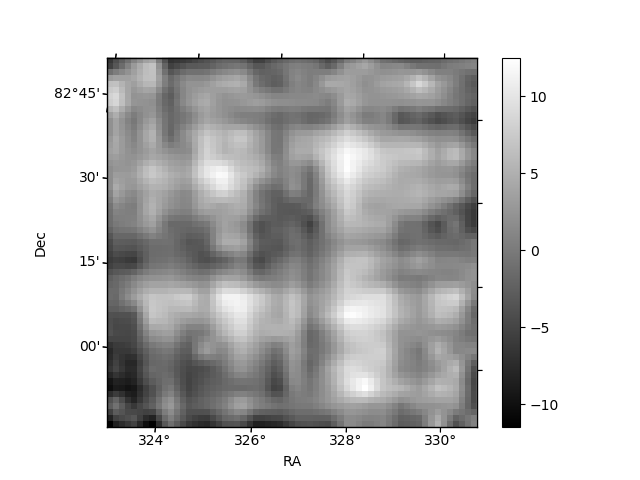
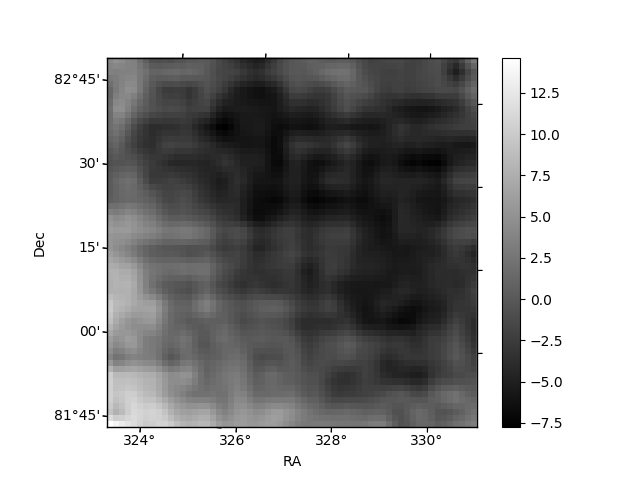
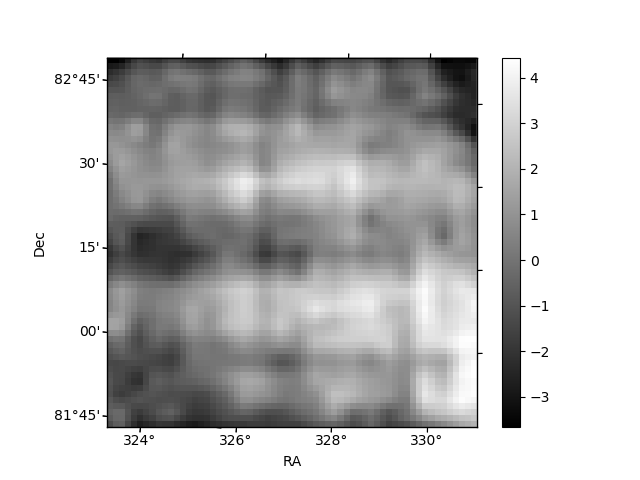
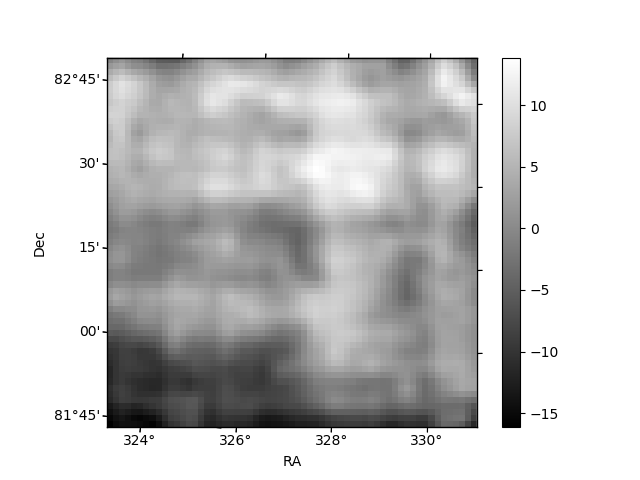
Histogram calculated using DETX and DETY for each event in the final _common_clean file
| Quadrant A | 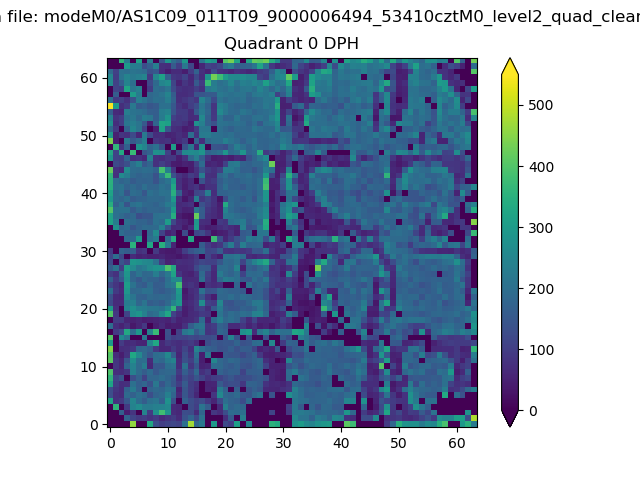 |
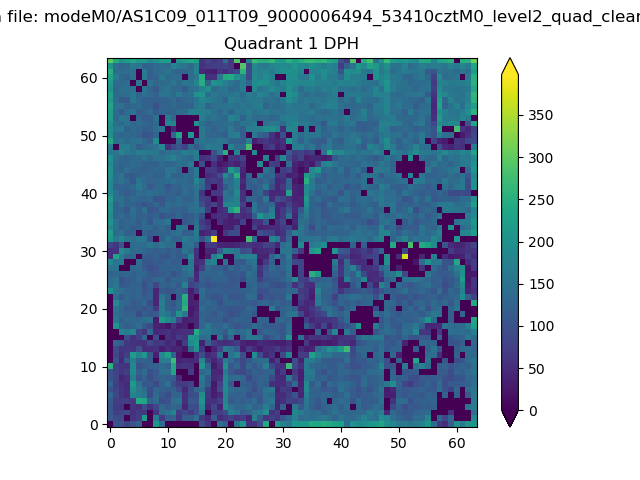 |
Quadrant B |
|---|---|---|---|
| Quadrant D | 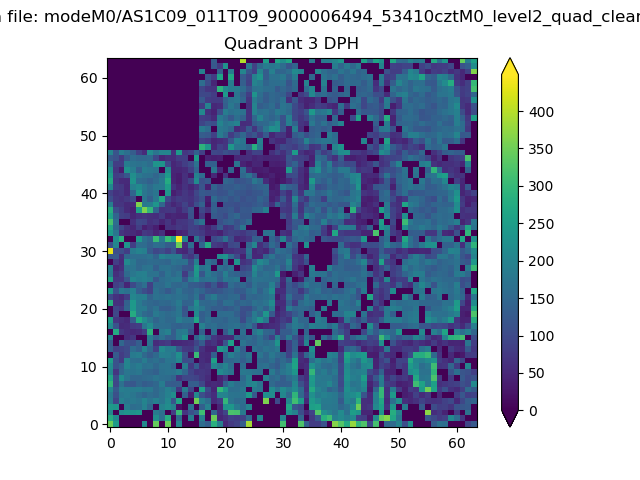 |
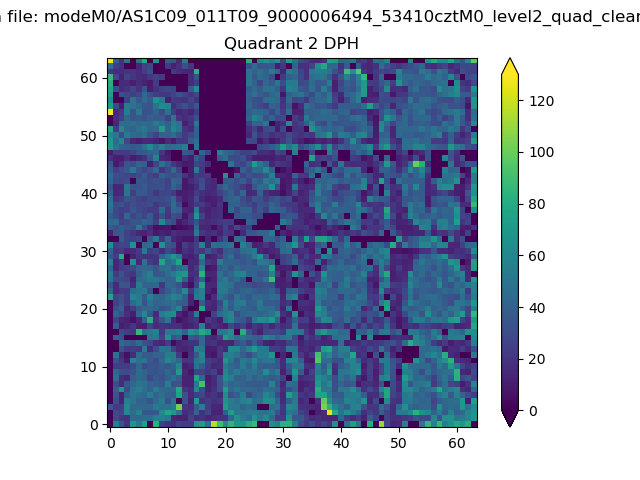 |
Quadrant C |
| Plot type | Count rate plots | Images |
|---|---|---|
| Comparison with Poisson distribution Blue bars denote a histogram of data divided into 1 sec bins. Red curve is a Poisson curve with rate = median count rate of data. |
 |
 |
| Quadrant-wise count rates Data is divided into 100 sec bins |
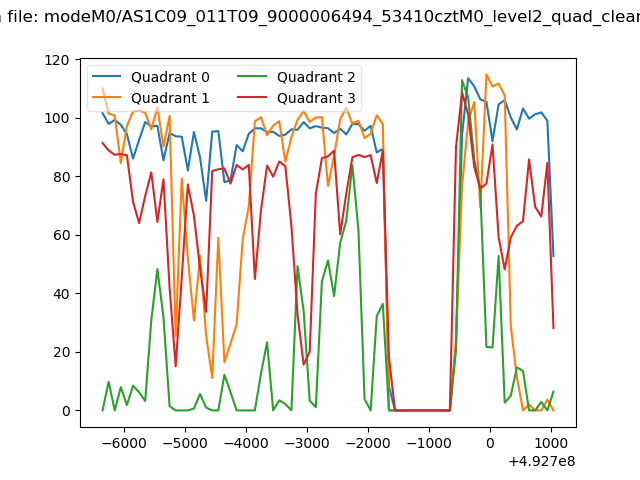 |
|
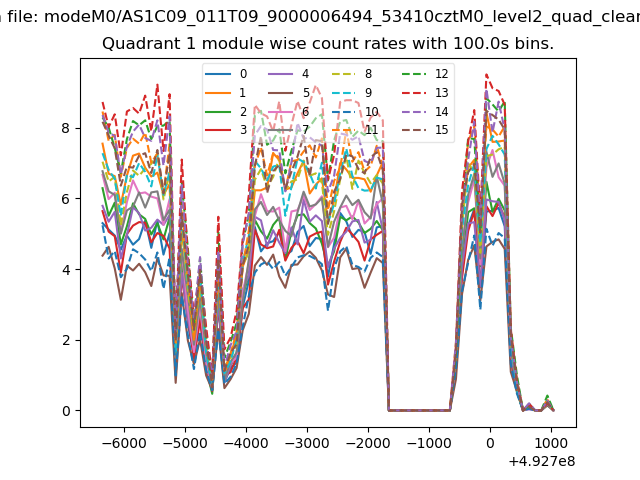
| Module-wise count rates for Quadrant A Data is divided into 100 sec bins |
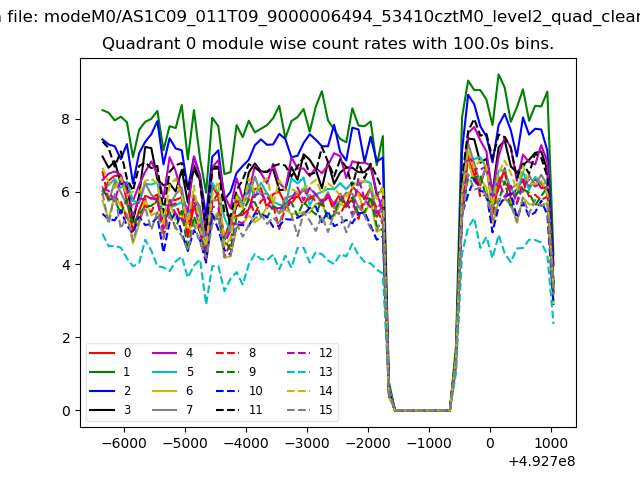 |
 |
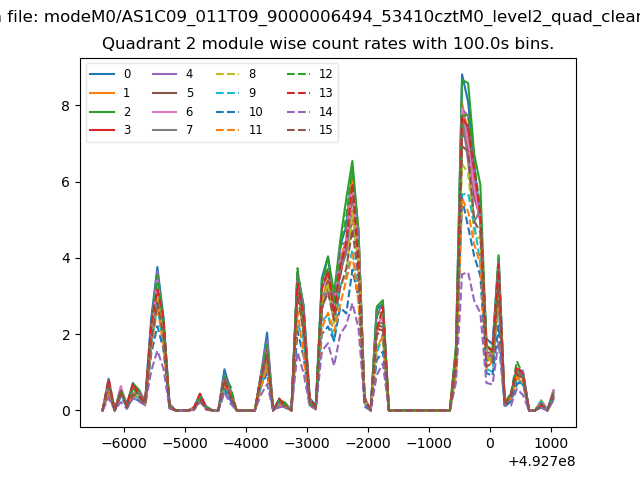
| Module-wise count rates for Quadrant B Data is divided into 100 sec bins |
 |
 |
| Module-wise count rates for Quadrant C Data is divided into 100 sec bins |
 |
 |
| Module-wise count rates for Quadrant D Data is divided into 100 sec bins |
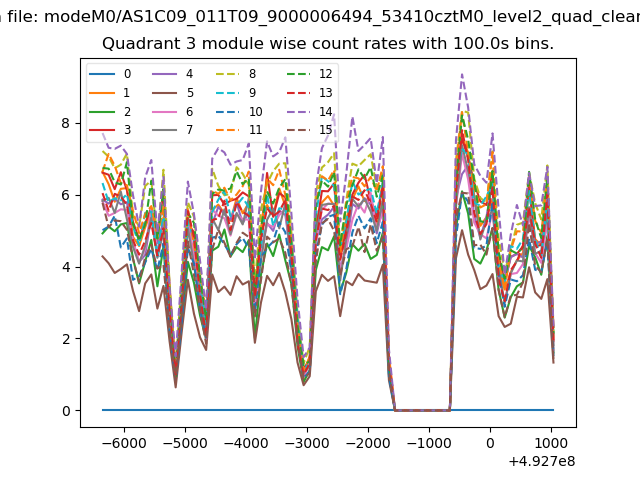 |
 |
| Parameter | Plot |
|---|---|
| CZT HV Monitor | 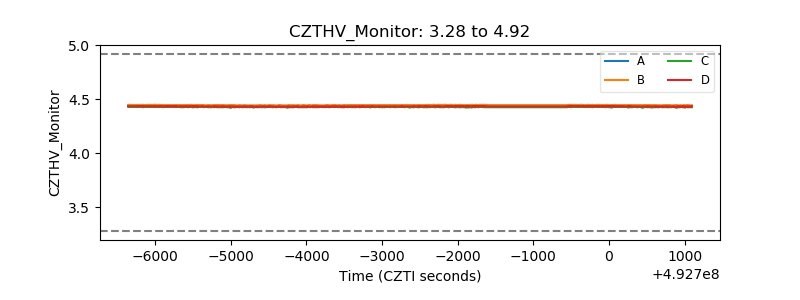 |
| D_VDD | 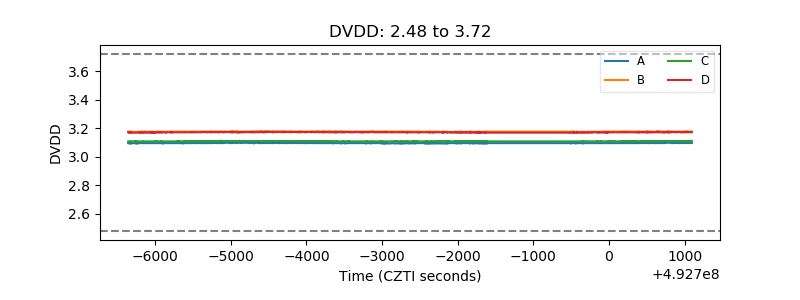 |
| Temperature 1 | 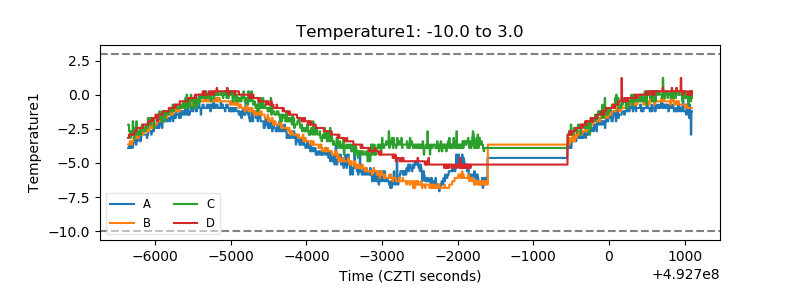 |
| Veto HV Monitor | 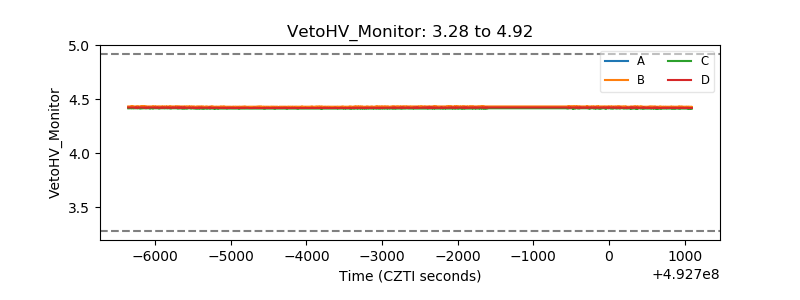 |
| Veto LLD | 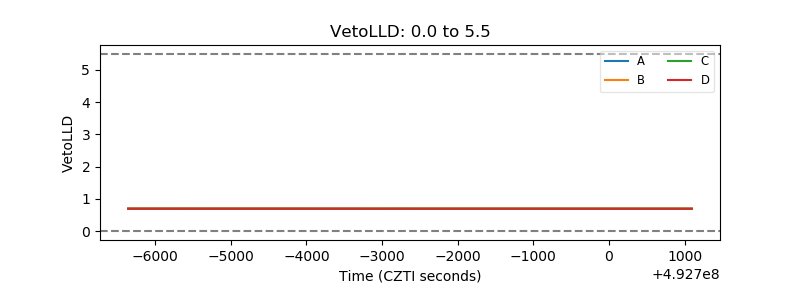 |
| Alpha Counter | 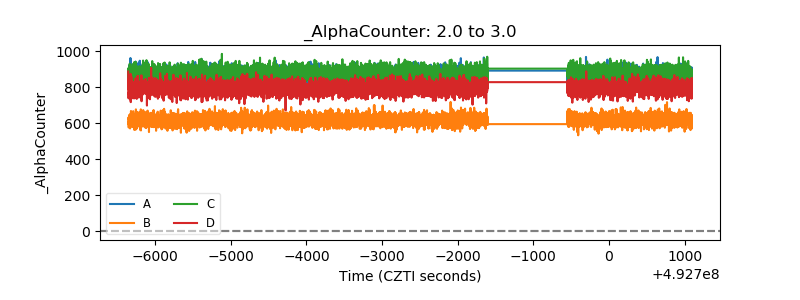 |
| _CPM_Rate | 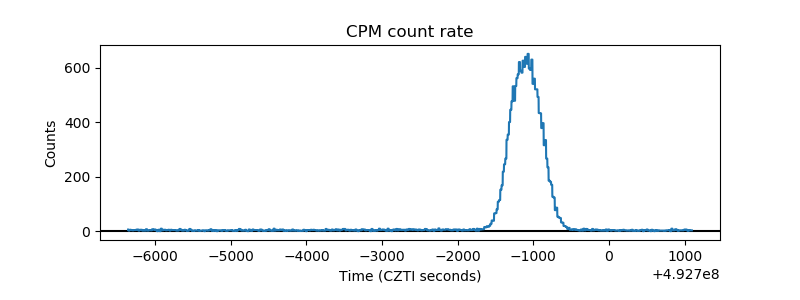 |
| CZT Counter | 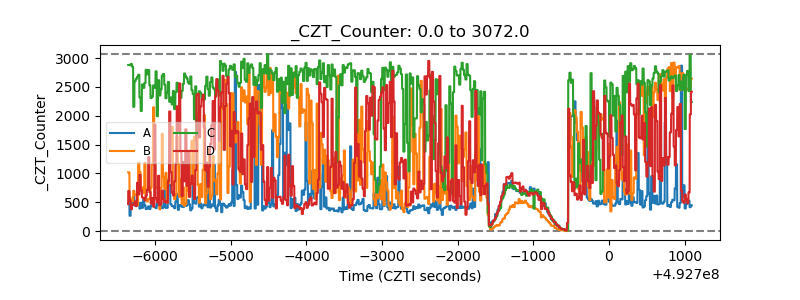 |
| +2.5 Volts monitor |  |
| +5 Volts monitor |  |
| _ROLL_ROT | 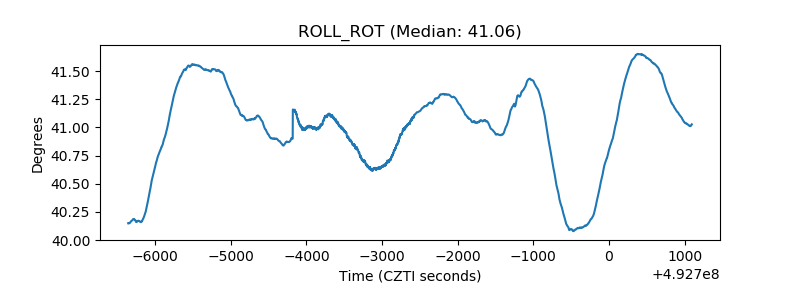 |
| _Roll_DEC | 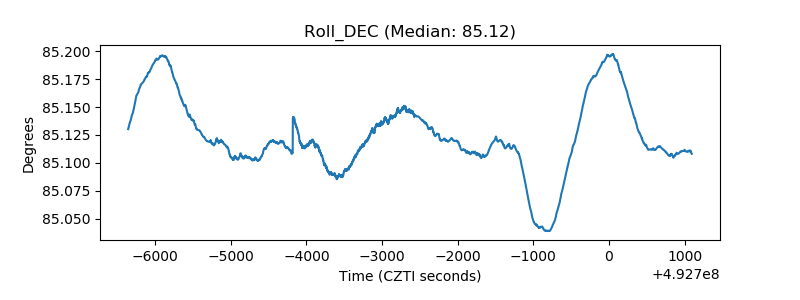 |
| _Roll_RA | 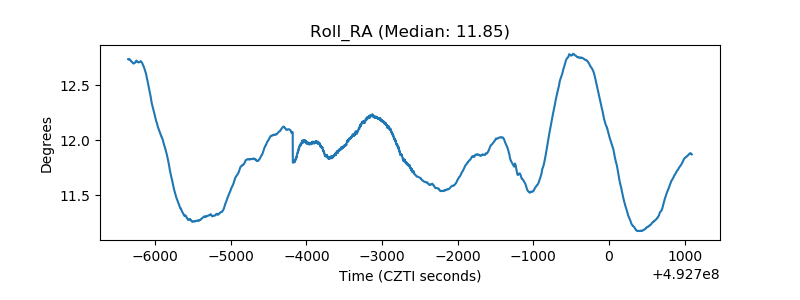 |
| Veto Counter | 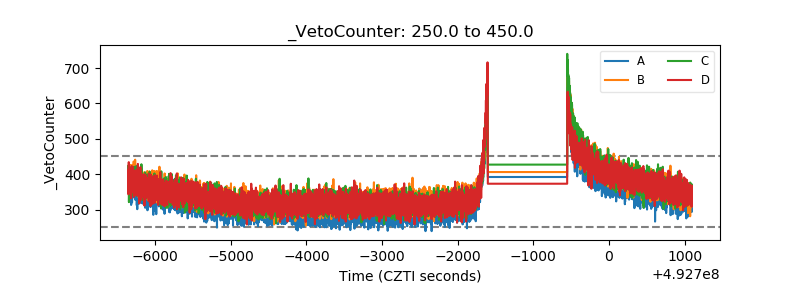 |