| Param | Original file | Final file |
|---|---|---|
| Filename | modeM0/AS1C09_011T09_9000006494_53411cztM0_level2.fits | modeM0/AS1C09_011T09_9000006494_53411cztM0_level2_quad_clean.evt |
| Size (bytes) | 887,114,880 | 64,013,760 |
| Size | 846.0 MB | 61.0 MB |
| Events in quadrant A | 4,042,635 | 582,062 |
| Events in quadrant B | 10,117,108 | 243,740 |
| Events in quadrant C | 12,349,024 | 221,524 |
| Events in quadrant D | 5,866,913 | 473,840 |
| Mode SS | |||
|---|---|---|---|
| Quadrant | BADHDUFLAG | Total packets | Discarded packets |
| A | 0 | 120 | 0 |
| B | 0 | 120 | 0 |
| C | 0 | 120 | 0 |
| D | 0 | 120 | 0 |
| Mode M0 | |||
|---|---|---|---|
| Quadrant | BADHDUFLAG | Total packets | Discarded packets |
| A | 0 | 16088 | 1 |
| B | 0 | 34105 | 1 |
| C | 0 | 40702 | 8 |
| D | 0 | 21565 | 1 |
| Mode M9 | |||
|---|---|---|---|
| Quadrant | BADHDUFLAG | Total packets | Discarded packets |
| A | 0 | 11 | 0 |
| B | 0 | 11 | 0 |
| C | 0 | 11 | 0 |
| D | 0 | 11 | 0 |
| Quadrant | Total seconds | Saturated seconds | Saturation percentage |
|---|---|---|---|
| A | 5969 | 317 | 5.310772% |
| B | 5969 | 3971 | 66.527056% |
| C | 5968 | 3953 | 66.236595% |
| D | 5969 | 880 | 14.742838% |
Noise dominated data is calculated using 1-second bins in cleaned event files. If a bin has >2000 counts, and if more than 50% of those come from <1% of pixels, then it is considered to be noise-dominated and hence unusable.
| Quadrant | # 1 sec bins | Bins with >0 counts | Bins with >2000 counts | High rate bins dominated by noise | Noise dominated (total time) | Noise dominated (detector-on time) | Marked lightcurve |
|---|---|---|---|---|---|---|---|
| A | 7094 | 5969 | 199 | 199 | 2.81% | 3.33% |  |
| B | 7094 | 5969 | 2912 | 2912 | 41.05% | 48.79% | 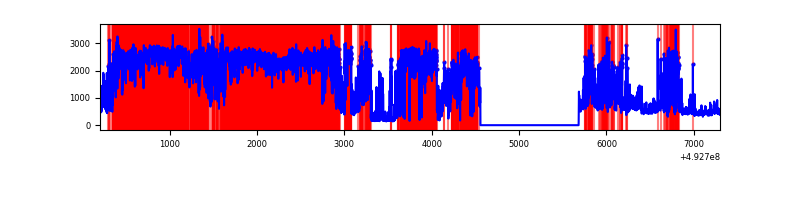 |
| C | 7092 | 5967 | 3719 | 3719 | 52.44% | 62.33% | 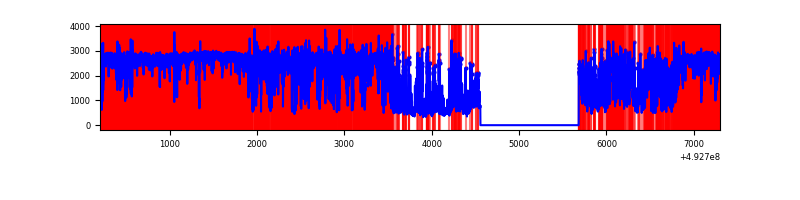 |
| D | 7094 | 5969 | 737 | 737 | 10.39% | 12.35% | 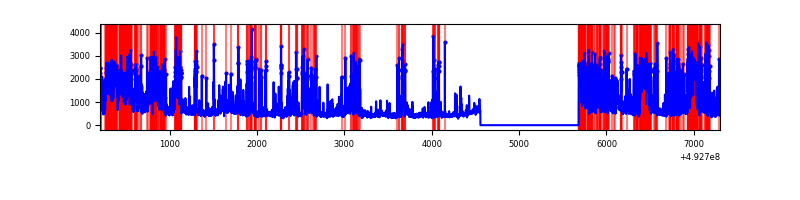 |
Top three noisy pixels from each quadrant. If the there are fewer than three noisy pixels in the level2.evt file, extra rows are filled as -1
| Pixel properties | Quadrant properties | ||||||
|---|---|---|---|---|---|---|---|
| Quadrant | DetID | PixID | Counts | Sigma | Mean | Median | Sigma |
| A | 3 | 63 | 722071 | 4581.23 | 632 | 616 | 157.5 |
| A | 15 | 174 | 267202 | 1692.82 | 632 | 616 | 157.5 |
| A | 3 | 62 | 113875 | 719.19 | 632 | 616 | 157.5 |
| B | 4 | 206 | 6234468 | 80851.06 | 361 | 351 | 77.1 |
| B | 2 | 249 | 1560096 | 20228.53 | 361 | 351 | 77.1 |
| B | 4 | 171 | 238055 | 3082.81 | 361 | 351 | 77.1 |
| C | 1 | 241 | 5629993 | 53078.05 | 386 | 382 | 106.1 |
| C | 15 | 224 | 2939337 | 27709.55 | 386 | 382 | 106.1 |
| C | 9 | 38 | 596619 | 5621.54 | 386 | 382 | 106.1 |
| D | 2 | 172 | 829171 | 4996.99 | 585 | 560 | 165.8 |
| D | 11 | 245 | 741470 | 4468.1 | 585 | 560 | 165.8 |
| D | 2 | 153 | 392584 | 2364.13 | 585 | 560 | 165.8 |
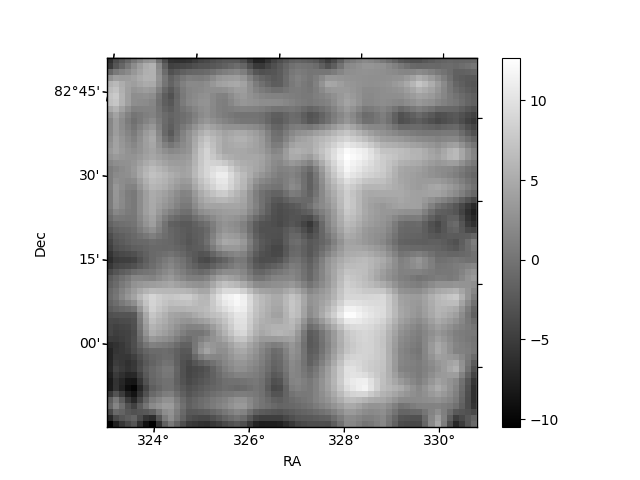
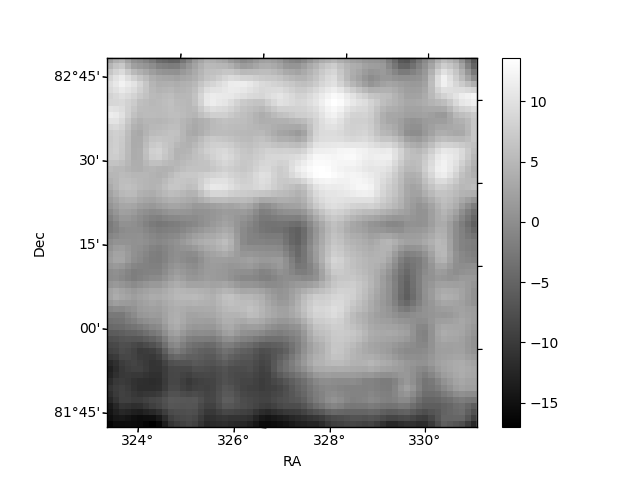
Histogram calculated using DETX and DETY for each event in the final _common_clean file
| Quadrant A | 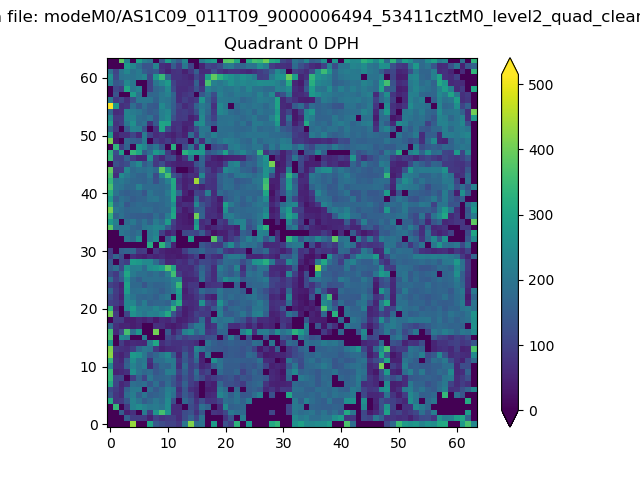 |
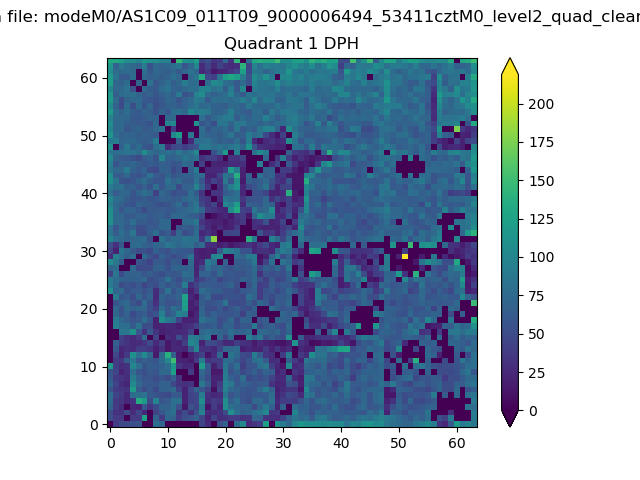 |
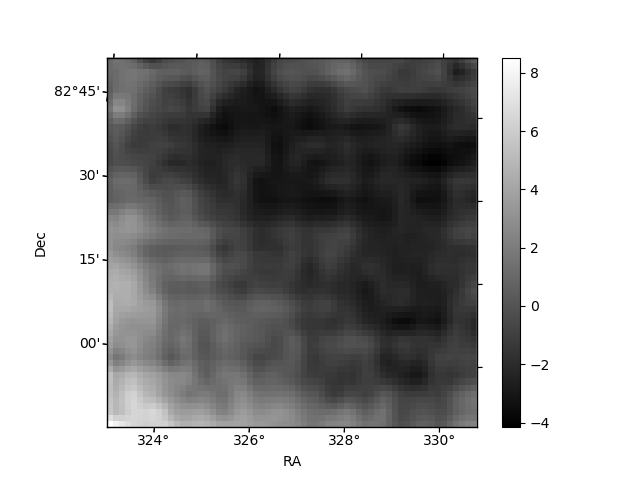
Quadrant B |
|---|---|---|---|
| Quadrant D | 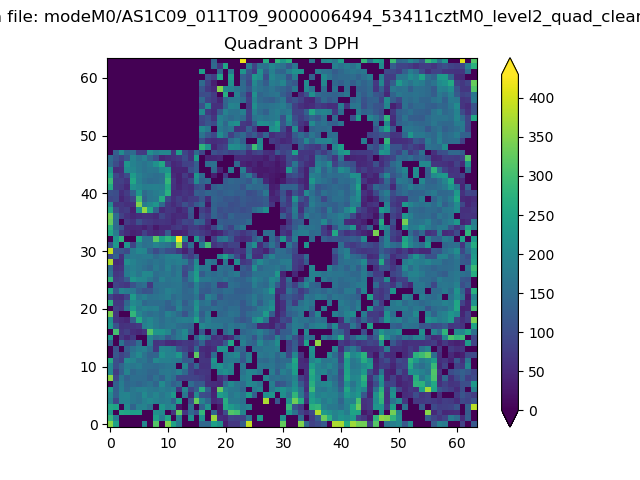 |
 |
Quadrant C |
| Plot type | Count rate plots | Images |
|---|---|---|
| Comparison with Poisson distribution Blue bars denote a histogram of data divided into 1 sec bins. Red curve is a Poisson curve with rate = median count rate of data. |
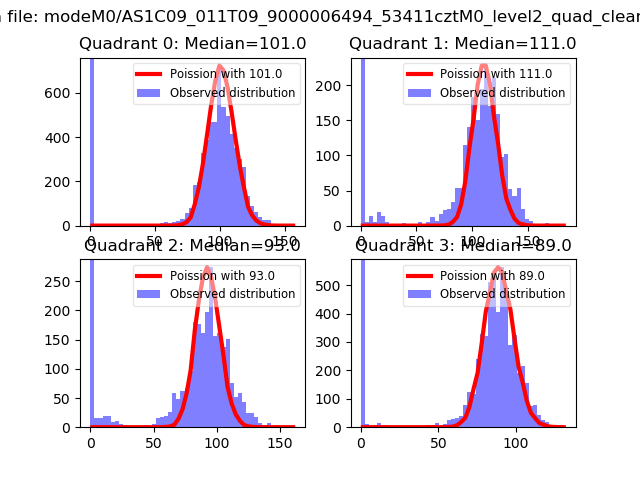 |
 |
| Quadrant-wise count rates Data is divided into 100 sec bins |
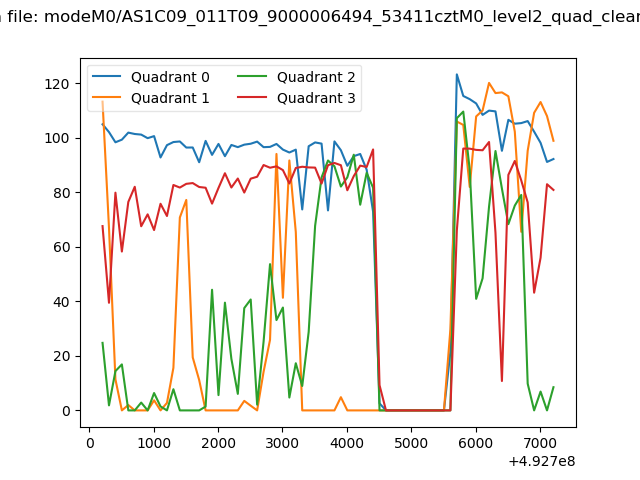 |
|
| Module-wise count rates for Quadrant A Data is divided into 100 sec bins |
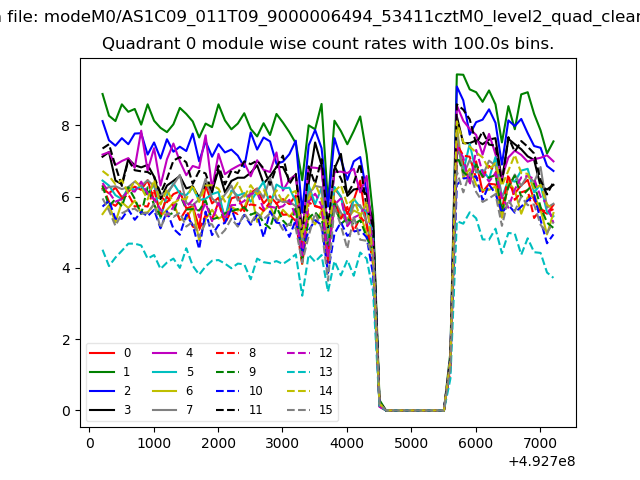 |
 |
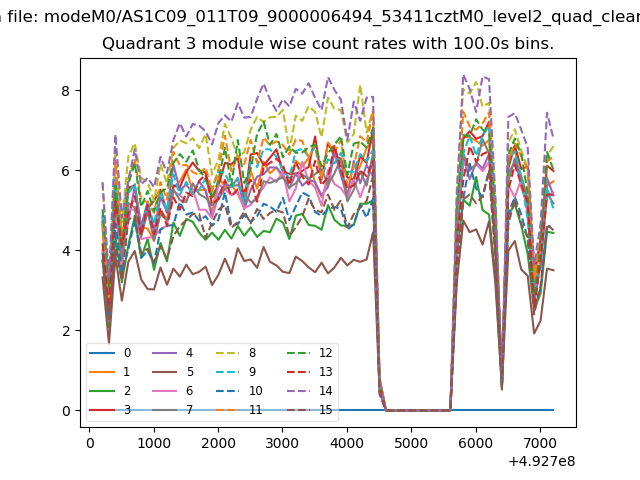
| Module-wise count rates for Quadrant B Data is divided into 100 sec bins |
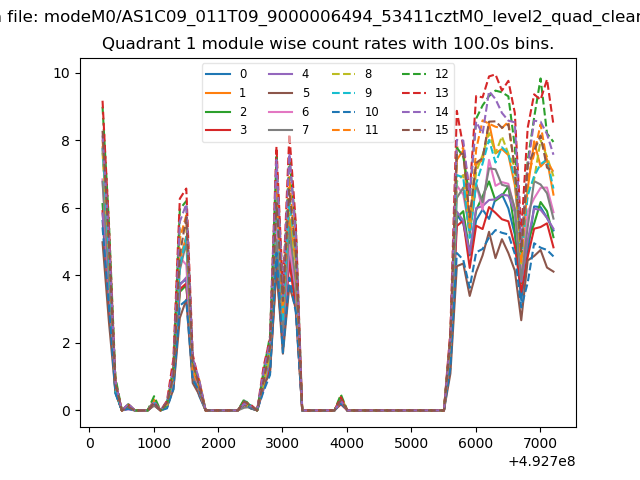 |
 |
| Module-wise count rates for Quadrant C Data is divided into 100 sec bins |
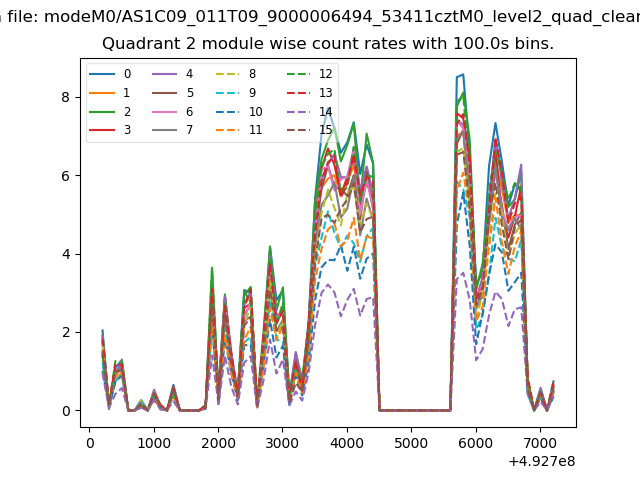 |
 |
| Module-wise count rates for Quadrant D Data is divided into 100 sec bins |
 |
 |
| Parameter | Plot |
|---|---|
| CZT HV Monitor |  |
| D_VDD | 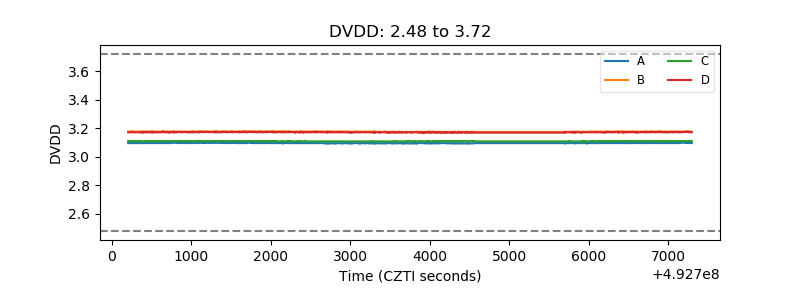 |
| Temperature 1 | 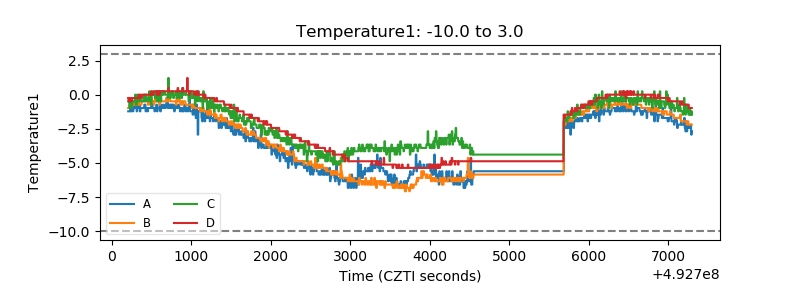 |
| Veto HV Monitor | 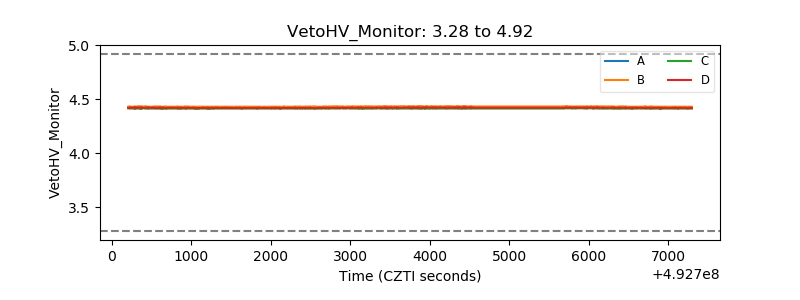 |
| Veto LLD | 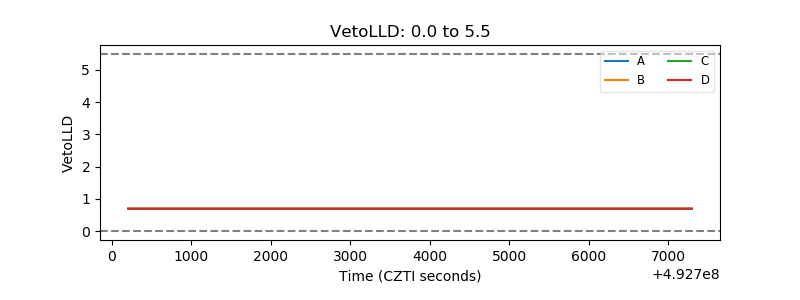 |
| Alpha Counter |  |
| _CPM_Rate | 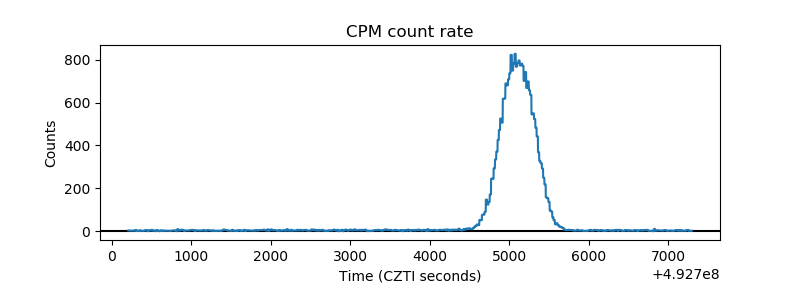 |
| CZT Counter | 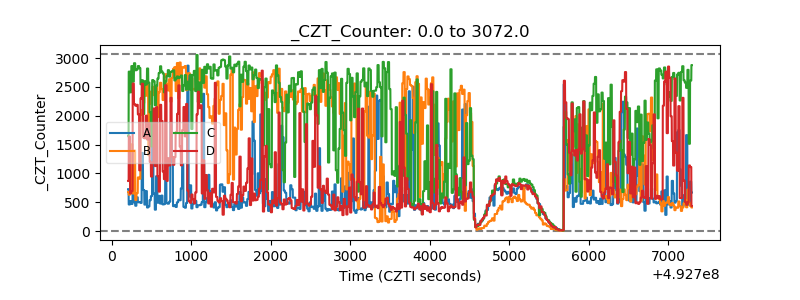 |
| +2.5 Volts monitor | 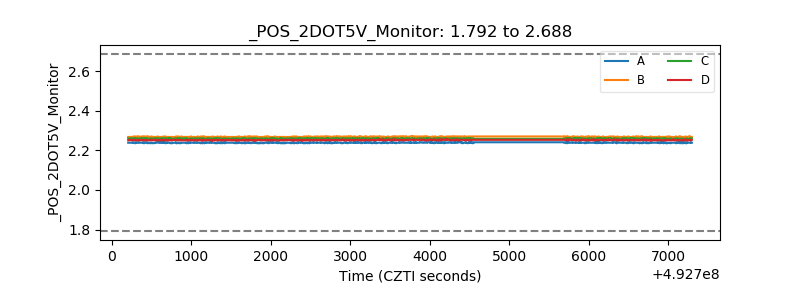 |
| +5 Volts monitor |  |
| _ROLL_ROT | 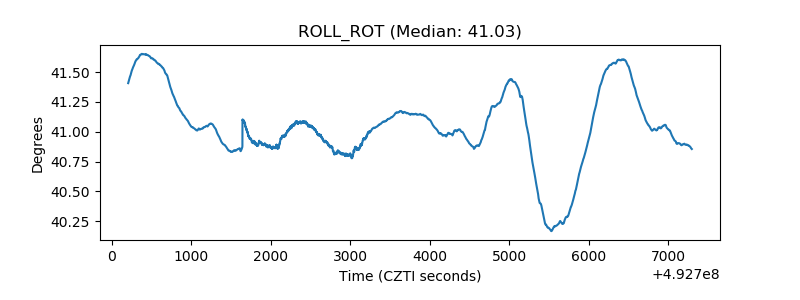 |
| _Roll_DEC | 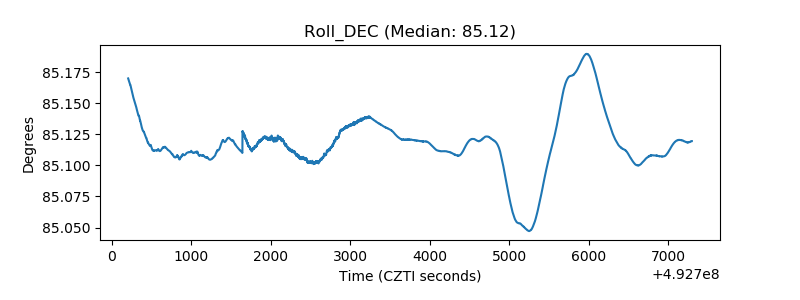 |
| _Roll_RA |  |
| Veto Counter | 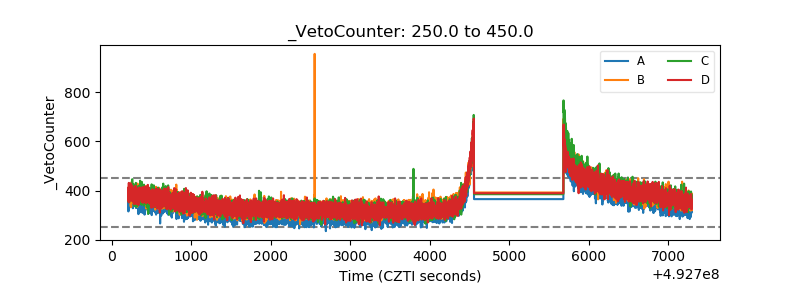 |