| Param | Original file | Final file |
|---|---|---|
| Filename | modeM0/AS1C09_011T09_9000006494_53412cztM0_level2.fits | modeM0/AS1C09_011T09_9000006494_53412cztM0_level2_quad_clean.evt |
| Size (bytes) | 777,628,800 | 77,417,280 |
| Size | 741.6 MB | 73.8 MB |
| Events in quadrant A | 4,752,286 | 594,602 |
| Events in quadrant B | 4,681,417 | 623,721 |
| Events in quadrant C | 13,565,574 | 184,227 |
| Events in quadrant D | 5,309,831 | 512,017 |
| Mode SS | |||
|---|---|---|---|
| Quadrant | BADHDUFLAG | Total packets | Discarded packets |
| A | 0 | 126 | 0 |
| B | 0 | 126 | 0 |
| C | 0 | 126 | 0 |
| D | 0 | 126 | 0 |
| Mode M0 | |||
|---|---|---|---|
| Quadrant | BADHDUFLAG | Total packets | Discarded packets |
| A | 0 | 18430 | 1 |
| B | 0 | 18165 | 1 |
| C | 0 | 44318 | 1 |
| D | 0 | 20142 | 4 |
| Mode M9 | |||
|---|---|---|---|
| Quadrant | BADHDUFLAG | Total packets | Discarded packets |
| A | 0 | 11 | 0 |
| B | 0 | 11 | 0 |
| C | 0 | 11 | 0 |
| D | 0 | 11 | 0 |
| Quadrant | Total seconds | Saturated seconds | Saturation percentage |
|---|---|---|---|
| A | 6147 | 459 | 7.467057% |
| B | 6148 | 559 | 9.092388% |
| C | 6148 | 4410 | 71.730644% |
| D | 6147 | 655 | 10.655604% |
Noise dominated data is calculated using 1-second bins in cleaned event files. If a bin has >2000 counts, and if more than 50% of those come from <1% of pixels, then it is considered to be noise-dominated and hence unusable.
| Quadrant | # 1 sec bins | Bins with >0 counts | Bins with >2000 counts | High rate bins dominated by noise | Noise dominated (total time) | Noise dominated (detector-on time) | Marked lightcurve |
|---|---|---|---|---|---|---|---|
| A | 7307 | 6147 | 309 | 309 | 4.23% | 5.03% | 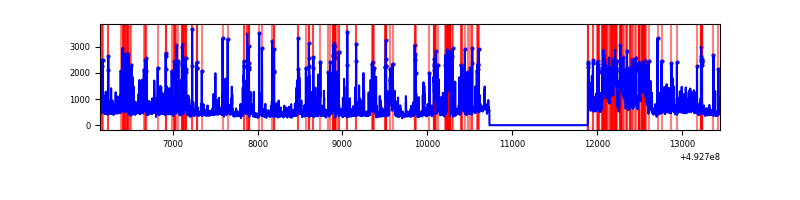 |
| B | 7308 | 6148 | 361 | 361 | 4.94% | 5.87% | 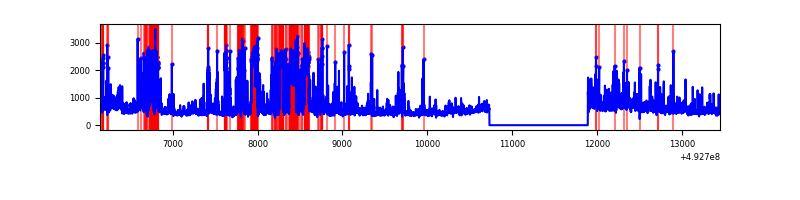 |
| C | 7307 | 6147 | 4277 | 4277 | 58.53% | 69.58% | 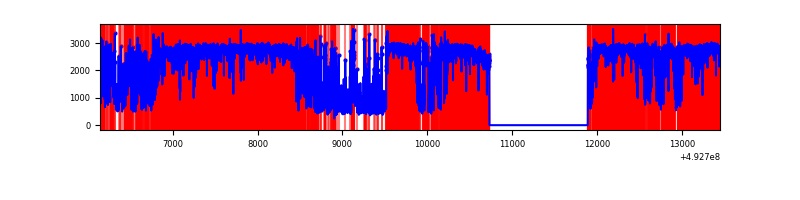 |
| D | 7307 | 6147 | 579 | 579 | 7.92% | 9.42% | 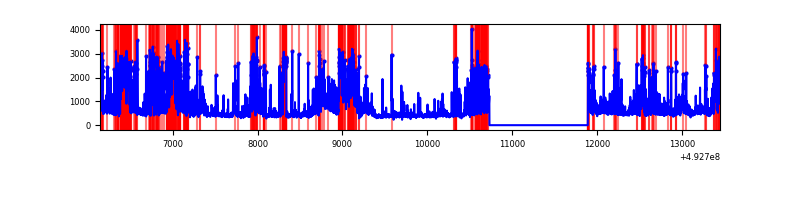 |
Top three noisy pixels from each quadrant. If the there are fewer than three noisy pixels in the level2.evt file, extra rows are filled as -1
| Pixel properties | Quadrant properties | ||||||
|---|---|---|---|---|---|---|---|
| Quadrant | DetID | PixID | Counts | Sigma | Mean | Median | Sigma |
| A | 3 | 63 | 1115072 | 6875.69 | 648 | 631 | 162.1 |
| A | 8 | 231 | 561665 | 3461.37 | 648 | 631 | 162.1 |
| A | 15 | 174 | 169136 | 1039.61 | 648 | 631 | 162.1 |
| B | 4 | 206 | 1176198 | 8789.81 | 638 | 616 | 133.7 |
| B | 0 | 171 | 274208 | 2045.64 | 638 | 616 | 133.7 |
| B | 4 | 171 | 124183 | 923.91 | 638 | 616 | 133.7 |
| C | 1 | 241 | 8621438 | 95856.94 | 325 | 322 | 89.9 |
| C | 15 | 224 | 2115370 | 23516.91 | 325 | 322 | 89.9 |
| C | 9 | 38 | 594012 | 6601.15 | 325 | 322 | 89.9 |
| D | 11 | 245 | 1039076 | 5963.22 | 614 | 587 | 174.1 |
| D | 10 | 172 | 380666 | 2182.49 | 614 | 587 | 174.1 |
| D | 12 | 6 | 350589 | 2009.78 | 614 | 587 | 174.1 |
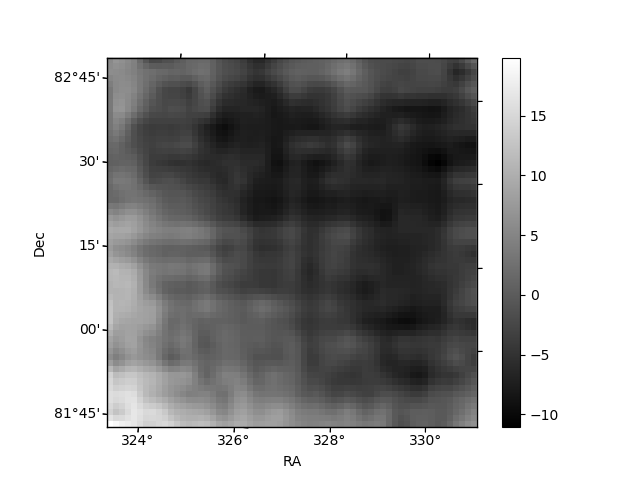
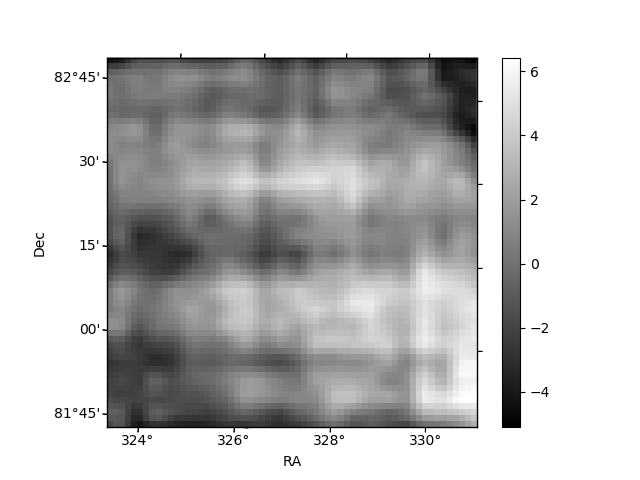
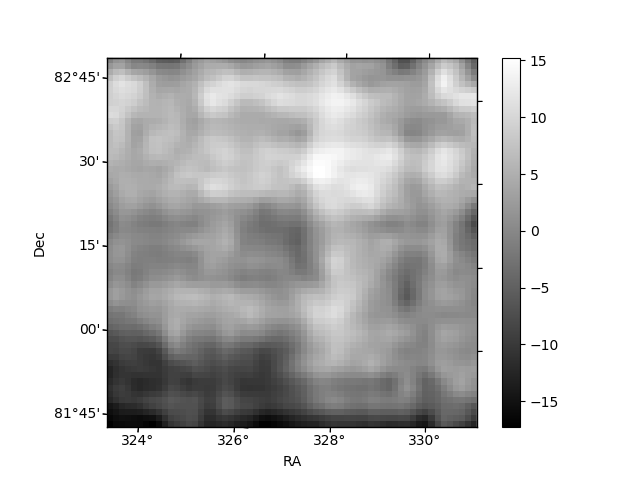
Histogram calculated using DETX and DETY for each event in the final _common_clean file
| Quadrant A | 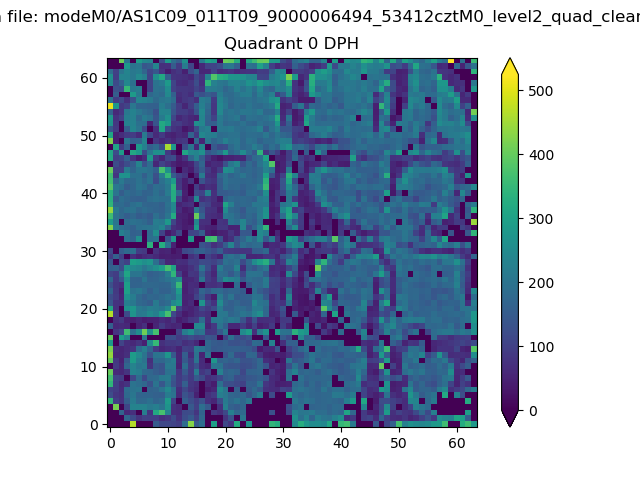 |
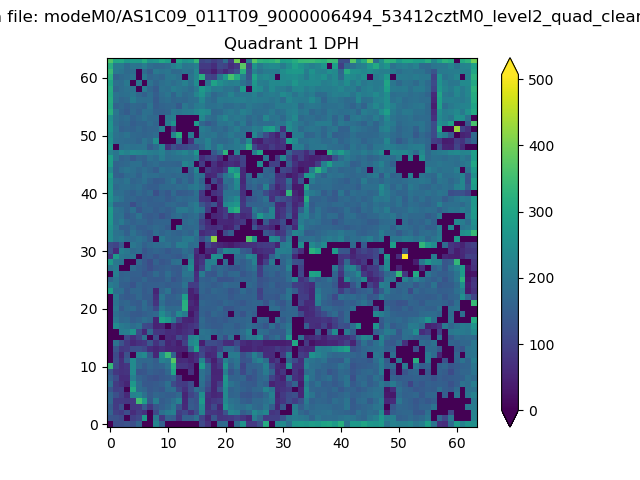 |
Quadrant B |
|---|---|---|---|
| Quadrant D | 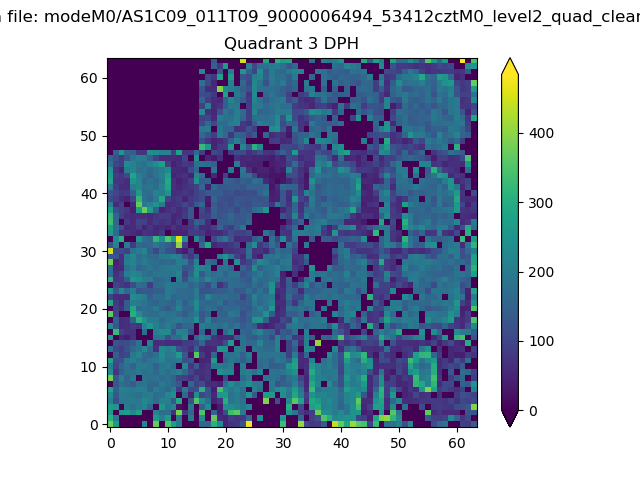 |
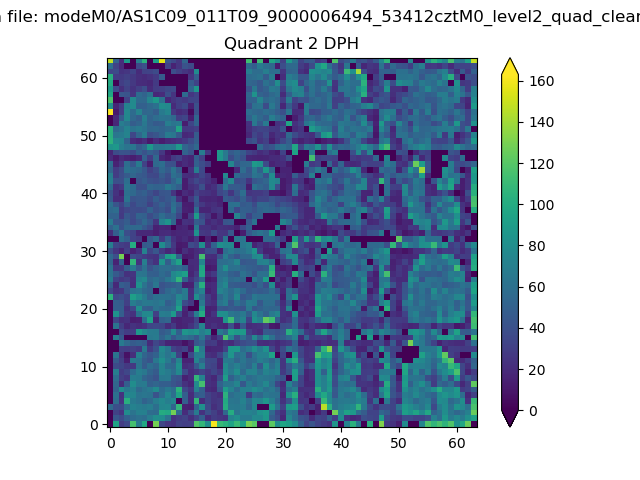 |
Quadrant C |
| Plot type | Count rate plots | Images |
|---|---|---|
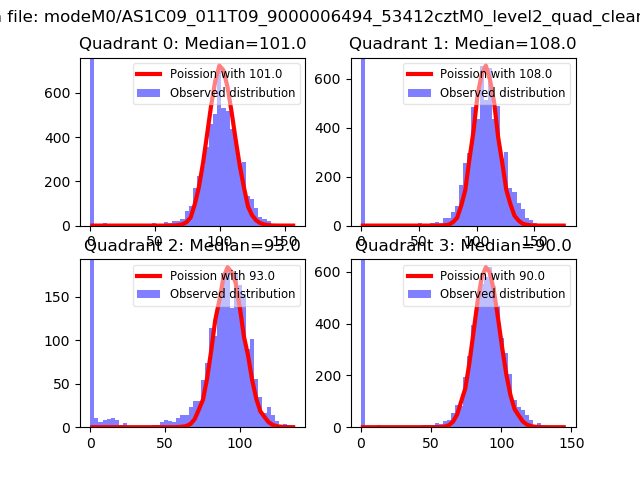
| Comparison with Poisson distribution Blue bars denote a histogram of data divided into 1 sec bins. Red curve is a Poisson curve with rate = median count rate of data. |
 |
 |
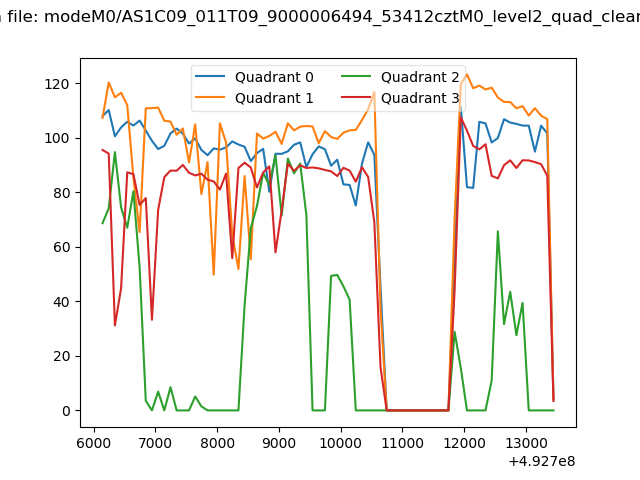
| Quadrant-wise count rates Data is divided into 100 sec bins |
 |
|
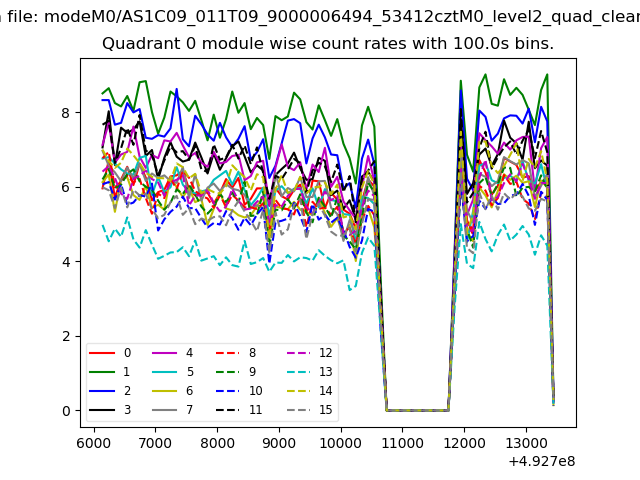
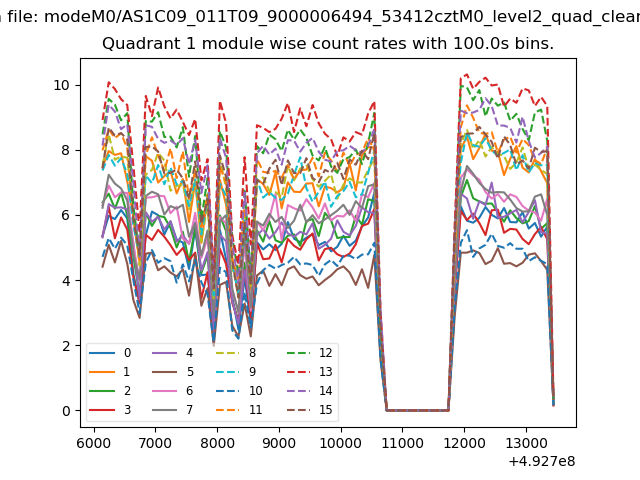
| Module-wise count rates for Quadrant A Data is divided into 100 sec bins |
 |
 |
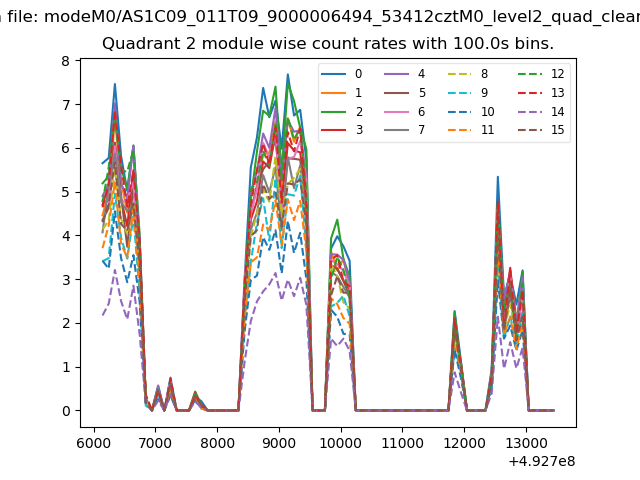
| Module-wise count rates for Quadrant B Data is divided into 100 sec bins |
 |
 |
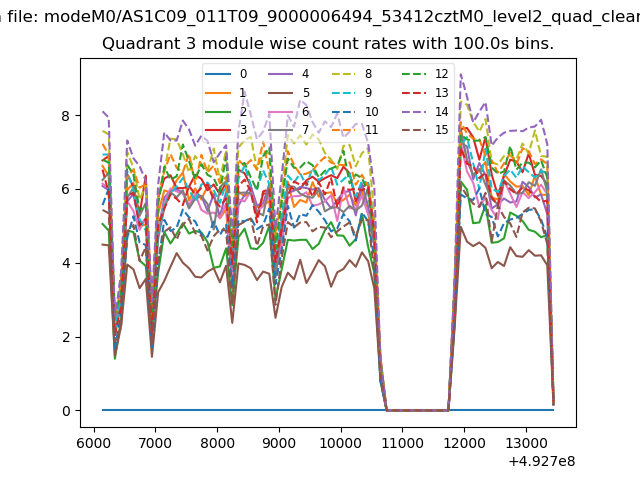
| Module-wise count rates for Quadrant C Data is divided into 100 sec bins |
 |
 |
| Module-wise count rates for Quadrant D Data is divided into 100 sec bins |
 |
 |
| Parameter | Plot |
|---|---|
| CZT HV Monitor | 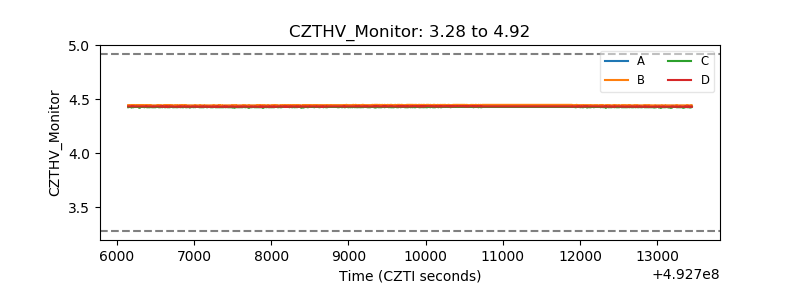 |
| D_VDD | 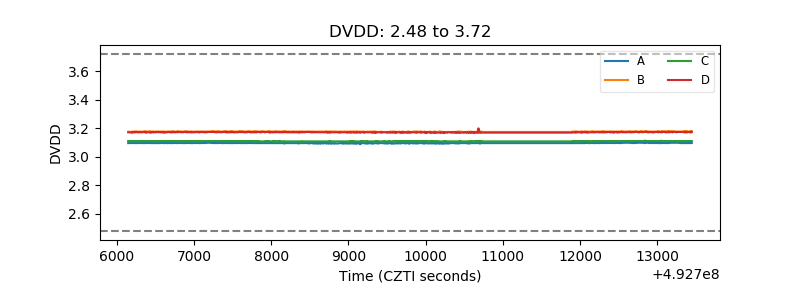 |
| Temperature 1 | 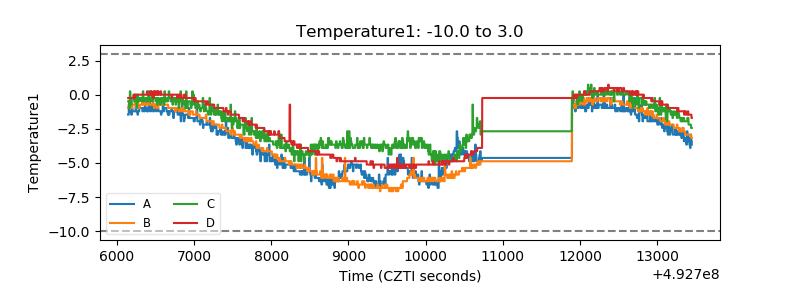 |
| Veto HV Monitor | 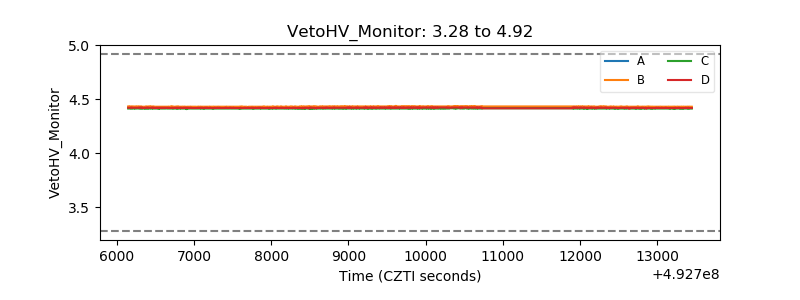 |
| Veto LLD | 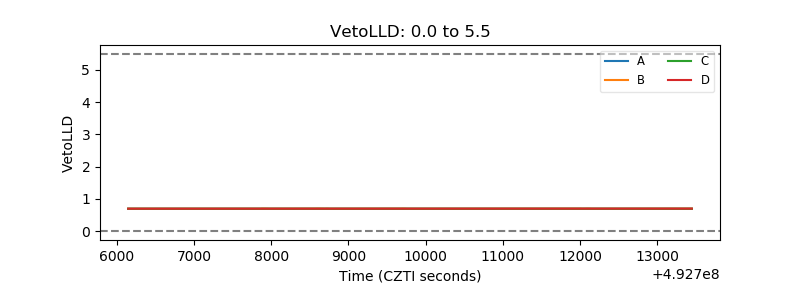 |
| Alpha Counter |  |
| _CPM_Rate | 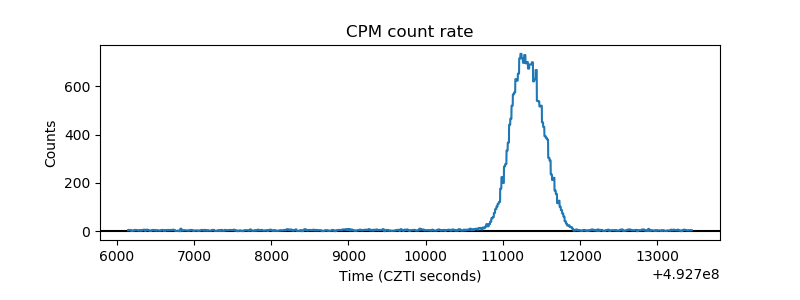 |
| CZT Counter | 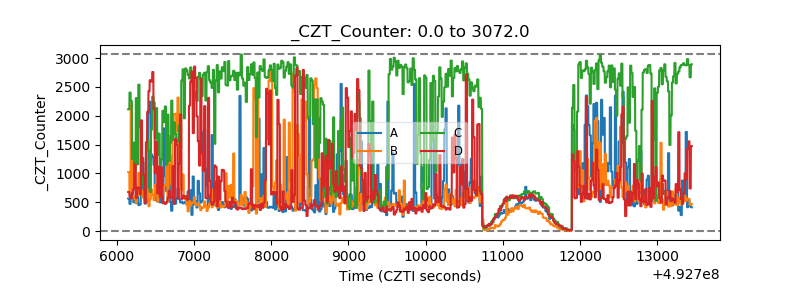 |
| +2.5 Volts monitor | 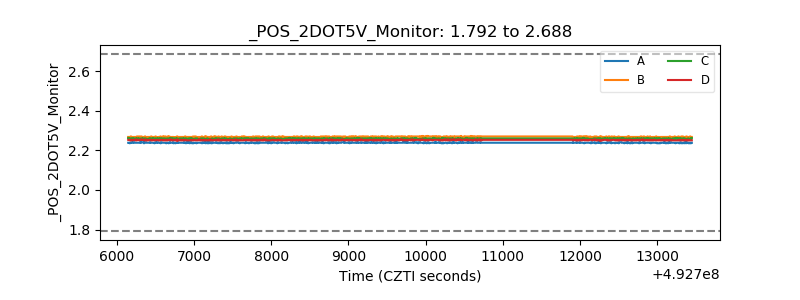 |
| +5 Volts monitor | 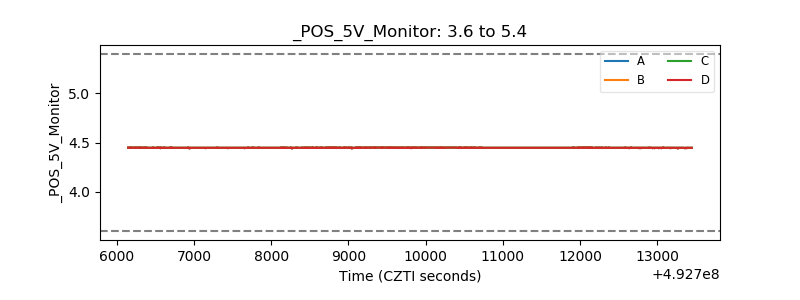 |
| _ROLL_ROT | 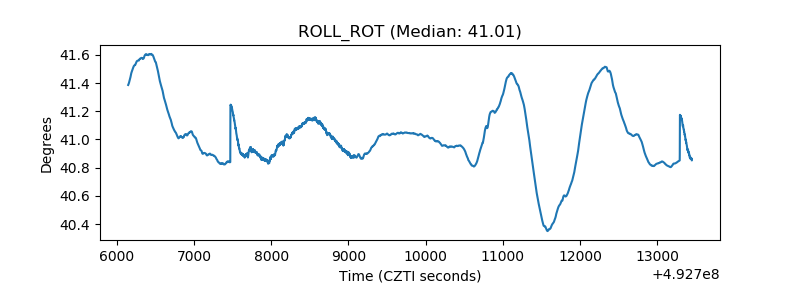 |
| _Roll_DEC | 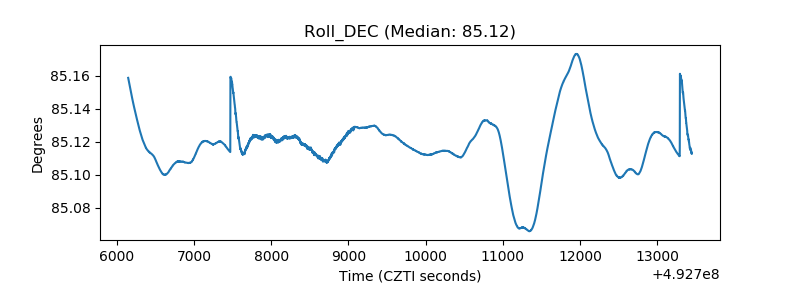 |
| _Roll_RA | 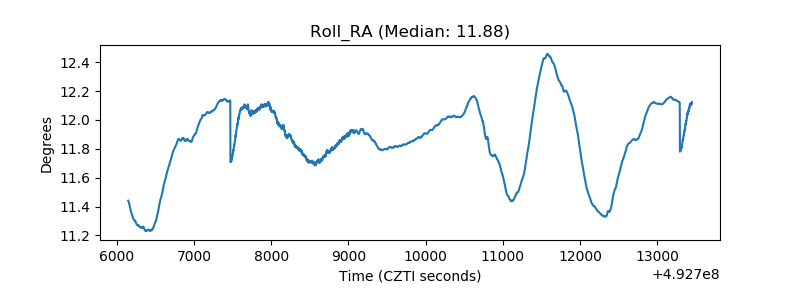 |
| Veto Counter | 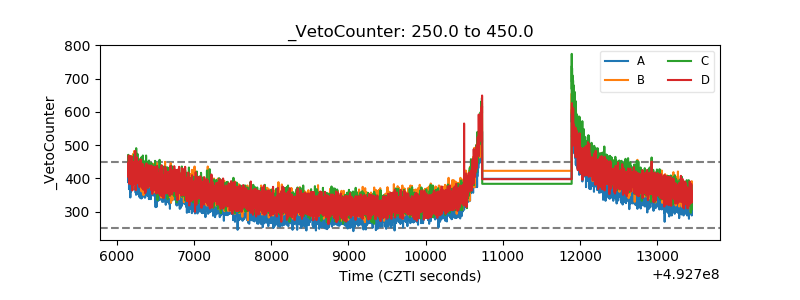 |