| Param | Original file | Final file |
|---|---|---|
| Filename | modeM0/AS1C09_011T09_9000006494_53413cztM0_level2.fits | modeM0/AS1C09_011T09_9000006494_53413cztM0_level2_quad_clean.evt |
| Size (bytes) | 704,433,600 | 76,498,560 |
| Size | 671.8 MB | 73.0 MB |
| Events in quadrant A | 3,755,639 | 578,042 |
| Events in quadrant B | 5,611,465 | 550,760 |
| Events in quadrant C | 11,224,734 | 274,413 |
| Events in quadrant D | 5,022,765 | 496,922 |
| Mode SS | |||
|---|---|---|---|
| Quadrant | BADHDUFLAG | Total packets | Discarded packets |
| A | 0 | 122 | 0 |
| B | 0 | 122 | 0 |
| C | 0 | 122 | 0 |
| D | 0 | 122 | 0 |
| Mode M0 | |||
|---|---|---|---|
| Quadrant | BADHDUFLAG | Total packets | Discarded packets |
| A | 0 | 15447 | 2 |
| B | 0 | 20790 | 1 |
| C | 0 | 37318 | 1 |
| D | 0 | 19086 | 1 |
| Mode M9 | |||
|---|---|---|---|
| Quadrant | BADHDUFLAG | Total packets | Discarded packets |
| A | 0 | 11 | 0 |
| B | 0 | 11 | 0 |
| C | 0 | 11 | 0 |
| D | 0 | 11 | 0 |
| Quadrant | Total seconds | Saturated seconds | Saturation percentage |
|---|---|---|---|
| A | 5950 | 224 | 3.764706% |
| B | 5950 | 990 | 16.638655% |
| C | 5950 | 3309 | 55.613445% |
| D | 5951 | 542 | 9.107713% |
Noise dominated data is calculated using 1-second bins in cleaned event files. If a bin has >2000 counts, and if more than 50% of those come from <1% of pixels, then it is considered to be noise-dominated and hence unusable.
| Quadrant | # 1 sec bins | Bins with >0 counts | Bins with >2000 counts | High rate bins dominated by noise | Noise dominated (total time) | Noise dominated (detector-on time) | Marked lightcurve |
|---|---|---|---|---|---|---|---|
| A | 7065 | 5950 | 146 | 146 | 2.07% | 2.45% | 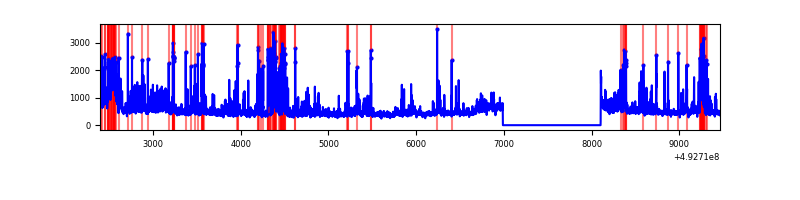 |
| B | 7065 | 5950 | 659 | 659 | 9.33% | 11.08% | 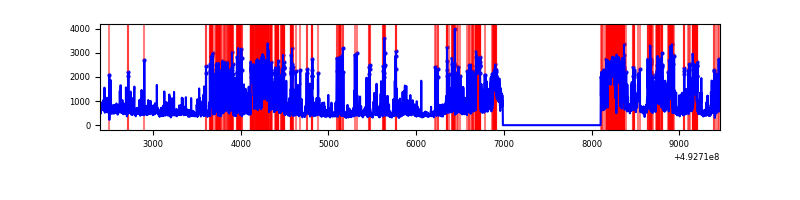 |
| C | 7065 | 5950 | 3132 | 3132 | 44.33% | 52.64% | 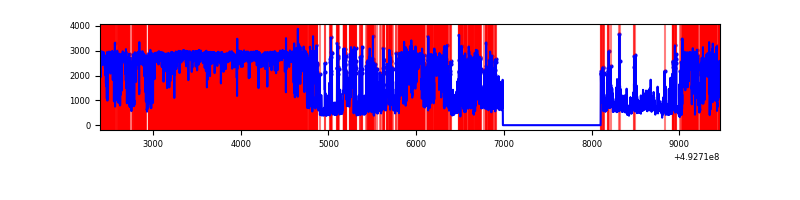 |
| D | 7066 | 5951 | 487 | 487 | 6.89% | 8.18% | 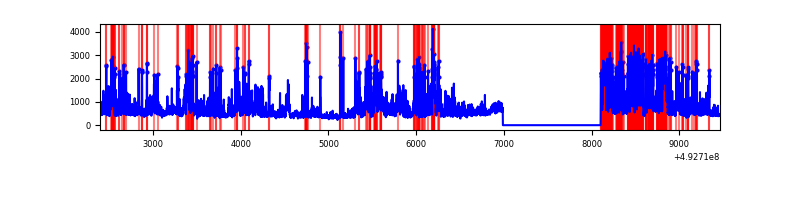 |
Top three noisy pixels from each quadrant. If the there are fewer than three noisy pixels in the level2.evt file, extra rows are filled as -1
| Pixel properties | Quadrant properties | ||||||
|---|---|---|---|---|---|---|---|
| Quadrant | DetID | PixID | Counts | Sigma | Mean | Median | Sigma |
| A | 3 | 63 | 655946 | 4226.64 | 625 | 610 | 155.0 |
| A | 8 | 231 | 334842 | 2155.66 | 625 | 610 | 155.0 |
| A | 0 | 8 | 47925 | 305.16 | 625 | 610 | 155.0 |
| B | 4 | 206 | 1990727 | 16226.17 | 582 | 561 | 122.7 |
| B | 1 | 223 | 232543 | 1891.39 | 582 | 561 | 122.7 |
| B | 4 | 171 | 184878 | 1502.77 | 582 | 561 | 122.7 |
| C | 1 | 241 | 5890784 | 52706.29 | 403 | 397 | 111.8 |
| C | 15 | 224 | 2477683 | 22166.38 | 403 | 397 | 111.8 |
| C | 9 | 38 | 544042 | 4864.45 | 403 | 397 | 111.8 |
| D | 11 | 245 | 1312681 | 7780.91 | 597 | 571 | 168.6 |
| D | 13 | 46 | 455325 | 2696.72 | 597 | 571 | 168.6 |
| D | 3 | 12 | 233278 | 1379.97 | 597 | 571 | 168.6 |
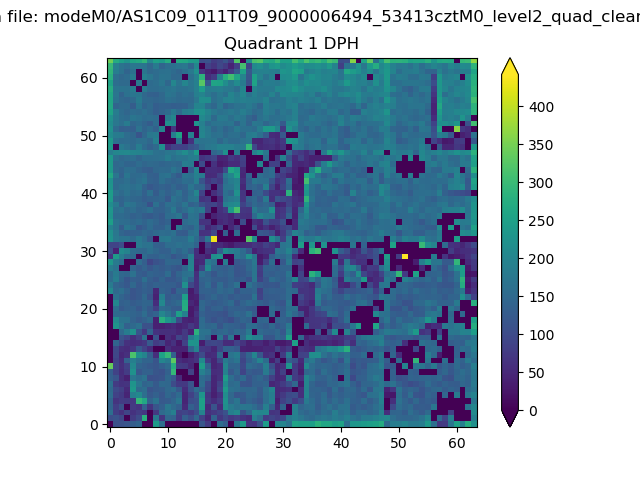
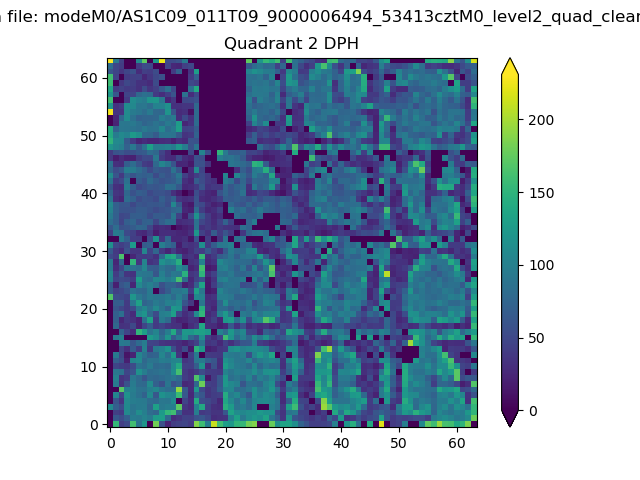
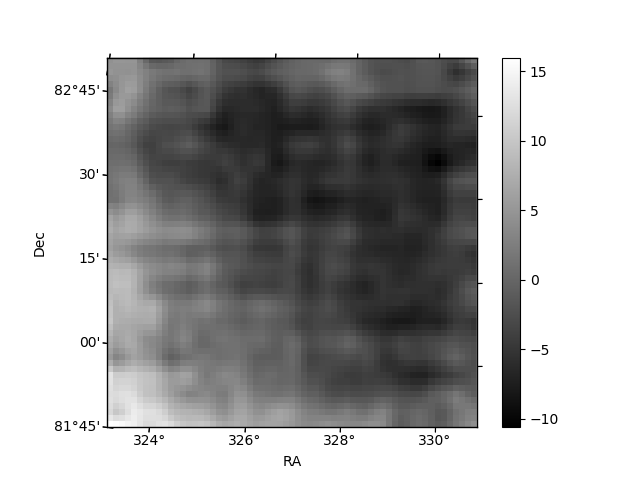
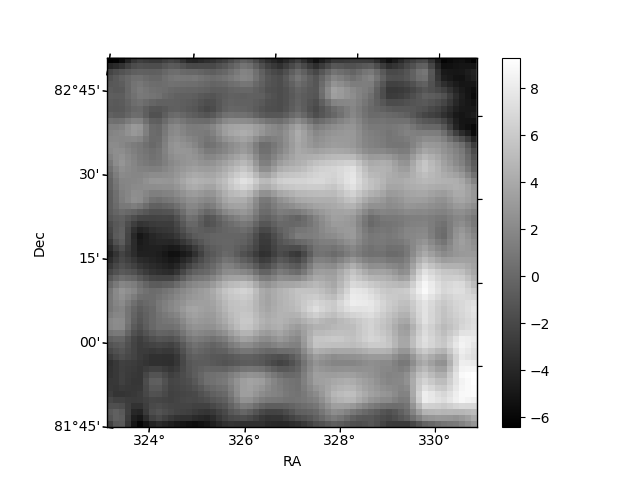
Histogram calculated using DETX and DETY for each event in the final _common_clean file
| Quadrant A |  |
 |
Quadrant B |
|---|---|---|---|
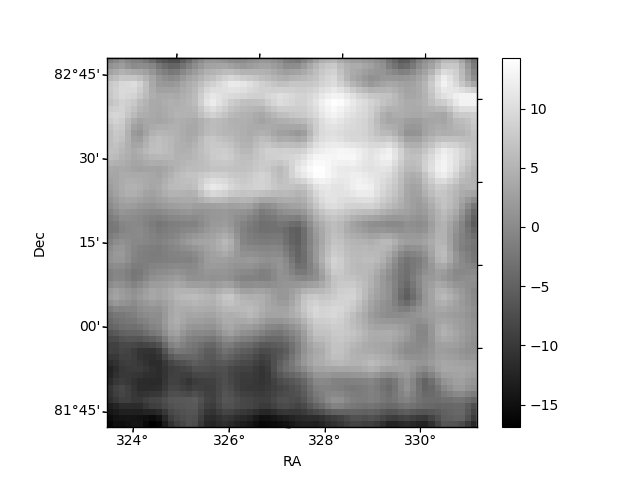
| Quadrant D |  |
 |
Quadrant C |
| Plot type | Count rate plots | Images |
|---|---|---|
| Comparison with Poisson distribution Blue bars denote a histogram of data divided into 1 sec bins. Red curve is a Poisson curve with rate = median count rate of data. |
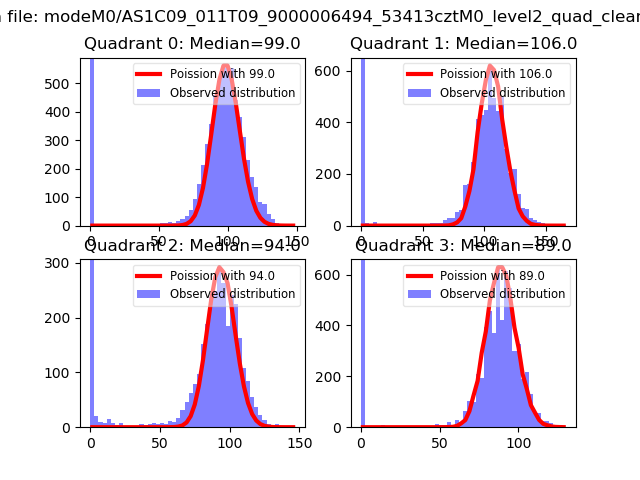 |
 |
| Quadrant-wise count rates Data is divided into 100 sec bins |
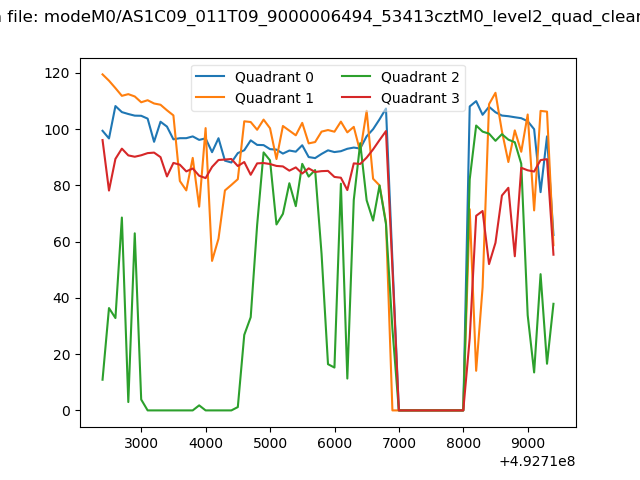 |
|
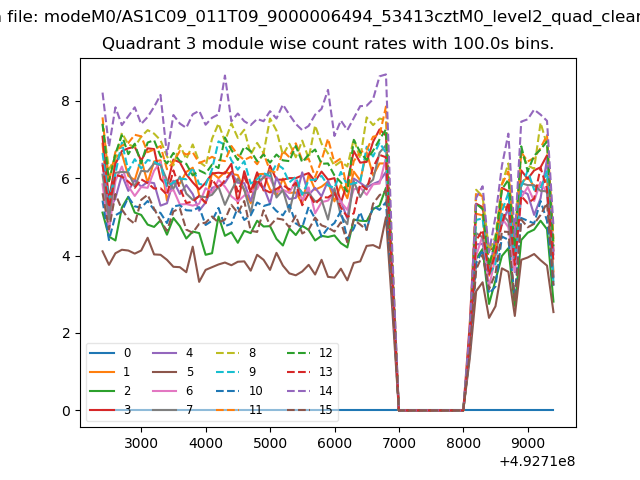
| Module-wise count rates for Quadrant A Data is divided into 100 sec bins |
 |
 |
| Module-wise count rates for Quadrant B Data is divided into 100 sec bins |
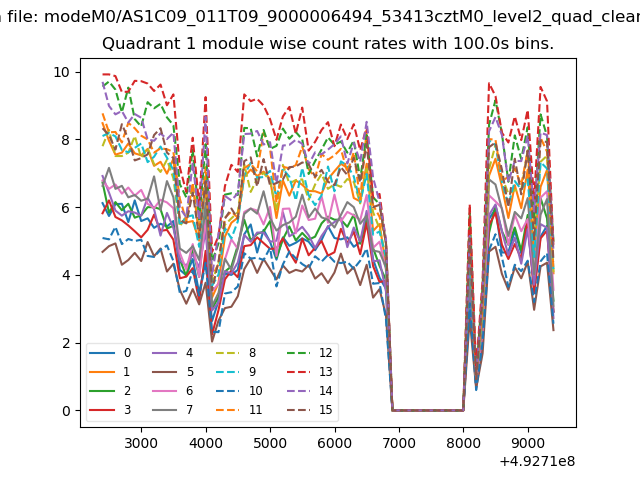 |
 |
| Module-wise count rates for Quadrant C Data is divided into 100 sec bins |
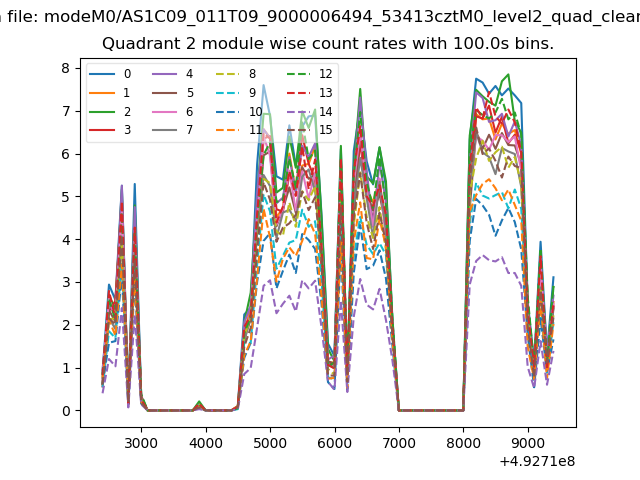 |
 |
| Module-wise count rates for Quadrant D Data is divided into 100 sec bins |
 |
 |
| Parameter | Plot |
|---|---|
| CZT HV Monitor | 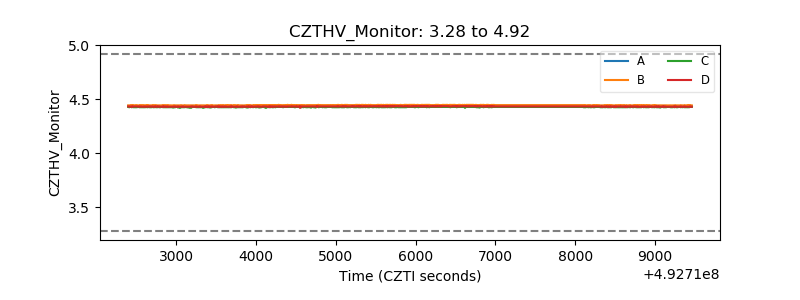 |
| D_VDD | 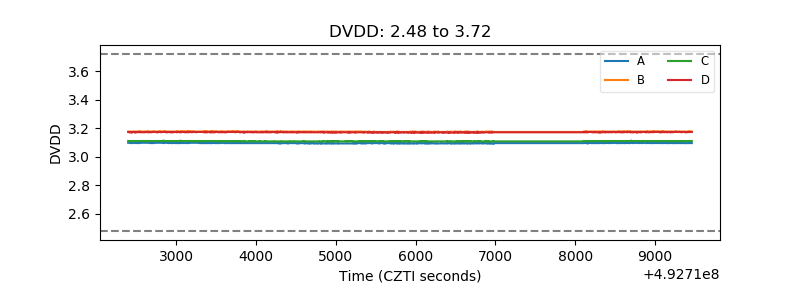 |
| Temperature 1 | 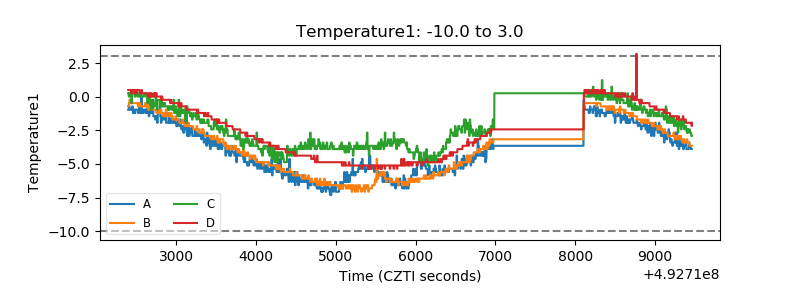 |
| Veto HV Monitor |  |
| Veto LLD | 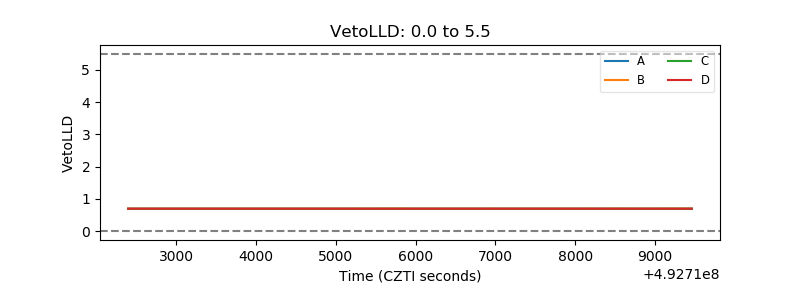 |
| Alpha Counter | 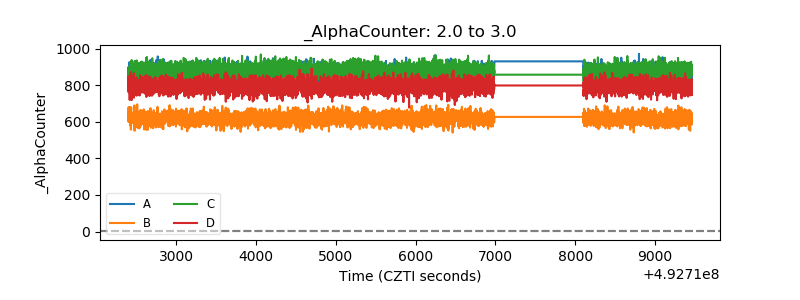 |
| _CPM_Rate | 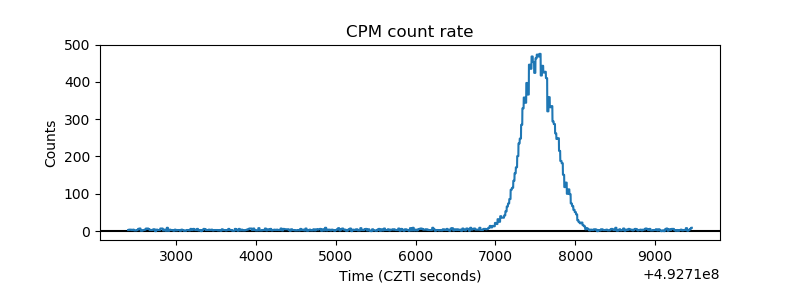 |
| CZT Counter | 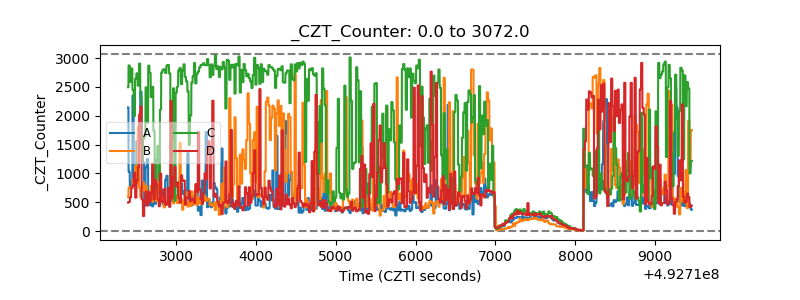 |
| +2.5 Volts monitor | 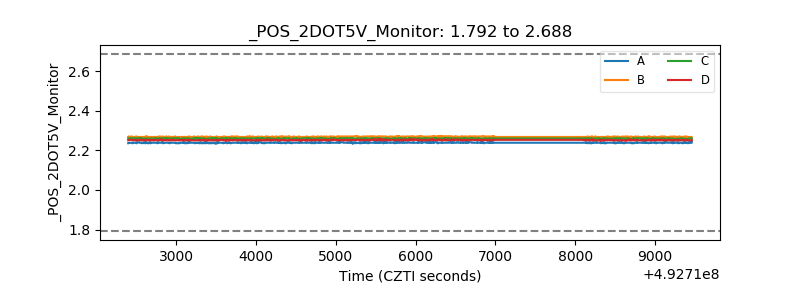 |
| +5 Volts monitor | 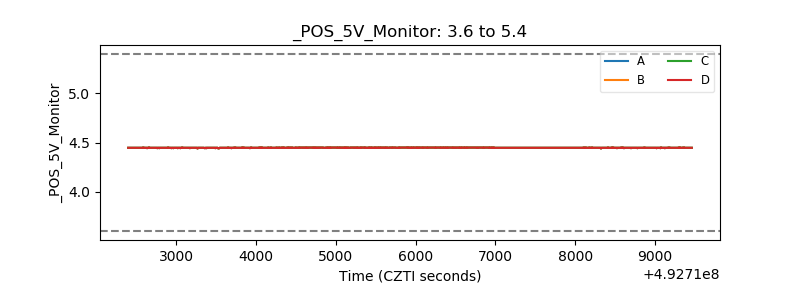 |
| _ROLL_ROT | 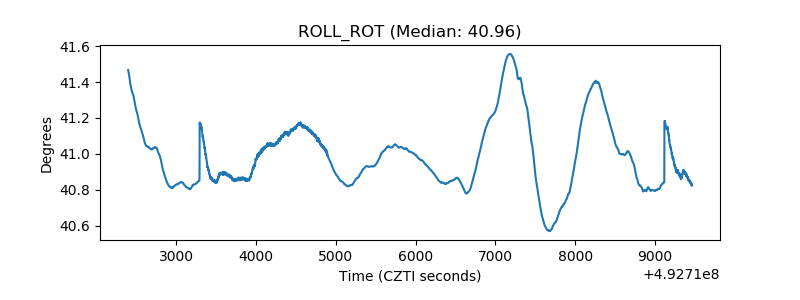 |
| _Roll_DEC | 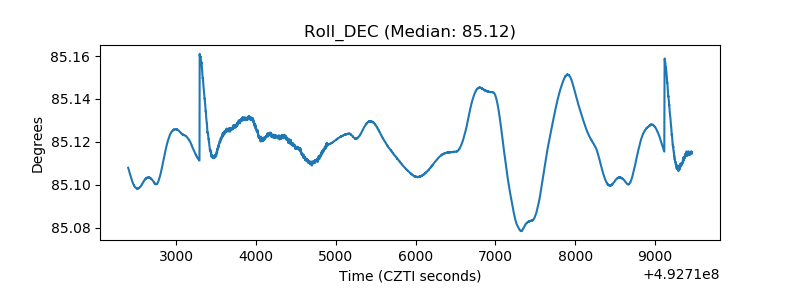 |
| _Roll_RA | 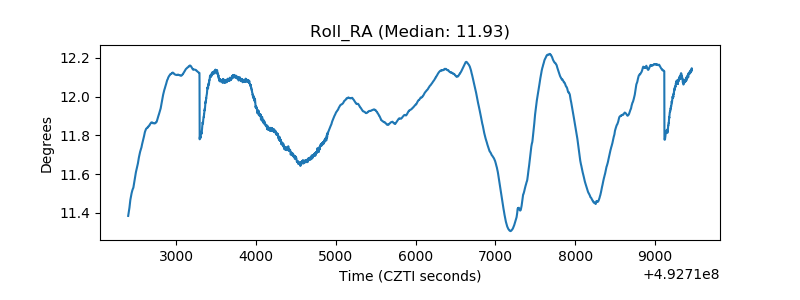 |
| Veto Counter | 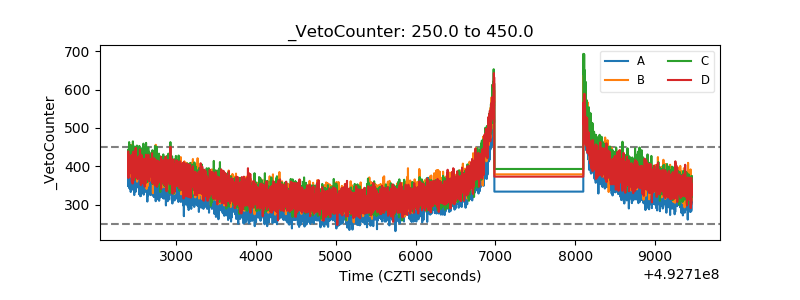 |