| Param | Original file | Final file |
|---|---|---|
| Filename | modeM0/AS1C09_011T09_9000006494_53414cztM0_level2.fits | modeM0/AS1C09_011T09_9000006494_53414cztM0_level2_quad_clean.evt |
| Size (bytes) | 805,066,560 | 83,508,480 |
| Size | 767.8 MB | 79.6 MB |
| Events in quadrant A | 4,100,537 | 636,693 |
| Events in quadrant B | 6,579,669 | 606,649 |
| Events in quadrant C | 13,131,877 | 276,304 |
| Events in quadrant D | 5,470,532 | 542,123 |
| Mode SS | |||
|---|---|---|---|
| Quadrant | BADHDUFLAG | Total packets | Discarded packets |
| A | 0 | 136 | 0 |
| B | 0 | 136 | 0 |
| C | 0 | 136 | 0 |
| D | 0 | 136 | 0 |
| Mode M0 | |||
|---|---|---|---|
| Quadrant | BADHDUFLAG | Total packets | Discarded packets |
| A | 0 | 16930 | 2 |
| B | 0 | 24211 | 5 |
| C | 0 | 43602 | 4 |
| D | 0 | 21081 | 2 |
| Mode M9 | |||
|---|---|---|---|
| Quadrant | BADHDUFLAG | Total packets | Discarded packets |
| A | 0 | 11 | 0 |
| B | 0 | 12 | 0 |
| C | 0 | 12 | 0 |
| D | 0 | 12 | 0 |
| Quadrant | Total seconds | Saturated seconds | Saturation percentage |
|---|---|---|---|
| A | 6691 | 235 | 3.512181% |
| B | 6689 | 1107 | 16.549559% |
| C | 6690 | 3995 | 59.715994% |
| D | 6691 | 705 | 10.536542% |
Noise dominated data is calculated using 1-second bins in cleaned event files. If a bin has >2000 counts, and if more than 50% of those come from <1% of pixels, then it is considered to be noise-dominated and hence unusable.
| Quadrant | # 1 sec bins | Bins with >0 counts | Bins with >2000 counts | High rate bins dominated by noise | Noise dominated (total time) | Noise dominated (detector-on time) | Marked lightcurve |
|---|---|---|---|---|---|---|---|
| A | 7716 | 6692 | 190 | 190 | 2.46% | 2.84% | 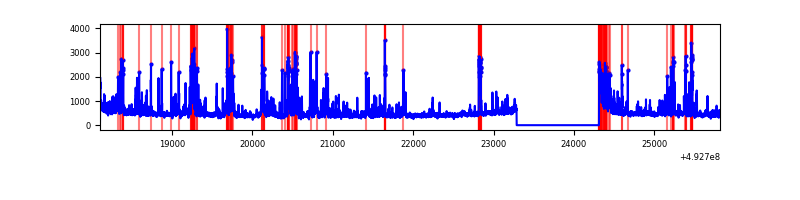 |
| B | 7716 | 6692 | 724 | 724 | 9.38% | 10.82% | 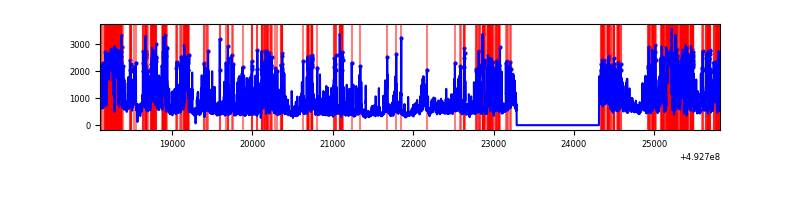 |
| C | 7716 | 6691 | 3831 | 3831 | 49.65% | 57.26% | 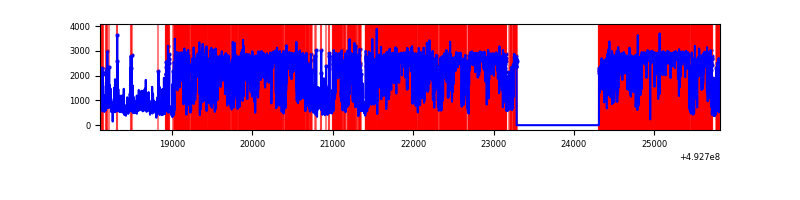 |
| D | 7716 | 6692 | 679 | 679 | 8.80% | 10.15% | 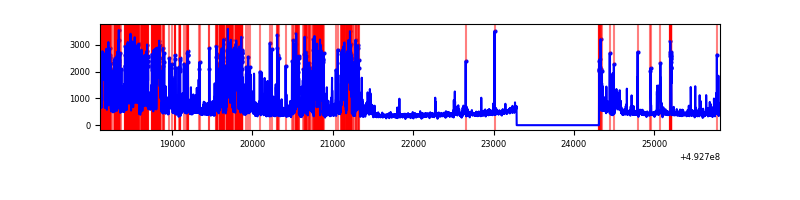 |
Top three noisy pixels from each quadrant. If the there are fewer than three noisy pixels in the level2.evt file, extra rows are filled as -1
| Pixel properties | Quadrant properties | ||||||
|---|---|---|---|---|---|---|---|
| Quadrant | DetID | PixID | Counts | Sigma | Mean | Median | Sigma |
| A | 3 | 63 | 889108 | 5174.59 | 691 | 672 | 171.7 |
| A | 15 | 174 | 122527 | 709.73 | 691 | 672 | 171.7 |
| A | 0 | 8 | 66547 | 383.68 | 691 | 672 | 171.7 |
| B | 4 | 206 | 2386626 | 17318.82 | 652 | 629 | 137.8 |
| B | 4 | 171 | 897963 | 6513.32 | 652 | 629 | 137.8 |
| B | 14 | 167 | 113277 | 817.66 | 652 | 629 | 137.8 |
| C | 1 | 241 | 5532103 | 44961.22 | 448 | 444 | 123.0 |
| C | 15 | 224 | 3983879 | 32377.28 | 448 | 444 | 123.0 |
| C | 9 | 38 | 872990 | 7092.04 | 448 | 444 | 123.0 |
| D | 11 | 245 | 1980614 | 10679.14 | 656 | 625 | 185.4 |
| D | 3 | 12 | 216909 | 1166.54 | 656 | 625 | 185.4 |
| D | 2 | 153 | 176184 | 946.88 | 656 | 625 | 185.4 |
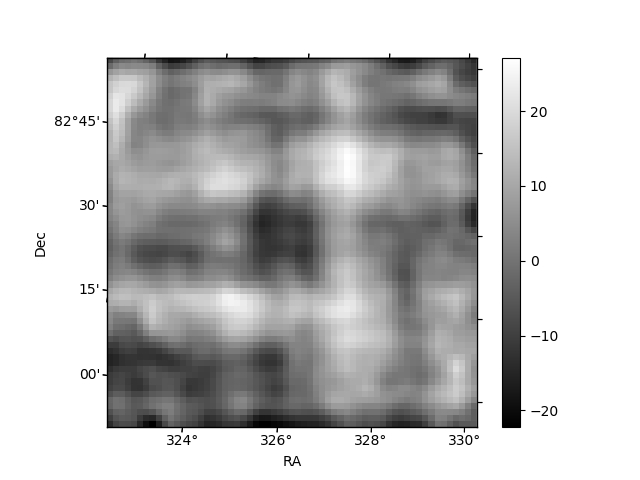
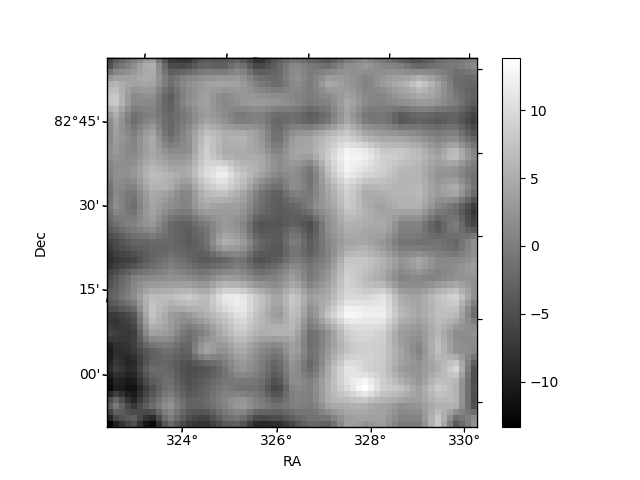
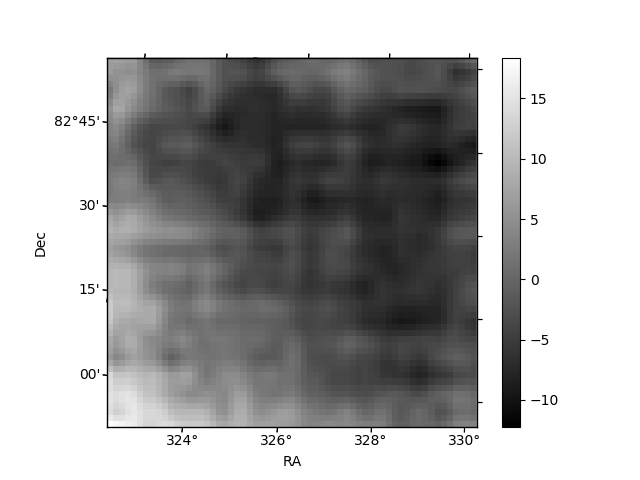
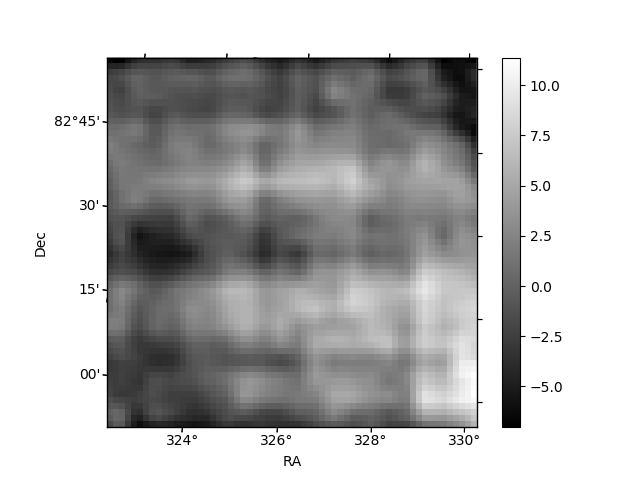
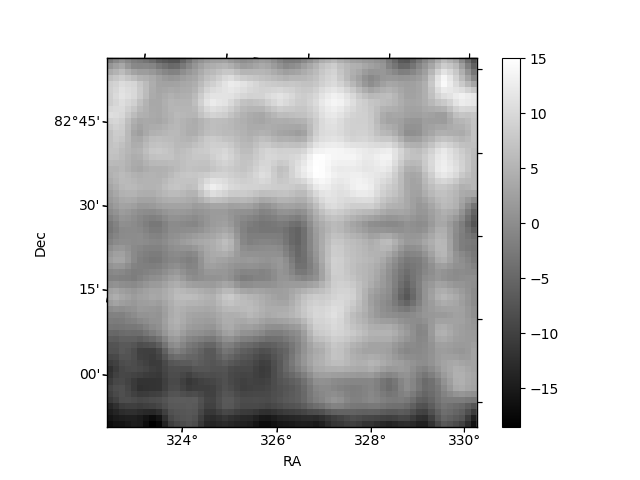
Histogram calculated using DETX and DETY for each event in the final _common_clean file
| Quadrant A | 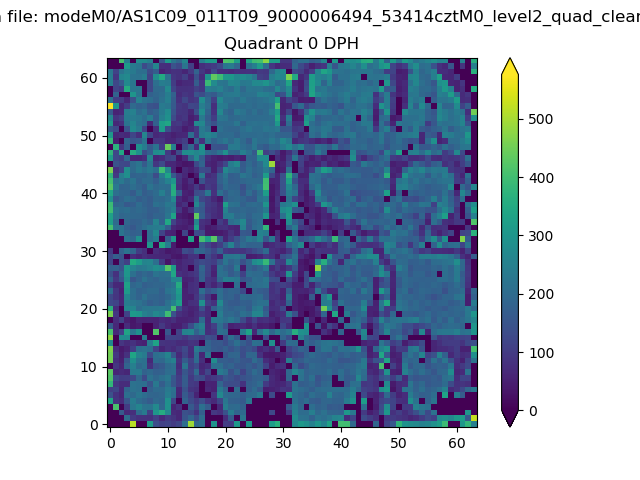 |
 |
Quadrant B |
|---|---|---|---|
| Quadrant D | 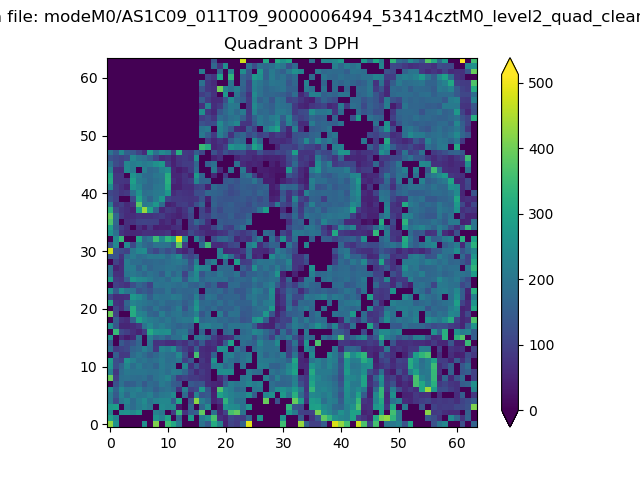 |
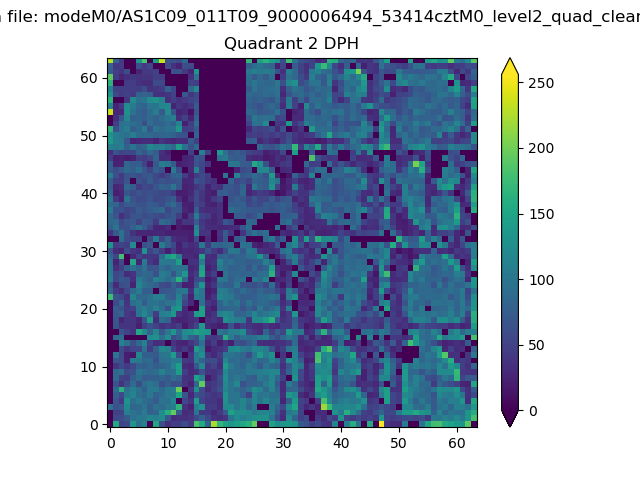 |
Quadrant C |
| Plot type | Count rate plots | Images |
|---|---|---|
| Comparison with Poisson distribution Blue bars denote a histogram of data divided into 1 sec bins. Red curve is a Poisson curve with rate = median count rate of data. |
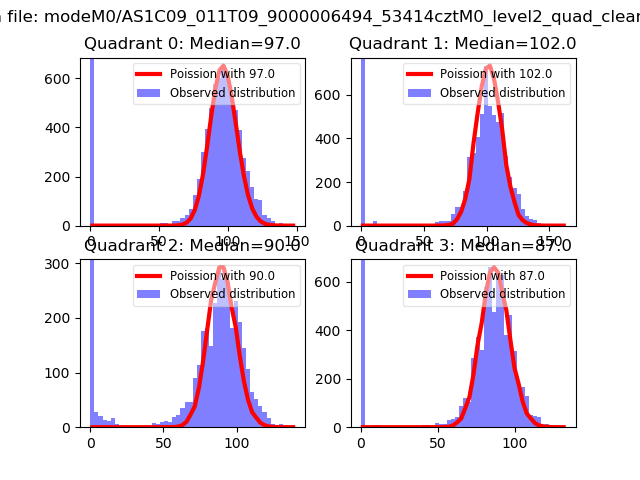 |
 |
| Quadrant-wise count rates Data is divided into 100 sec bins |
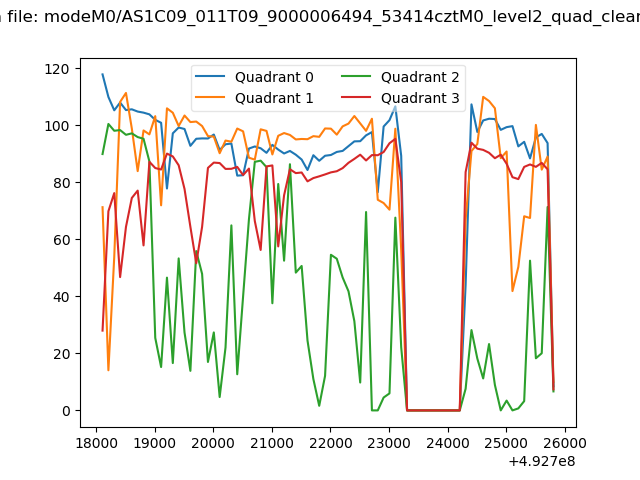 |
|
| Module-wise count rates for Quadrant A Data is divided into 100 sec bins |
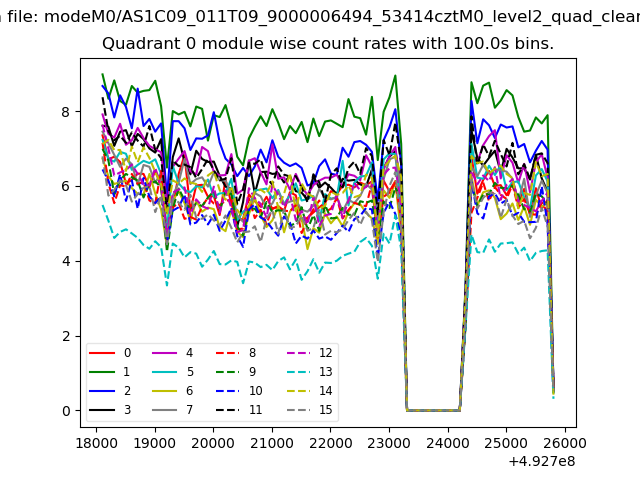 |
 |
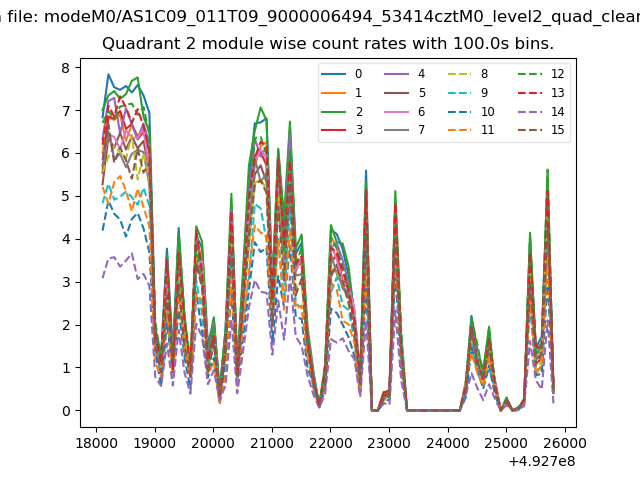
| Module-wise count rates for Quadrant B Data is divided into 100 sec bins |
 |
 |
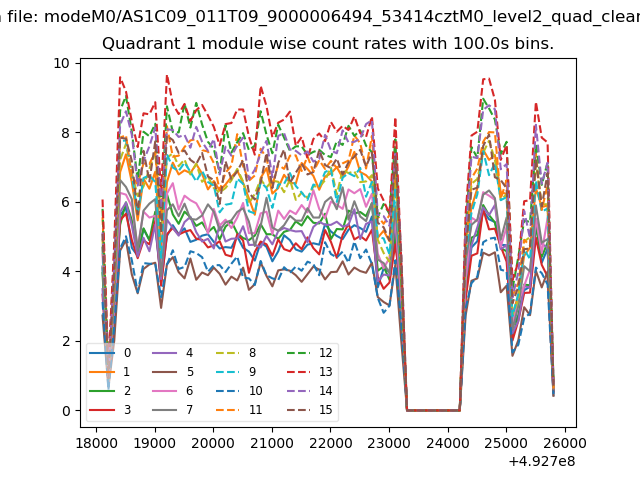
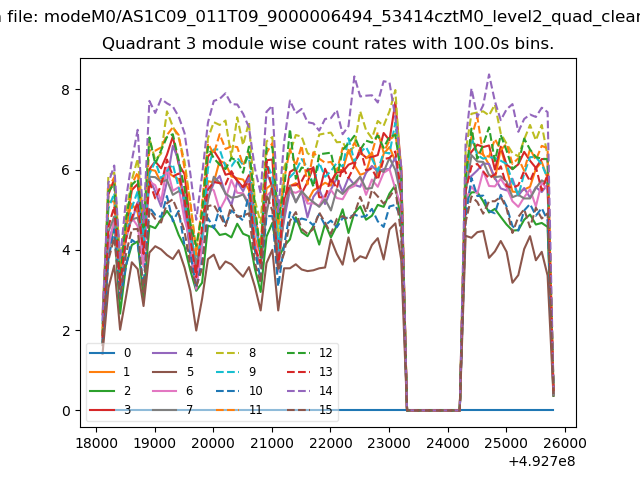
| Module-wise count rates for Quadrant C Data is divided into 100 sec bins |
 |
 |
| Module-wise count rates for Quadrant D Data is divided into 100 sec bins |
 |
 |
| Parameter | Plot |
|---|---|
| CZT HV Monitor | 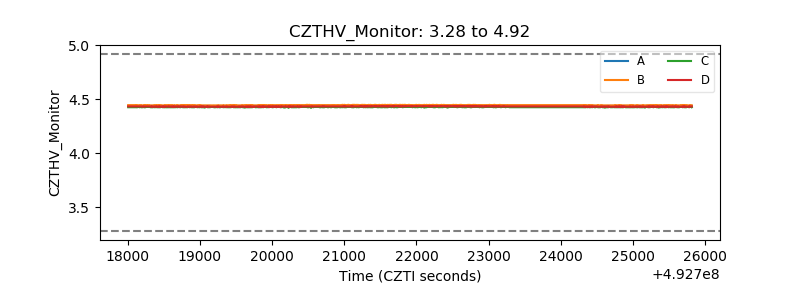 |
| D_VDD | 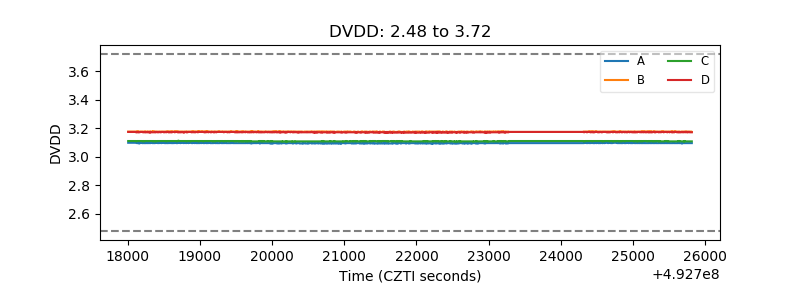 |
| Temperature 1 | 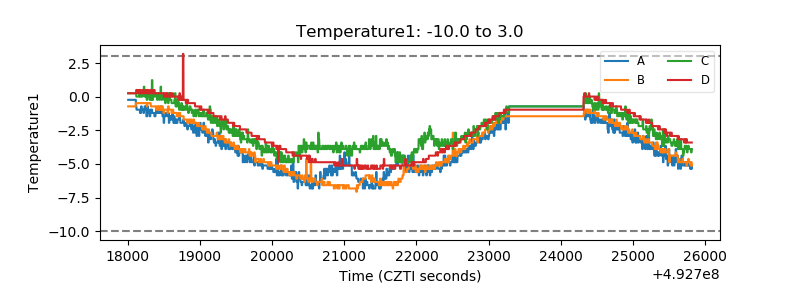 |
| Veto HV Monitor | 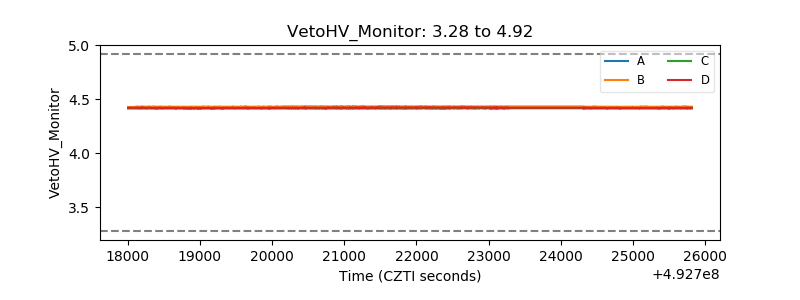 |
| Veto LLD | 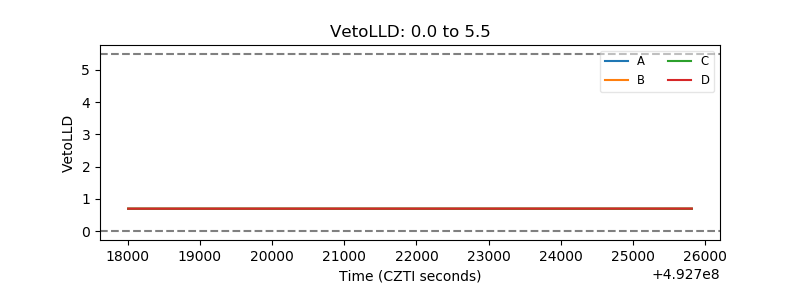 |
| Alpha Counter | 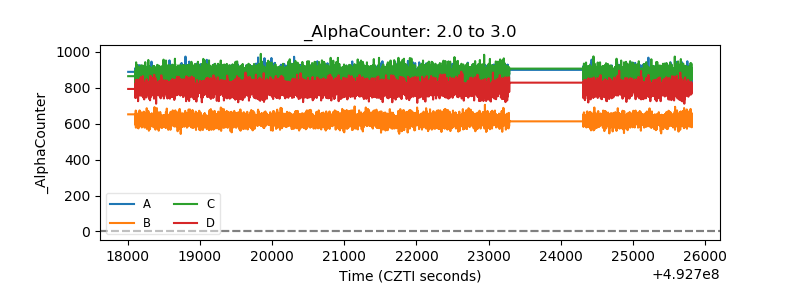 |
| _CPM_Rate | 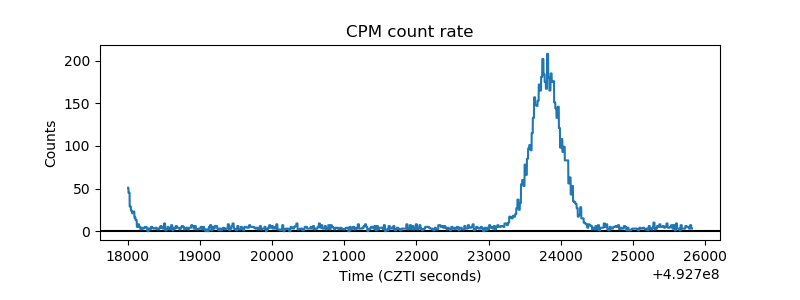 |
| CZT Counter | 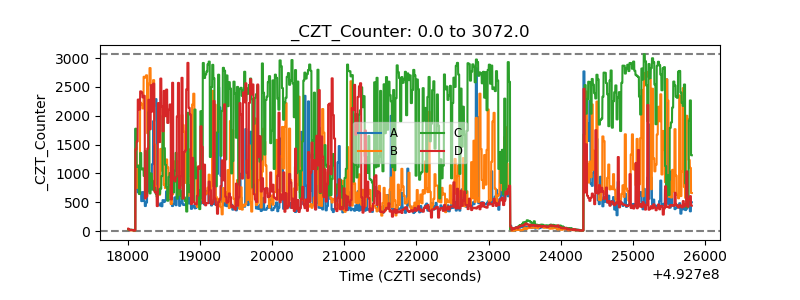 |
| +2.5 Volts monitor |  |
| +5 Volts monitor | 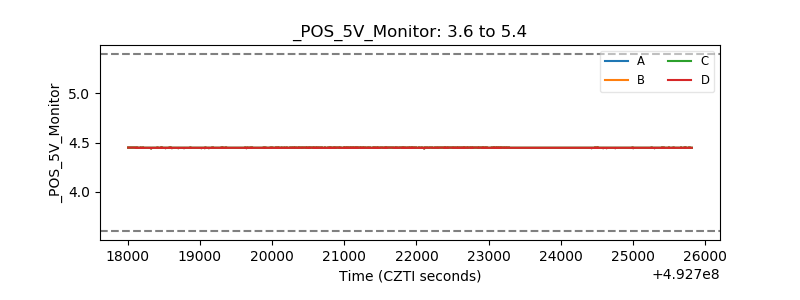 |
| _ROLL_ROT | 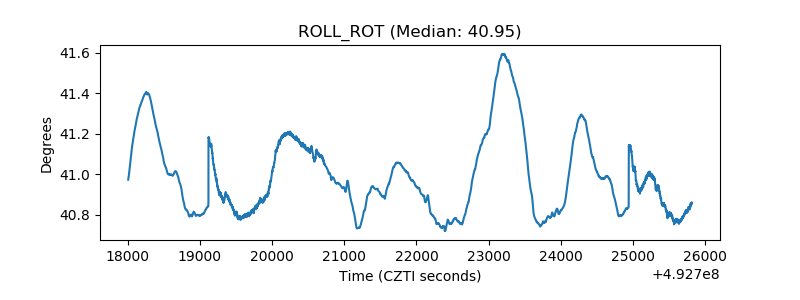 |
| _Roll_DEC |  |
| _Roll_RA | 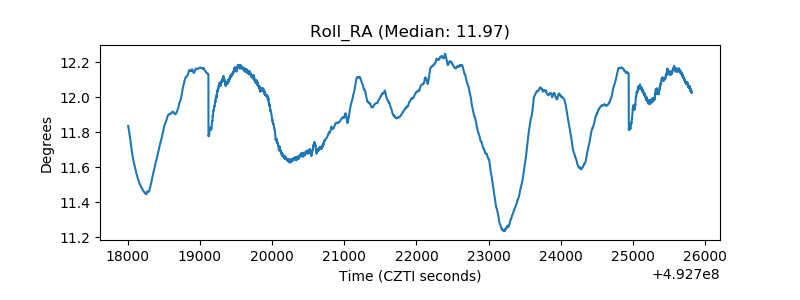 |
| Veto Counter | 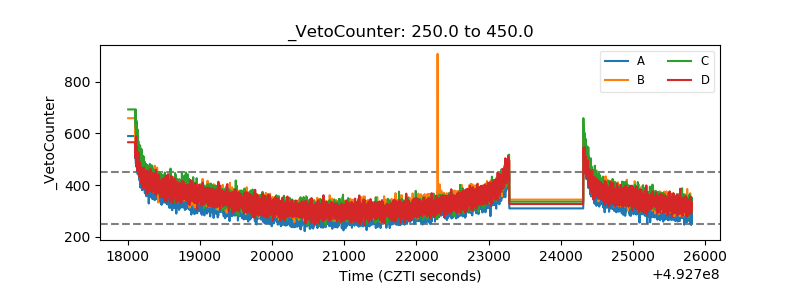 |