| Param | Original file | Final file |
|---|---|---|
| Filename | modeM0/AS1C09_011T09_9000006494_53415cztM0_level2.fits | modeM0/AS1C09_011T09_9000006494_53415cztM0_level2_quad_clean.evt |
| Size (bytes) | 904,884,480 | 82,653,120 |
| Size | 863.0 MB | 78.8 MB |
| Events in quadrant A | 4,772,480 | 650,258 |
| Events in quadrant B | 7,250,258 | 632,830 |
| Events in quadrant C | 16,988,495 | 120,611 |
| Events in quadrant D | 3,942,571 | 610,555 |
| Mode SS | |||
|---|---|---|---|
| Quadrant | BADHDUFLAG | Total packets | Discarded packets |
| A | 0 | 144 | 0 |
| B | 0 | 144 | 0 |
| C | 0 | 144 | 0 |
| D | 0 | 144 | 0 |
| Mode M0 | |||
|---|---|---|---|
| Quadrant | BADHDUFLAG | Total packets | Discarded packets |
| A | 0 | 19114 | 2 |
| B | 0 | 26445 | 2 |
| C | 0 | 55006 | 2 |
| D | 0 | 16814 | 2 |
| Mode M9 | |||
|---|---|---|---|
| Quadrant | BADHDUFLAG | Total packets | Discarded packets |
| A | 0 | 6 | 0 |
| B | 0 | 6 | 0 |
| C | 0 | 6 | 0 |
| D | 0 | 6 | 0 |
| Quadrant | Total seconds | Saturated seconds | Saturation percentage |
|---|---|---|---|
| A | 7000 | 355 | 5.071429% |
| B | 6999 | 1189 | 16.988141% |
| C | 6999 | 5855 | 83.654808% |
| D | 7000 | 110 | 1.571429% |
Noise dominated data is calculated using 1-second bins in cleaned event files. If a bin has >2000 counts, and if more than 50% of those come from <1% of pixels, then it is considered to be noise-dominated and hence unusable.
| Quadrant | # 1 sec bins | Bins with >0 counts | Bins with >2000 counts | High rate bins dominated by noise | Noise dominated (total time) | Noise dominated (detector-on time) | Marked lightcurve |
|---|---|---|---|---|---|---|---|
| A | 7655 | 7000 | 299 | 299 | 3.91% | 4.27% | 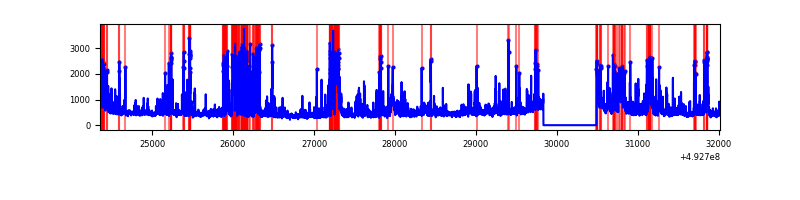 |
| B | 7654 | 6999 | 849 | 849 | 11.09% | 12.13% | 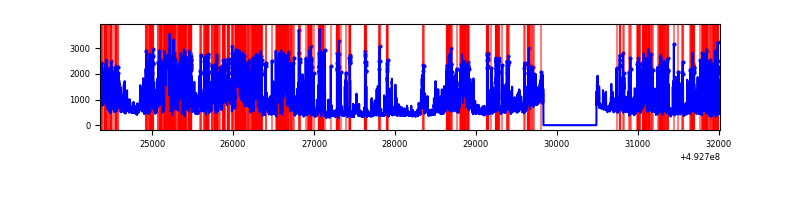 |
| C | 7654 | 6999 | 5715 | 5715 | 74.67% | 81.65% | 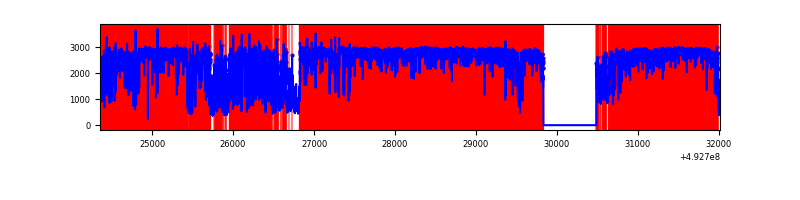 |
| D | 7655 | 7001 | 84 | 84 | 1.10% | 1.20% | 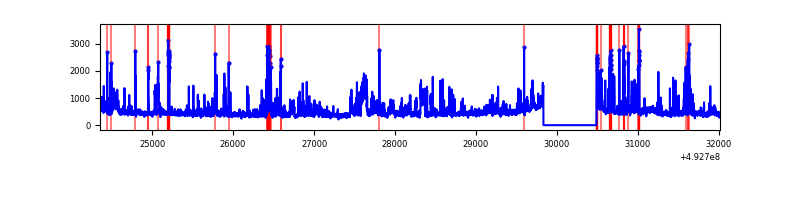 |
Top three noisy pixels from each quadrant. If the there are fewer than three noisy pixels in the level2.evt file, extra rows are filled as -1
| Pixel properties | Quadrant properties | ||||||
|---|---|---|---|---|---|---|---|
| Quadrant | DetID | PixID | Counts | Sigma | Mean | Median | Sigma |
| A | 3 | 63 | 1260561 | 7015.99 | 718 | 700 | 179.6 |
| A | 7 | 206 | 190868 | 1059.02 | 718 | 700 | 179.6 |
| A | 15 | 174 | 145015 | 803.67 | 718 | 700 | 179.6 |
| B | 4 | 206 | 1540969 | 10625.12 | 684 | 660 | 145.0 |
| B | 4 | 171 | 1102022 | 7597.24 | 684 | 660 | 145.0 |
| B | 15 | 20 | 630198 | 4342.58 | 684 | 660 | 145.0 |
| C | 1 | 241 | 11904206 | 135324.99 | 317 | 313 | 88.0 |
| C | 15 | 224 | 2214040 | 25165.93 | 317 | 313 | 88.0 |
| C | 9 | 38 | 542938 | 6168.63 | 317 | 313 | 88.0 |
| D | 0 | 18 | 327721 | 1622.97 | 710 | 678 | 201.5 |
| D | 2 | 153 | 301358 | 1492.14 | 710 | 678 | 201.5 |
| D | 8 | 176 | 102519 | 505.39 | 710 | 678 | 201.5 |
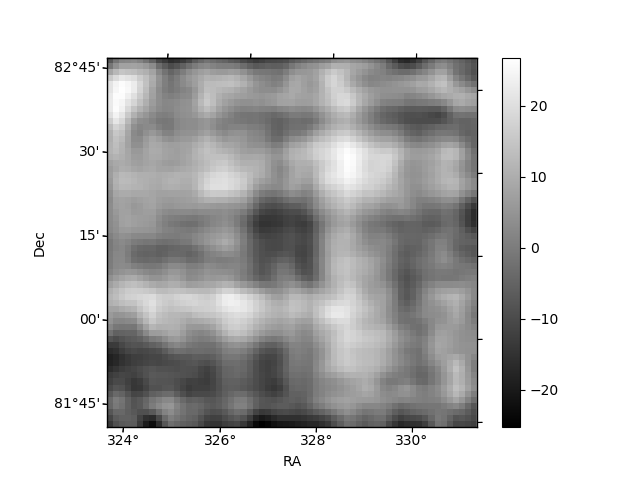
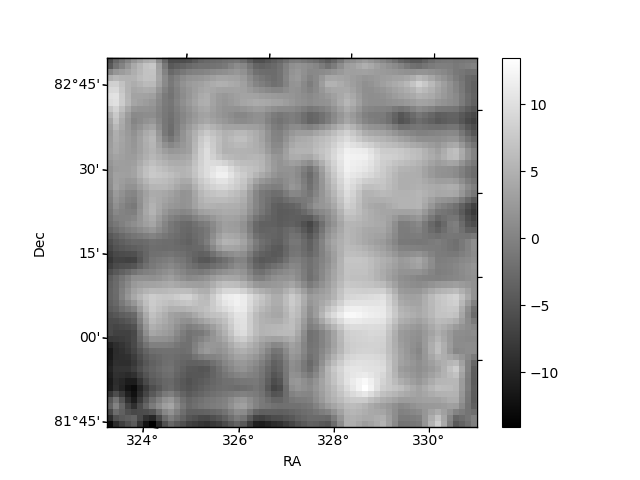
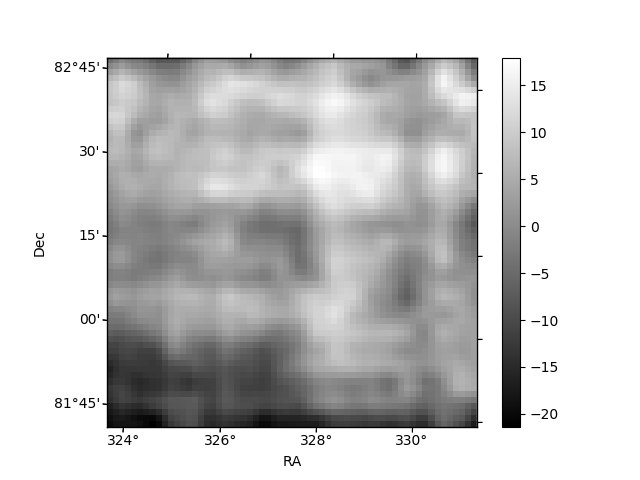
Histogram calculated using DETX and DETY for each event in the final _common_clean file
| Quadrant A | 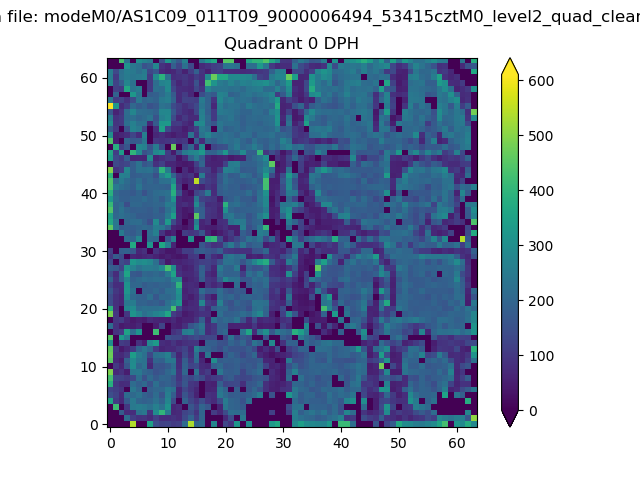 |
 |
Quadrant B |
|---|---|---|---|
| Quadrant D | 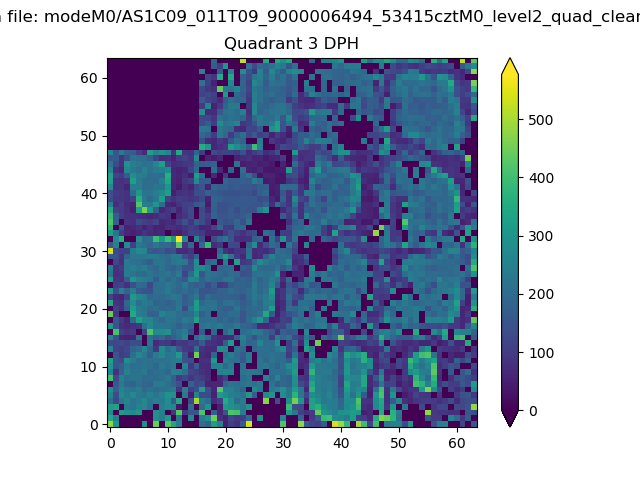 |
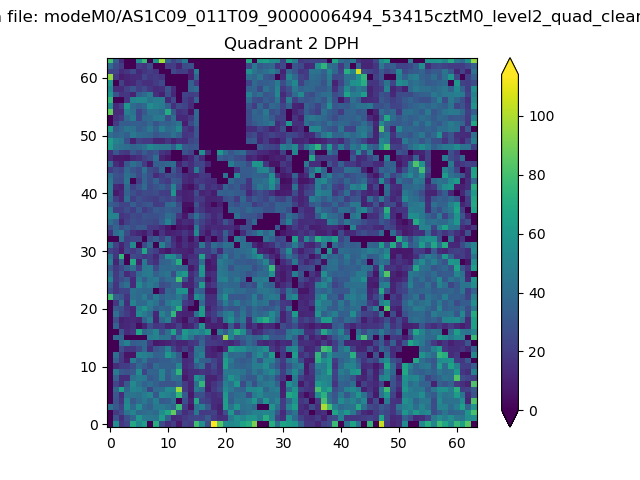 |
Quadrant C |
| Plot type | Count rate plots | Images |
|---|---|---|
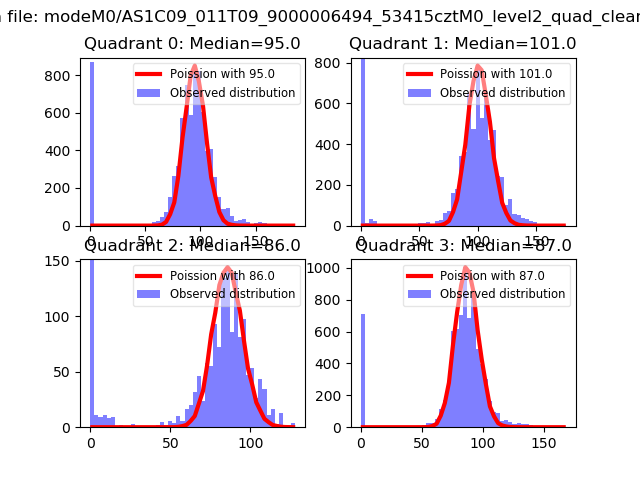
| Comparison with Poisson distribution Blue bars denote a histogram of data divided into 1 sec bins. Red curve is a Poisson curve with rate = median count rate of data. |
 |
 |
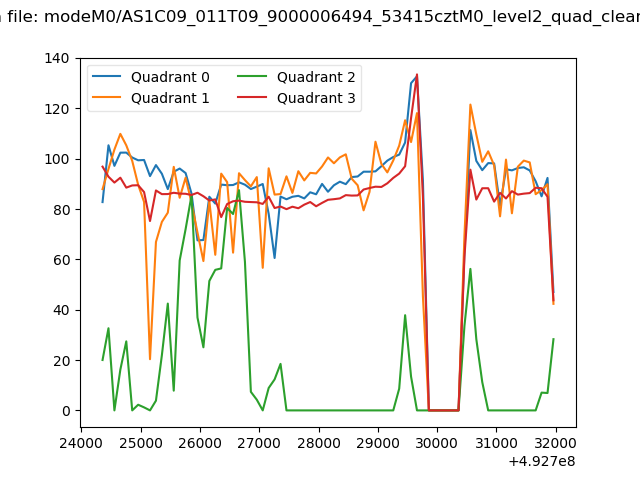
| Quadrant-wise count rates Data is divided into 100 sec bins |
 |
|
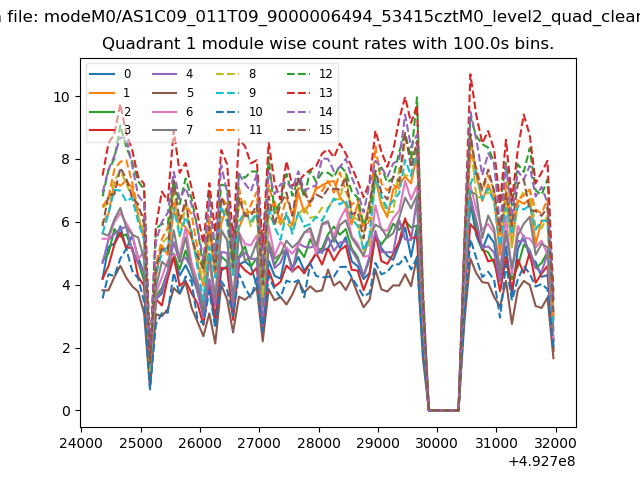
| Module-wise count rates for Quadrant A Data is divided into 100 sec bins |
 |
 |
| Module-wise count rates for Quadrant B Data is divided into 100 sec bins |
 |
 |
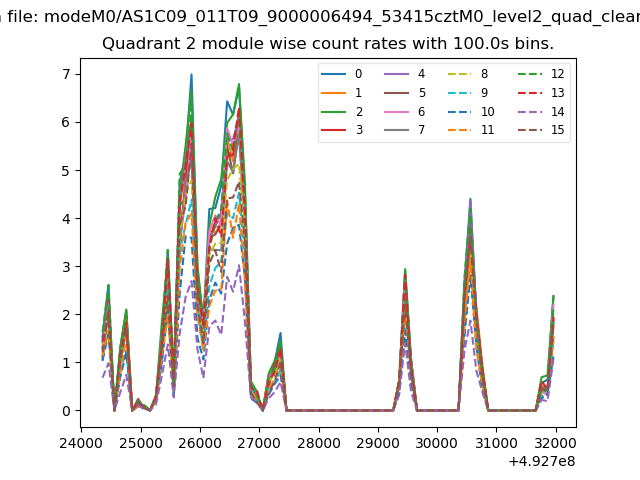
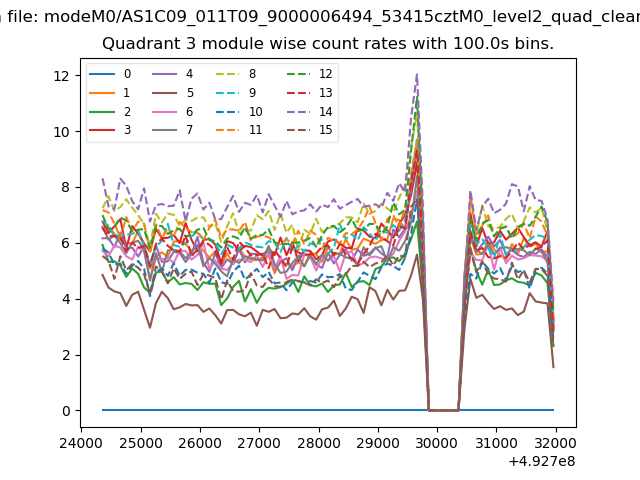
| Module-wise count rates for Quadrant C Data is divided into 100 sec bins |
 |
 |
| Module-wise count rates for Quadrant D Data is divided into 100 sec bins |
 |
 |
| Parameter | Plot |
|---|---|
| CZT HV Monitor | 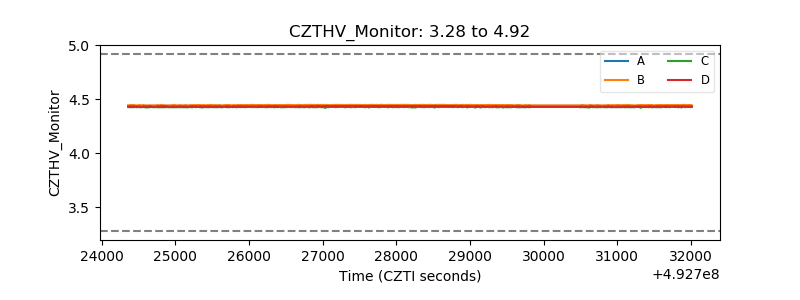 |
| D_VDD | 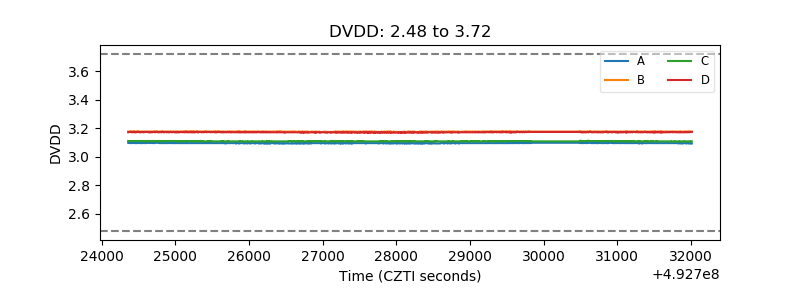 |
| Temperature 1 | 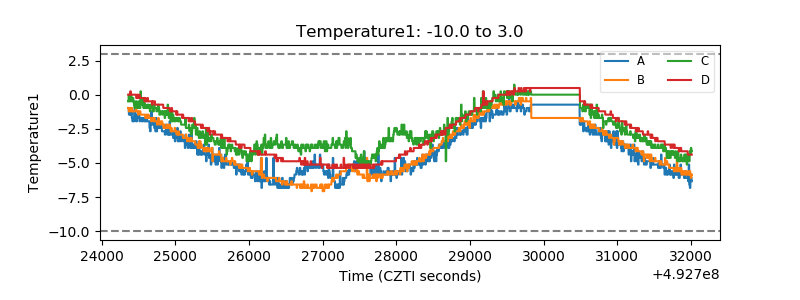 |
| Veto HV Monitor | 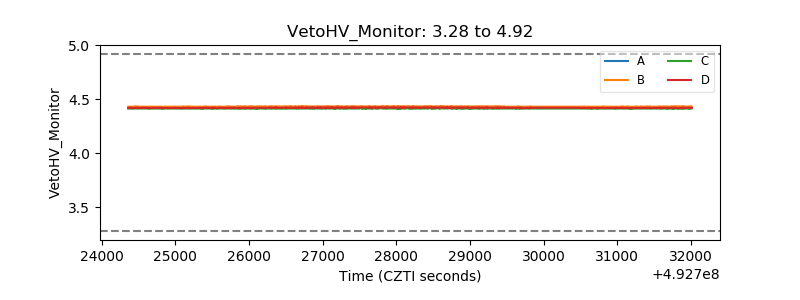 |
| Veto LLD | 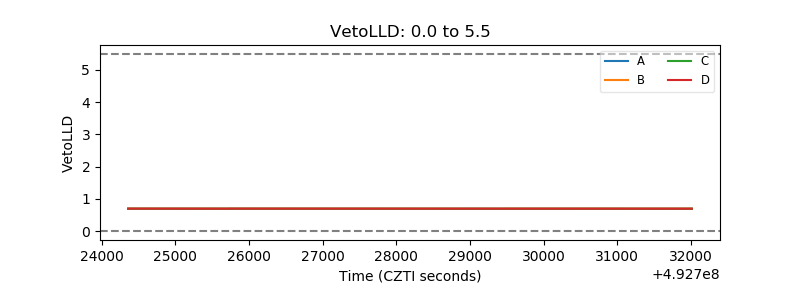 |
| Alpha Counter | 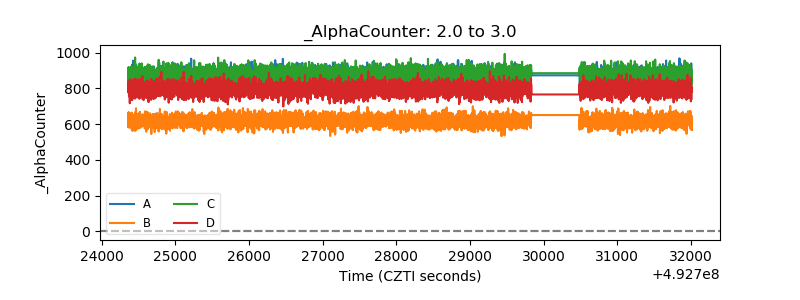 |
| _CPM_Rate | 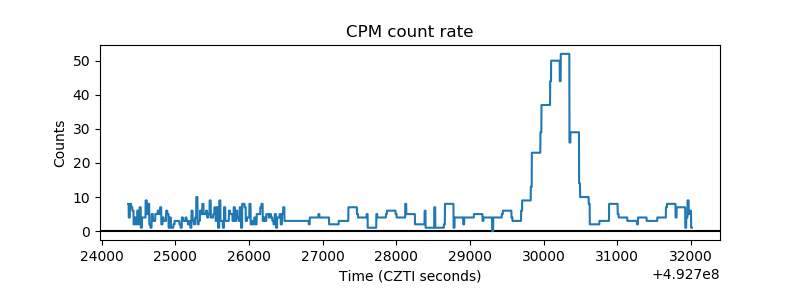 |
| CZT Counter | 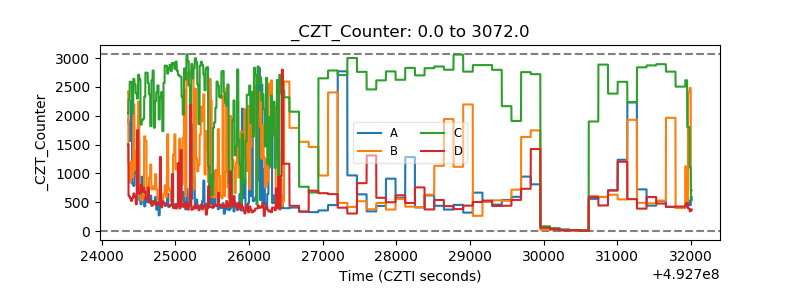 |
| +2.5 Volts monitor |  |
| +5 Volts monitor | 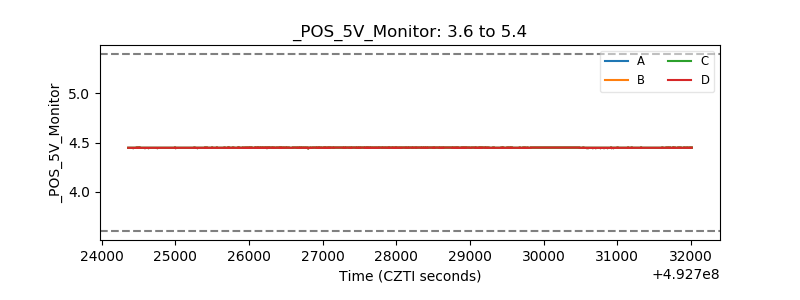 |
| _ROLL_ROT | 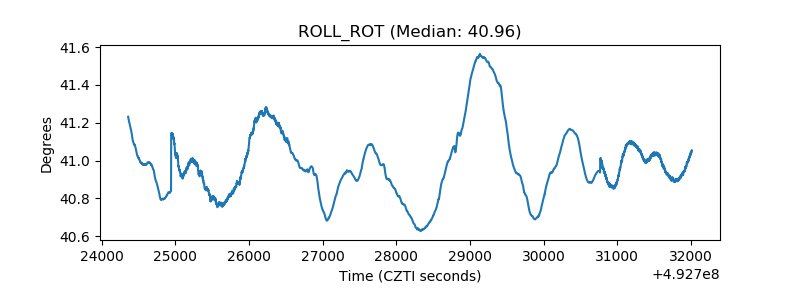 |
| _Roll_DEC | 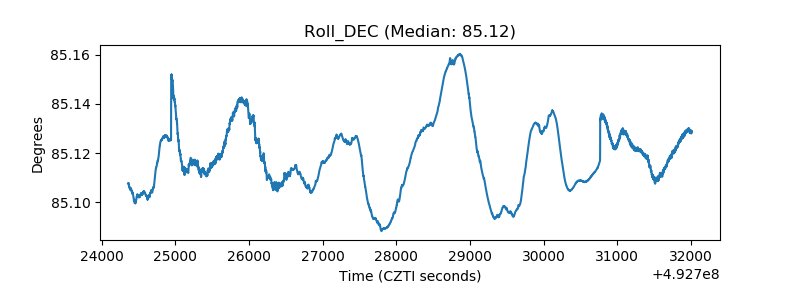 |
| _Roll_RA | 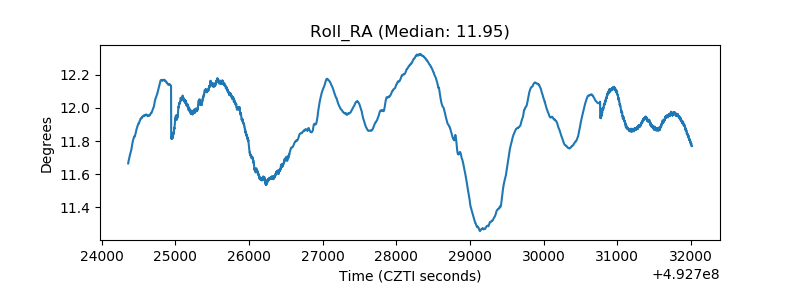 |
| Veto Counter | 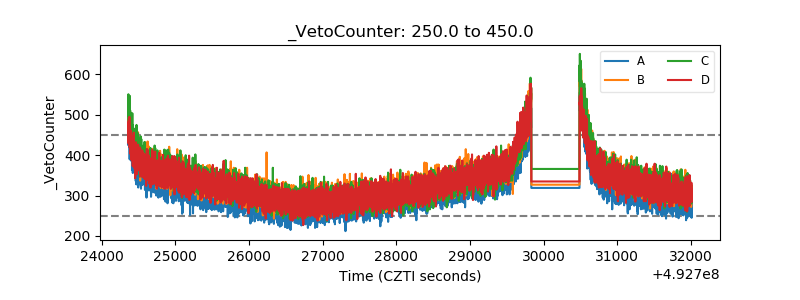 |