| Param | Original file | Final file |
|---|---|---|
| Filename | modeM0/AS1C09_011T09_9000006494_53416cztM0_level2.fits | modeM0/AS1C09_011T09_9000006494_53416cztM0_level2_quad_clean.evt |
| Size (bytes) | 884,554,560 | 101,718,720 |
| Size | 843.6 MB | 97.0 MB |
| Events in quadrant A | 5,995,068 | 717,573 |
| Events in quadrant B | 6,970,855 | 765,590 |
| Events in quadrant C | 14,498,852 | 374,089 |
| Events in quadrant D | 4,675,699 | 679,969 |
| Mode SS | |||
|---|---|---|---|
| Quadrant | BADHDUFLAG | Total packets | Discarded packets |
| A | 0 | 156 | 0 |
| B | 0 | 156 | 0 |
| C | 0 | 156 | 0 |
| D | 0 | 156 | 0 |
| Mode M0 | |||
|---|---|---|---|
| Quadrant | BADHDUFLAG | Total packets | Discarded packets |
| A | 0 | 23450 | 5 |
| B | 0 | 26194 | 5 |
| C | 0 | 48408 | 2 |
| D | 0 | 19594 | 2 |
| Mode M9 | |||
|---|---|---|---|
| Quadrant | BADHDUFLAG | Total packets | Discarded packets |
| A | 1 | 139740174092328 | 139736760975406 |
| B | 1 | -1 | -1 |
| C | 1 | -1 | -1 |
| D | 1 | -1 | -1 |
| Quadrant | Total seconds | Saturated seconds | Saturation percentage |
|---|---|---|---|
| A | 7796 | 519 | 6.657260% |
| B | 7796 | 747 | 9.581837% |
| C | 7798 | 4064 | 52.115927% |
| D | 7798 | 163 | 2.090280% |
Noise dominated data is calculated using 1-second bins in cleaned event files. If a bin has >2000 counts, and if more than 50% of those come from <1% of pixels, then it is considered to be noise-dominated and hence unusable.
| Quadrant | # 1 sec bins | Bins with >0 counts | Bins with >2000 counts | High rate bins dominated by noise | Noise dominated (total time) | Noise dominated (detector-on time) | Marked lightcurve |
|---|---|---|---|---|---|---|---|
| A | 7813 | 7798 | 420 | 420 | 5.38% | 5.39% | 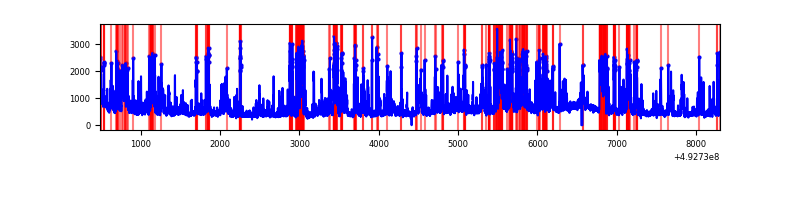 |
| B | 7813 | 7798 | 432 | 432 | 5.53% | 5.54% | 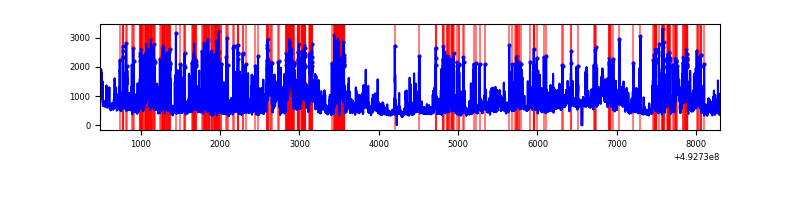 |
| C | 7812 | 7797 | 3928 | 3928 | 50.28% | 50.38% | 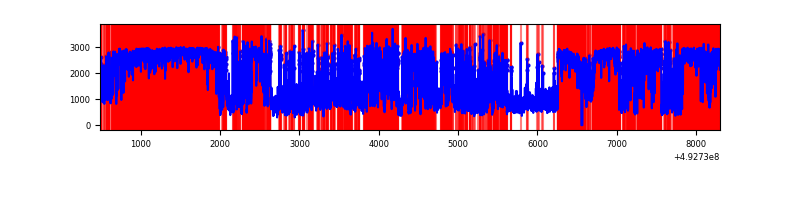 |
| D | 7813 | 7799 | 116 | 116 | 1.48% | 1.49% | 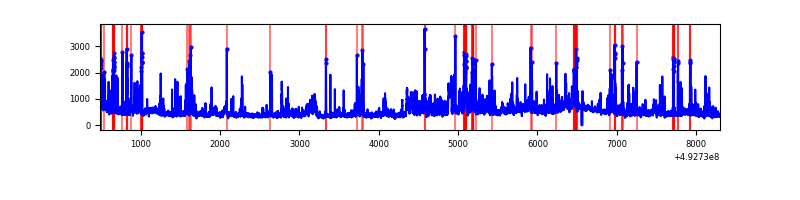 |
Top three noisy pixels from each quadrant. If the there are fewer than three noisy pixels in the level2.evt file, extra rows are filled as -1
| Pixel properties | Quadrant properties | ||||||
|---|---|---|---|---|---|---|---|
| Quadrant | DetID | PixID | Counts | Sigma | Mean | Median | Sigma |
| A | 3 | 63 | 1460986 | 7244.51 | 815 | 796 | 201.6 |
| A | 15 | 174 | 894495 | 4433.95 | 815 | 796 | 201.6 |
| A | 7 | 206 | 158967 | 784.74 | 815 | 796 | 201.6 |
| B | 0 | 171 | 1207500 | 7078.65 | 812 | 784 | 170.5 |
| B | 4 | 206 | 1022439 | 5993.07 | 812 | 784 | 170.5 |
| B | 1 | 223 | 374943 | 2194.83 | 812 | 784 | 170.5 |
| C | 1 | 241 | 7002239 | 45243.07 | 560 | 556 | 154.8 |
| C | 15 | 224 | 3597874 | 23244.94 | 560 | 556 | 154.8 |
| C | 9 | 38 | 898030 | 5799.25 | 560 | 556 | 154.8 |
| D | 0 | 18 | 521246 | 2271.02 | 809 | 773 | 229.2 |
| D | 2 | 153 | 350808 | 1527.34 | 809 | 773 | 229.2 |
| D | 2 | 249 | 159463 | 692.43 | 809 | 773 | 229.2 |
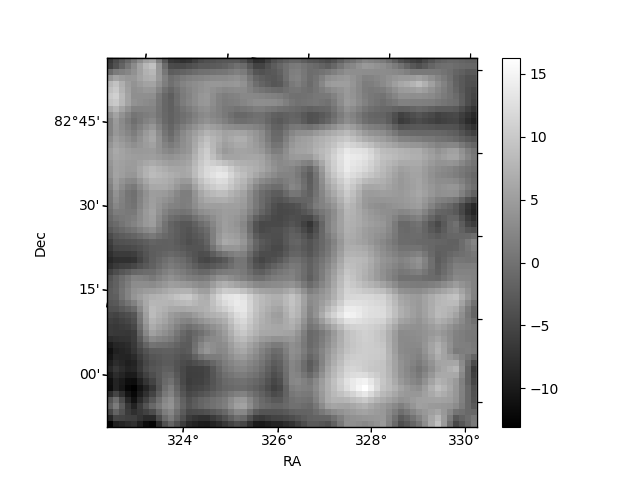
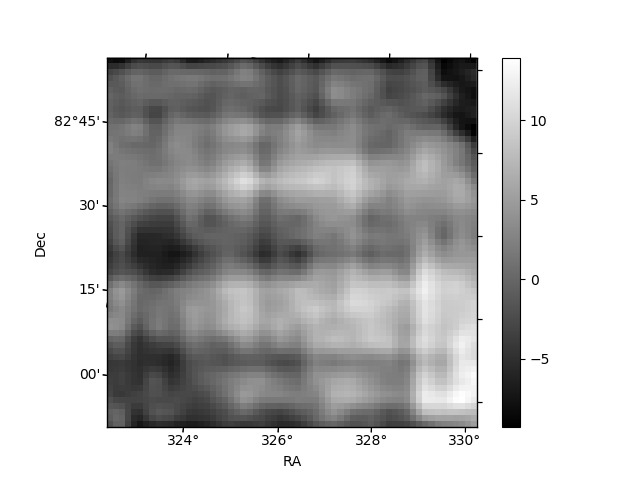
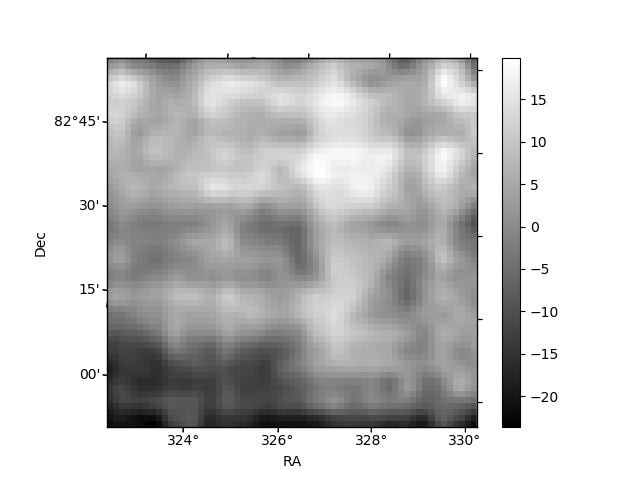
Histogram calculated using DETX and DETY for each event in the final _common_clean file
| Quadrant A | 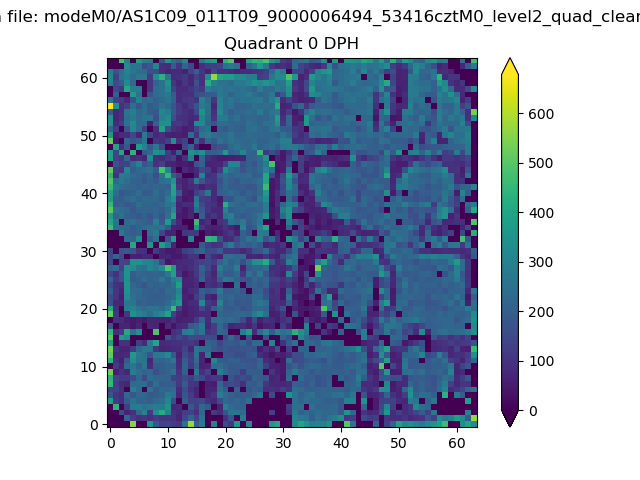 |
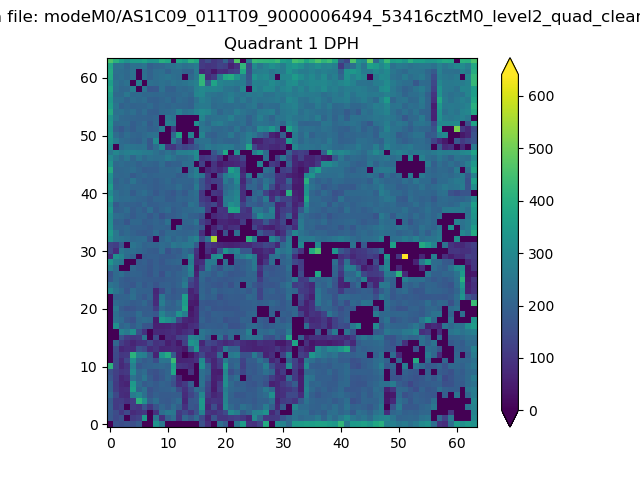 |
Quadrant B |
|---|---|---|---|
| Quadrant D | 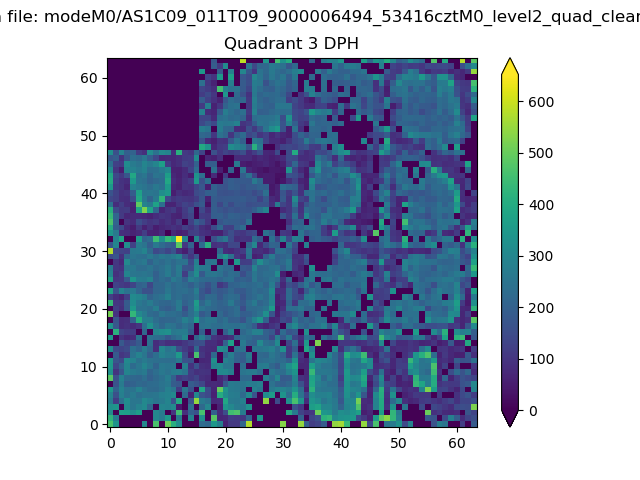 |
 |
Quadrant C |
| Plot type | Count rate plots | Images |
|---|---|---|
| Comparison with Poisson distribution Blue bars denote a histogram of data divided into 1 sec bins. Red curve is a Poisson curve with rate = median count rate of data. |
 |
 |
| Quadrant-wise count rates Data is divided into 100 sec bins |
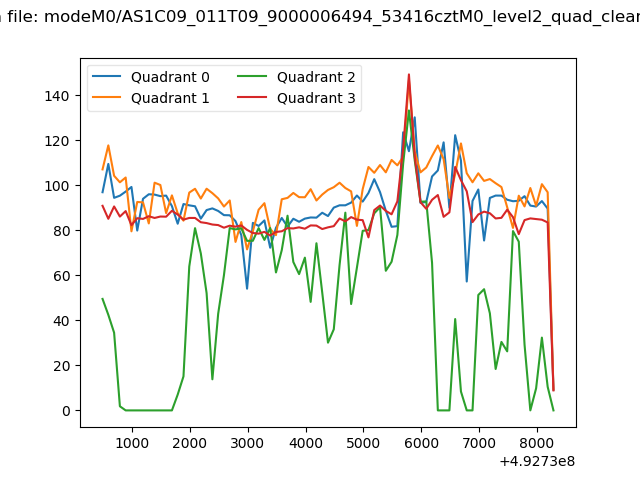 |
|
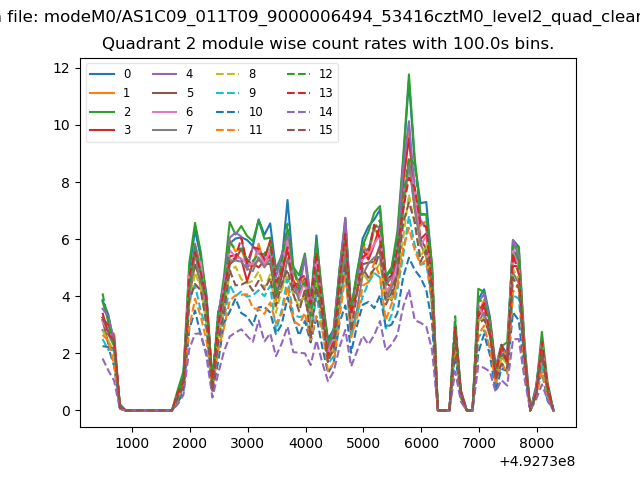
| Module-wise count rates for Quadrant A Data is divided into 100 sec bins |
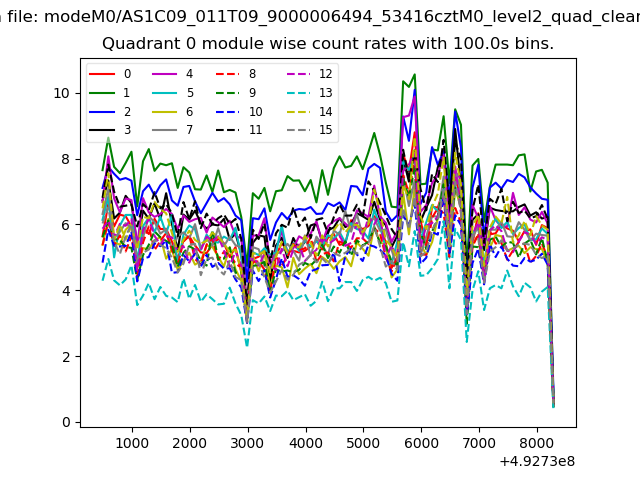 |
 |
| Module-wise count rates for Quadrant B Data is divided into 100 sec bins |
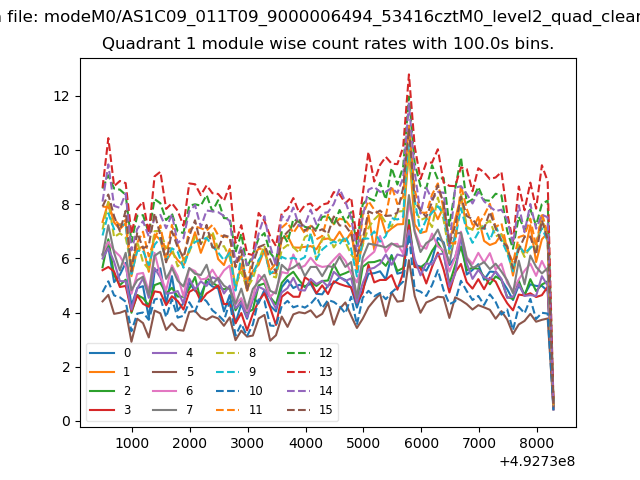 |
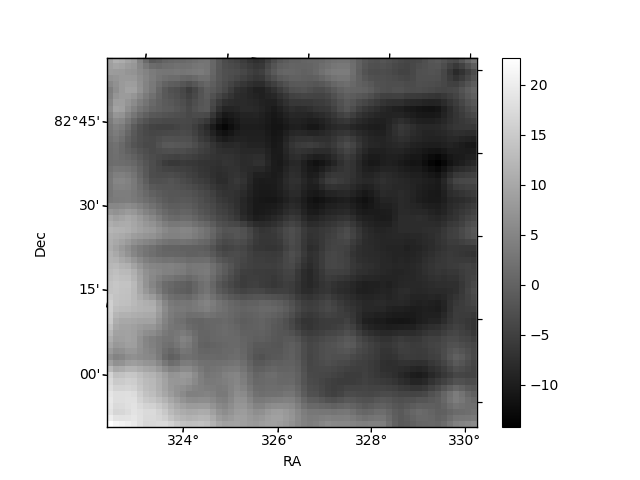 |
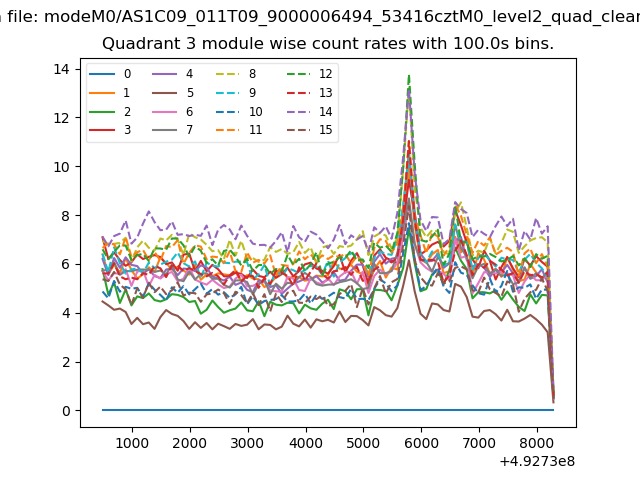
| Module-wise count rates for Quadrant C Data is divided into 100 sec bins |
 |
 |
| Module-wise count rates for Quadrant D Data is divided into 100 sec bins |
 |
 |
| Parameter | Plot |
|---|---|
| CZT HV Monitor | 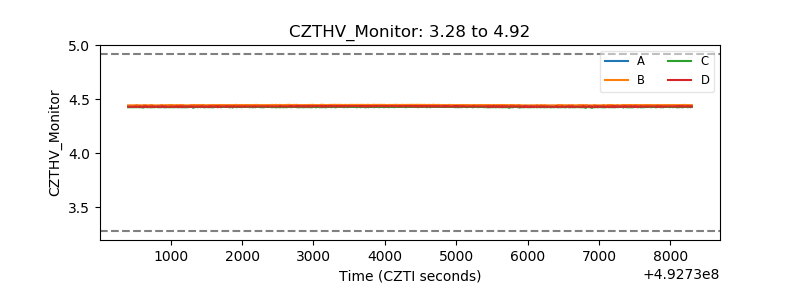 |
| D_VDD | 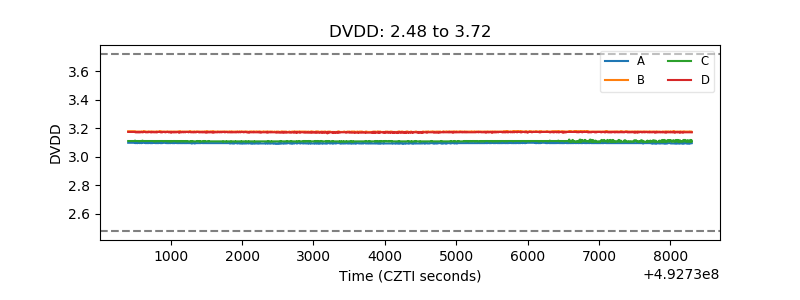 |
| Temperature 1 | 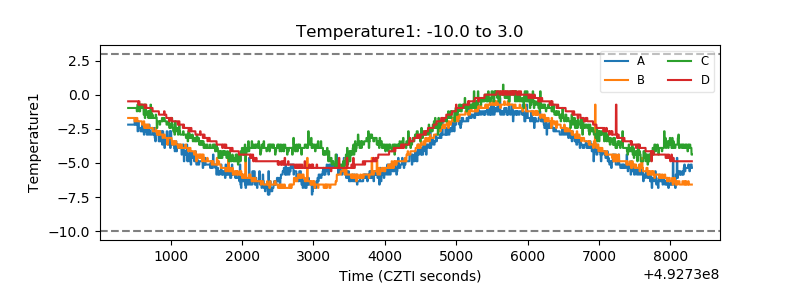 |
| Veto HV Monitor |  |
| Veto LLD | 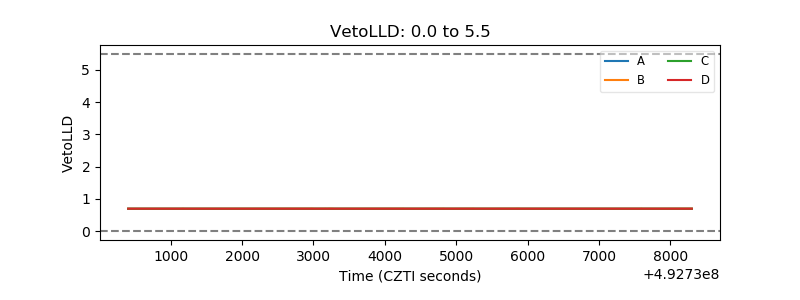 |
| Alpha Counter | 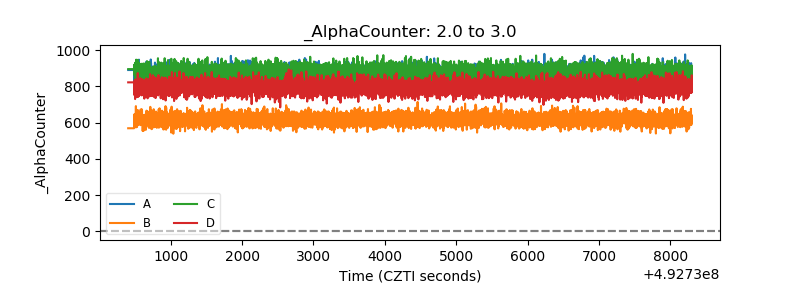 |
| _CPM_Rate |  |
| CZT Counter | 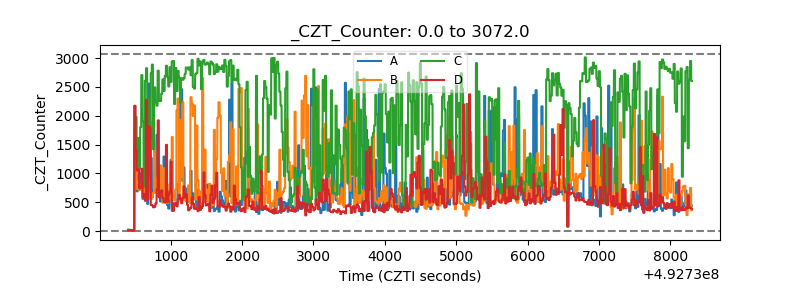 |
| +2.5 Volts monitor |  |
| +5 Volts monitor |  |
| _ROLL_ROT | 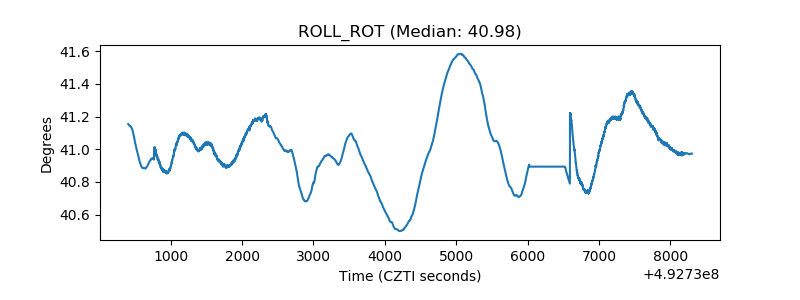 |
| _Roll_DEC | 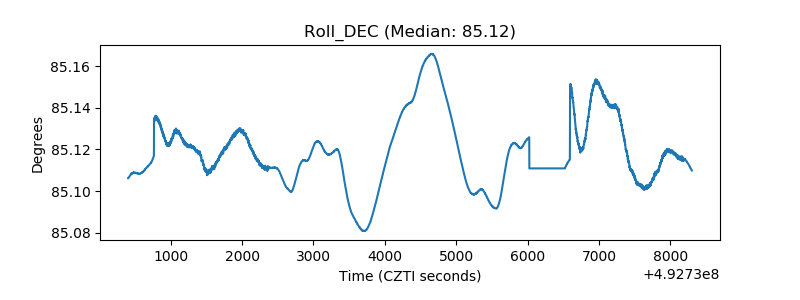 |
| _Roll_RA | 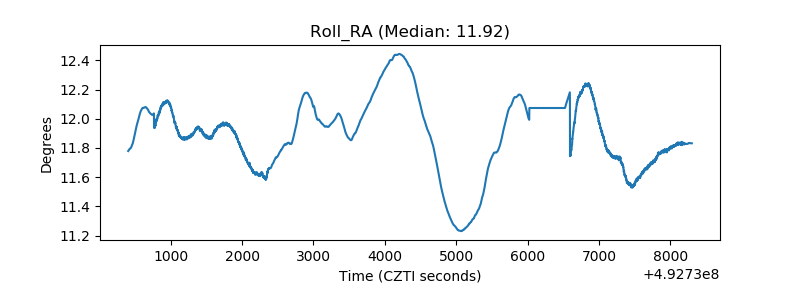 |
| Veto Counter | 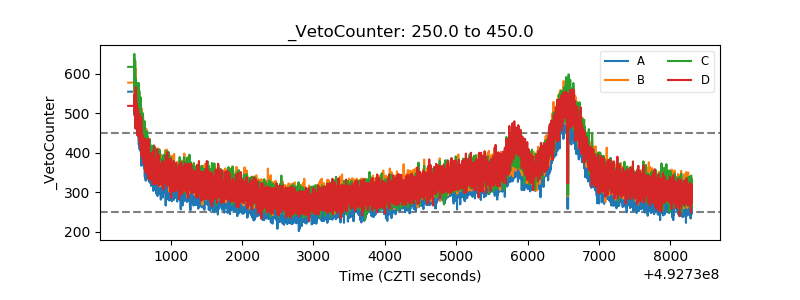 |