| Param | Original file | Final file |
|---|---|---|
| Filename | modeM0/AS1C09_011T09_9000006494_53417cztM0_level2.fits | modeM0/AS1C09_011T09_9000006494_53417cztM0_level2_quad_clean.evt |
| Size (bytes) | 952,076,160 | 98,637,120 |
| Size | 908.0 MB | 94.1 MB |
| Events in quadrant A | 5,344,260 | 741,256 |
| Events in quadrant B | 6,748,782 | 765,094 |
| Events in quadrant C | 17,468,169 | 240,588 |
| Events in quadrant D | 5,056,925 | 679,134 |
| Mode SS | |||
|---|---|---|---|
| Quadrant | BADHDUFLAG | Total packets | Discarded packets |
| A | 0 | 160 | 0 |
| B | 0 | 160 | 0 |
| C | 0 | 160 | 0 |
| D | 0 | 160 | 0 |
| Mode M0 | |||
|---|---|---|---|
| Quadrant | BADHDUFLAG | Total packets | Discarded packets |
| A | 0 | 21629 | 1 |
| B | 0 | 25730 | 1 |
| C | 0 | 57297 | 1 |
| D | 0 | 20868 | 1 |
| Quadrant | Total seconds | Saturated seconds | Saturation percentage |
|---|---|---|---|
| A | 8065 | 351 | 4.352139% |
| B | 8065 | 787 | 9.758215% |
| C | 8065 | 5781 | 71.680099% |
| D | 8065 | 284 | 3.521389% |
Noise dominated data is calculated using 1-second bins in cleaned event files. If a bin has >2000 counts, and if more than 50% of those come from <1% of pixels, then it is considered to be noise-dominated and hence unusable.
| Quadrant | # 1 sec bins | Bins with >0 counts | Bins with >2000 counts | High rate bins dominated by noise | Noise dominated (total time) | Noise dominated (detector-on time) | Marked lightcurve |
|---|---|---|---|---|---|---|---|
| A | 8080 | 8066 | 281 | 281 | 3.48% | 3.48% |  |
| B | 8080 | 8066 | 524 | 524 | 6.49% | 6.50% | 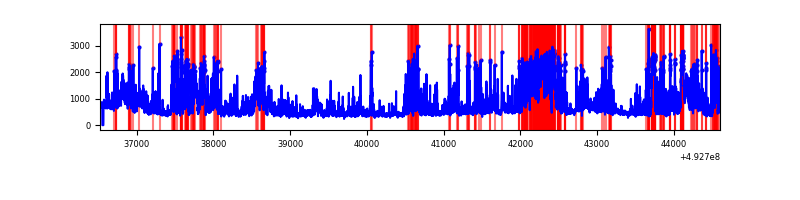 |
| C | 8080 | 8065 | 5550 | 5550 | 68.69% | 68.82% | 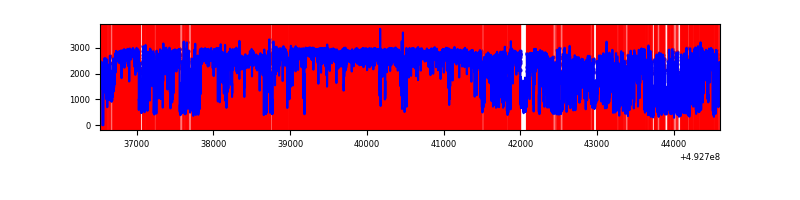 |
| D | 8080 | 8066 | 238 | 238 | 2.95% | 2.95% | 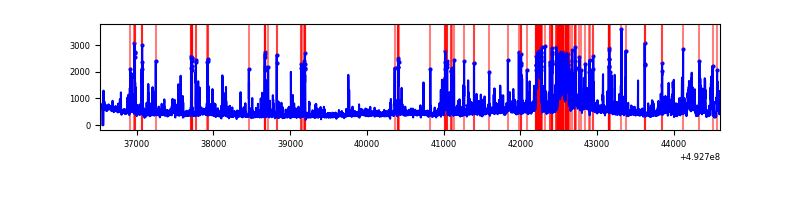 |
Top three noisy pixels from each quadrant. If the there are fewer than three noisy pixels in the level2.evt file, extra rows are filled as -1
| Pixel properties | Quadrant properties | ||||||
|---|---|---|---|---|---|---|---|
| Quadrant | DetID | PixID | Counts | Sigma | Mean | Median | Sigma |
| A | 15 | 174 | 691516 | 3332.83 | 838 | 815 | 207.2 |
| A | 3 | 63 | 581362 | 2801.31 | 838 | 815 | 207.2 |
| A | 3 | 62 | 203144 | 976.29 | 838 | 815 | 207.2 |
| B | 4 | 206 | 1951614 | 11212.75 | 825 | 797 | 174.0 |
| B | 4 | 171 | 329117 | 1887.09 | 825 | 797 | 174.0 |
| B | 10 | 254 | 279057 | 1599.36 | 825 | 797 | 174.0 |
| C | 1 | 241 | 9879201 | 71899.18 | 496 | 492 | 137.4 |
| C | 15 | 224 | 4127943 | 30040.4 | 496 | 492 | 137.4 |
| C | 9 | 38 | 566422 | 4118.95 | 496 | 492 | 137.4 |
| D | 3 | 12 | 384532 | 1632.88 | 821 | 780 | 235.0 |
| D | 0 | 18 | 330794 | 1404.22 | 821 | 780 | 235.0 |
| D | 2 | 153 | 205891 | 872.75 | 821 | 780 | 235.0 |
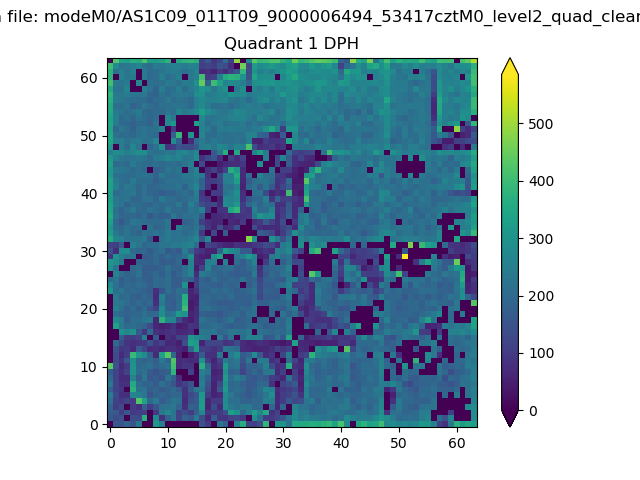
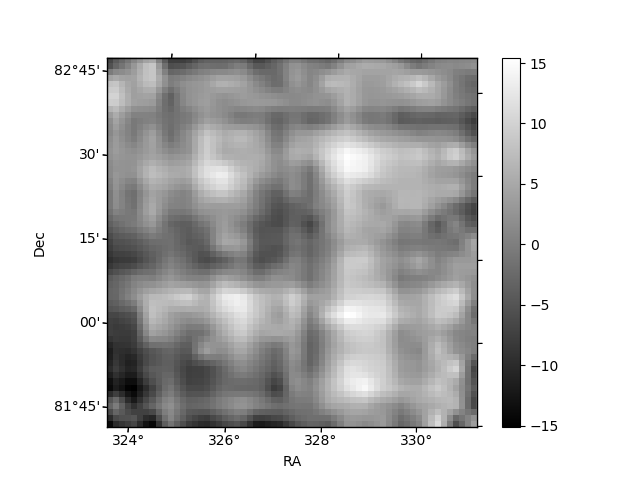
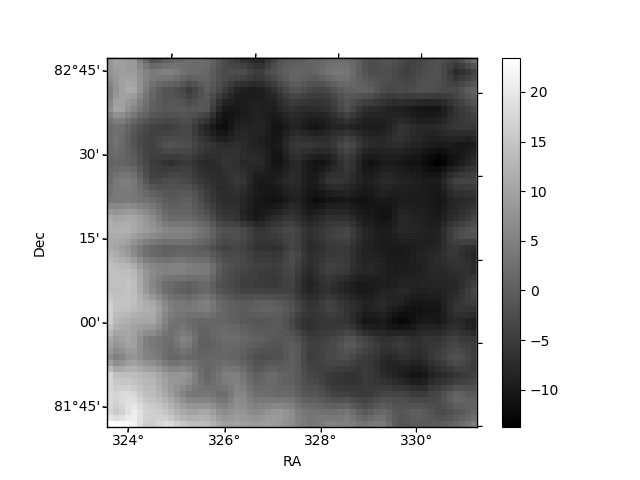
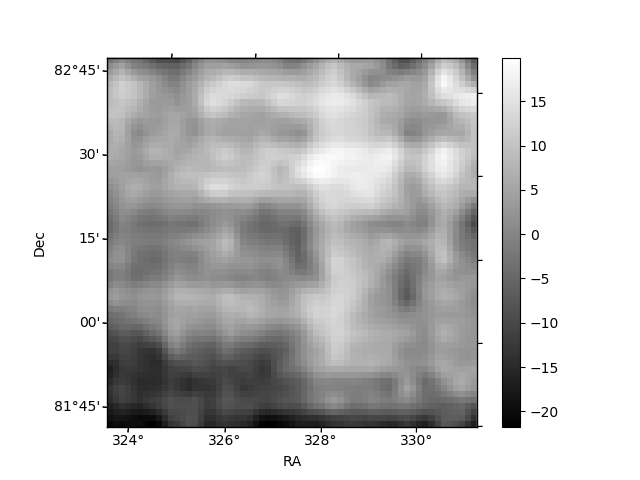
Histogram calculated using DETX and DETY for each event in the final _common_clean file
| Quadrant A | 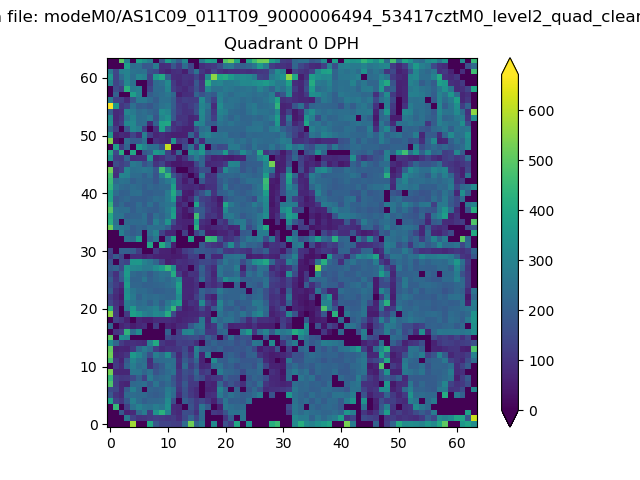 |
 |
Quadrant B |
|---|---|---|---|
| Quadrant D | 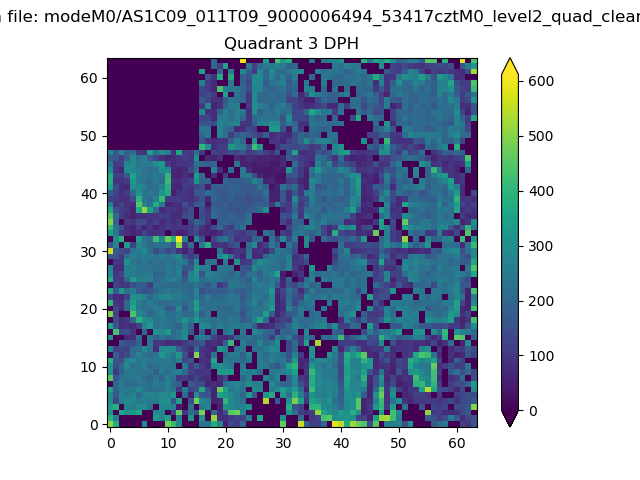 |
 |
Quadrant C |
| Plot type | Count rate plots | Images |
|---|---|---|
| Comparison with Poisson distribution Blue bars denote a histogram of data divided into 1 sec bins. Red curve is a Poisson curve with rate = median count rate of data. |
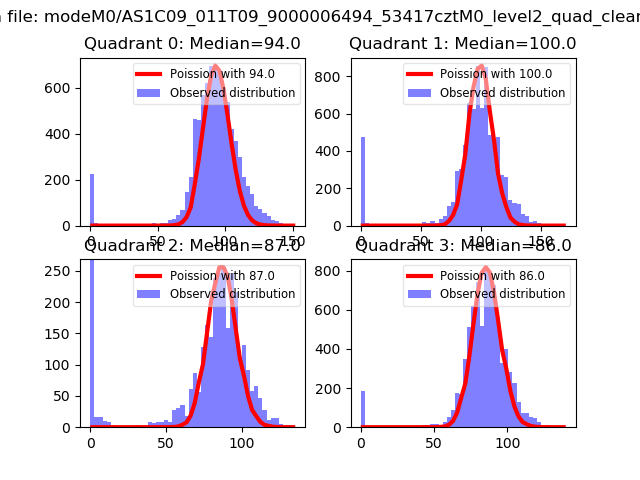 |
 |
| Quadrant-wise count rates Data is divided into 100 sec bins |
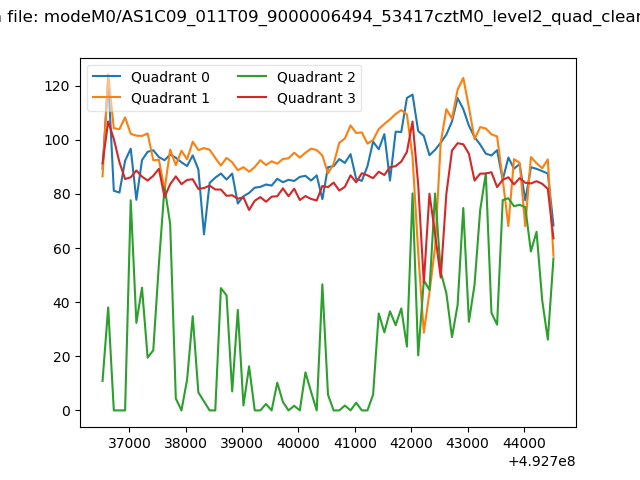 |
|
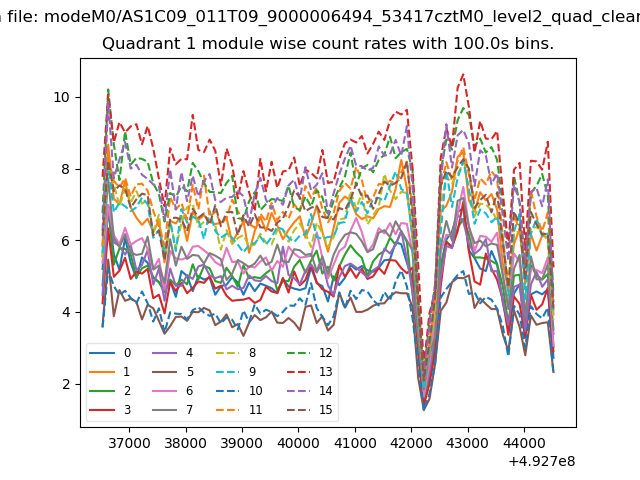
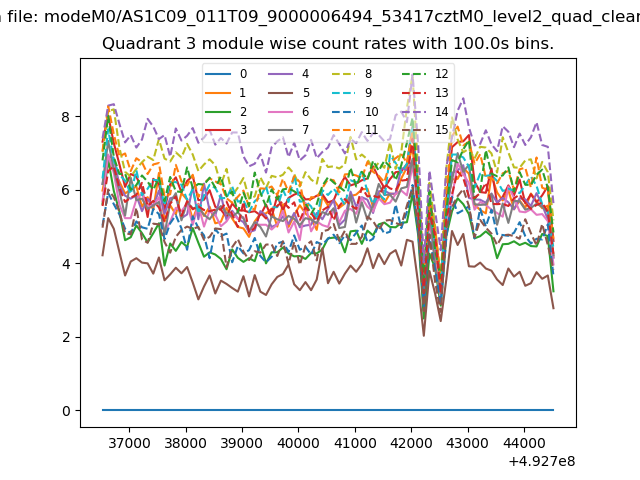
| Module-wise count rates for Quadrant A Data is divided into 100 sec bins |
 |
 |
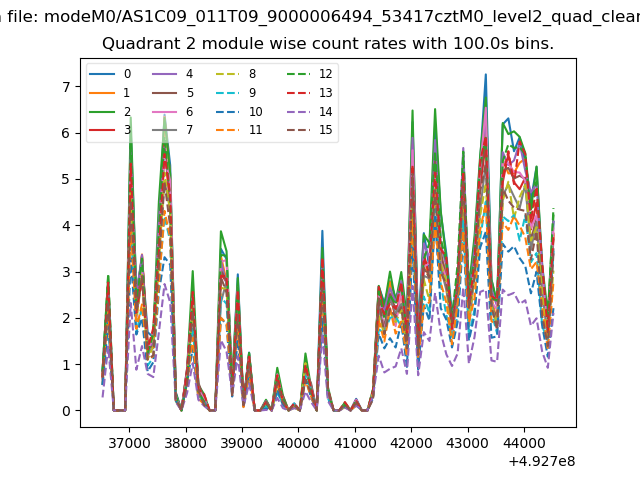
| Module-wise count rates for Quadrant B Data is divided into 100 sec bins |
 |
 |
| Module-wise count rates for Quadrant C Data is divided into 100 sec bins |
 |
 |
| Module-wise count rates for Quadrant D Data is divided into 100 sec bins |
 |
 |
| Parameter | Plot |
|---|---|
| CZT HV Monitor | 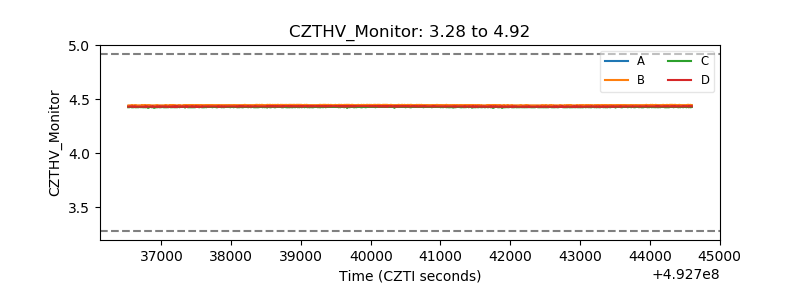 |
| D_VDD | 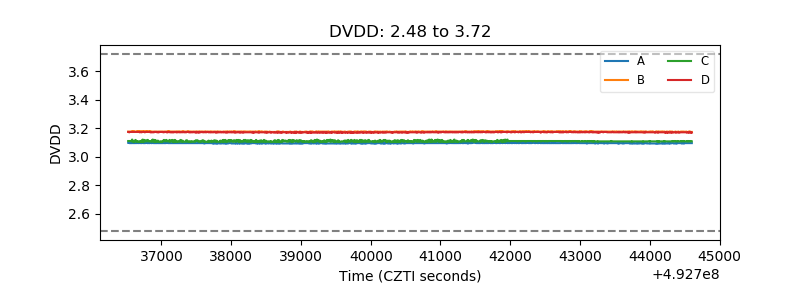 |
| Temperature 1 | 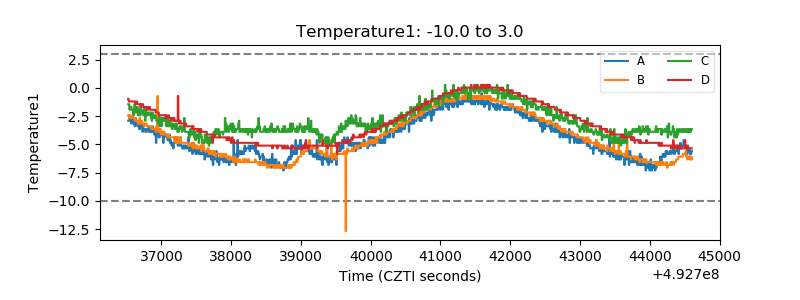 |
| Veto HV Monitor | 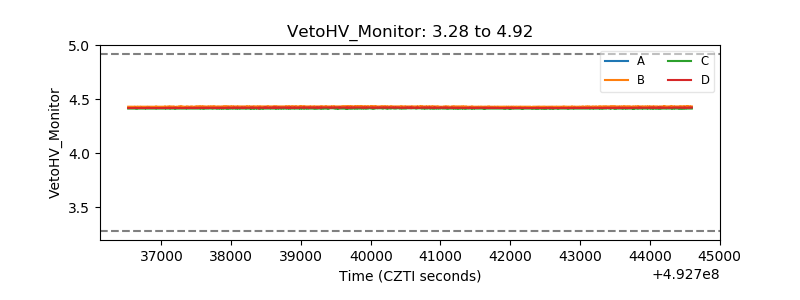 |
| Veto LLD | 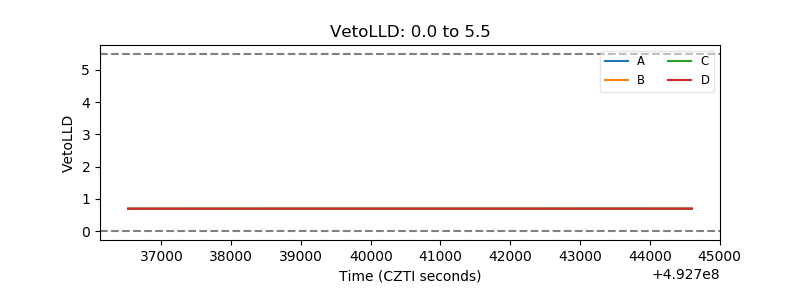 |
| Alpha Counter |  |
| _CPM_Rate | 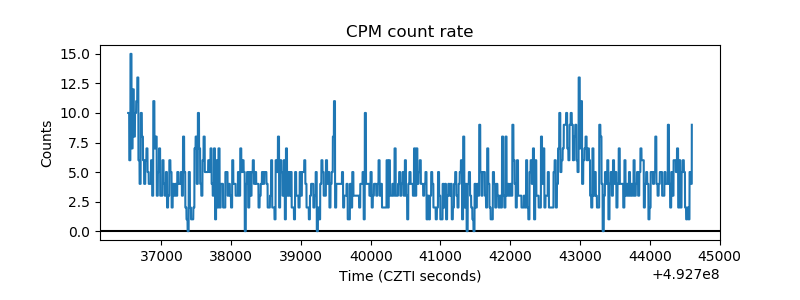 |
| CZT Counter | 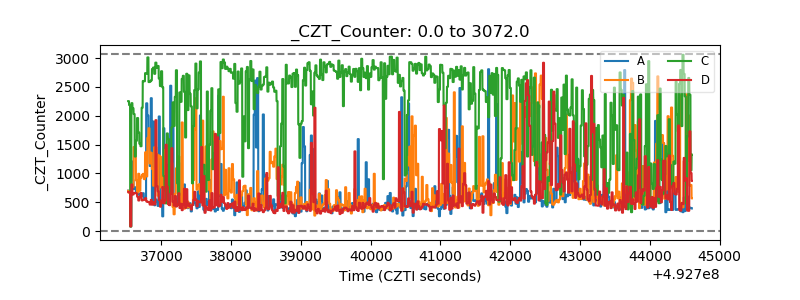 |
| +2.5 Volts monitor | 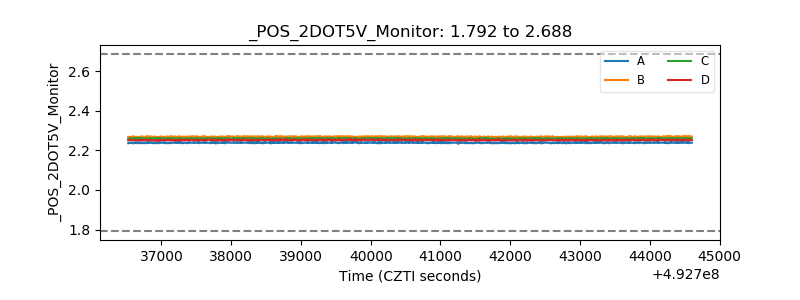 |
| +5 Volts monitor |  |
| _ROLL_ROT | 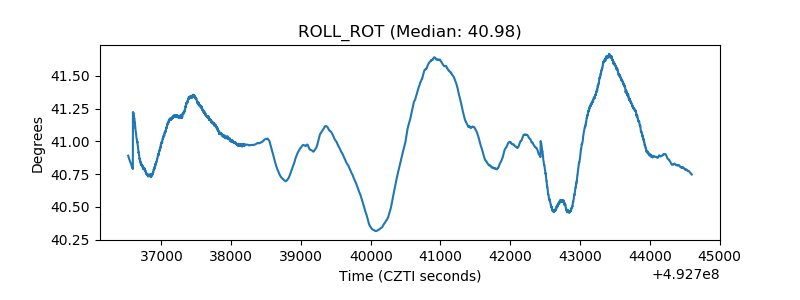 |
| _Roll_DEC | 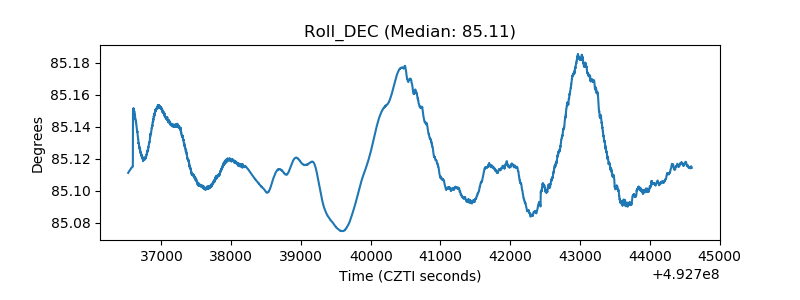 |
| _Roll_RA | 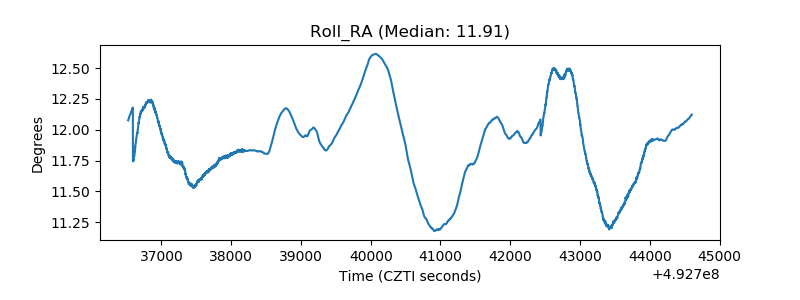 |
| Veto Counter | 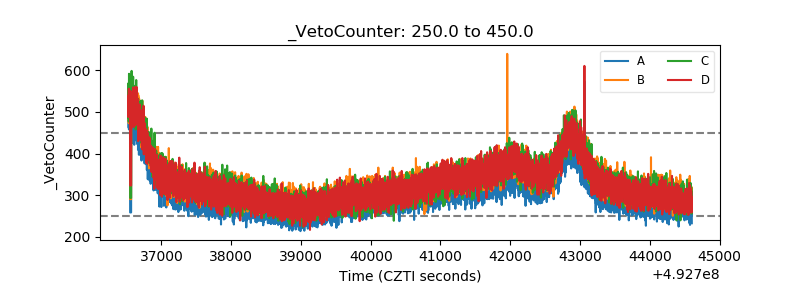 |