| Param | Original file | Final file |
|---|---|---|
| Filename | modeM0/AS1C09_011T09_9000006494_53418cztM0_level2.fits | modeM0/AS1C09_011T09_9000006494_53418cztM0_level2_quad_clean.evt |
| Size (bytes) | 982,520,640 | 107,248,320 |
| Size | 937.0 MB | 102.3 MB |
| Events in quadrant A | 5,317,993 | 796,892 |
| Events in quadrant B | 10,337,147 | 675,450 |
| Events in quadrant C | 14,021,623 | 461,730 |
| Events in quadrant D | 6,031,907 | 719,043 |
| Mode SS | |||
|---|---|---|---|
| Quadrant | BADHDUFLAG | Total packets | Discarded packets |
| A | 0 | 170 | 0 |
| B | 0 | 170 | 0 |
| C | 0 | 170 | 0 |
| D | 0 | 170 | 0 |
| Mode M0 | |||
|---|---|---|---|
| Quadrant | BADHDUFLAG | Total packets | Discarded packets |
| A | 0 | 21997 | 0 |
| B | 0 | 36614 | 0 |
| C | 0 | 47558 | 0 |
| D | 0 | 23974 | 0 |
| Quadrant | Total seconds | Saturated seconds | Saturation percentage |
|---|---|---|---|
| A | 8550 | 249 | 2.912281% |
| B | 8550 | 2190 | 25.614035% |
| C | 8550 | 3869 | 45.251462% |
| D | 8551 | 258 | 3.017191% |
Noise dominated data is calculated using 1-second bins in cleaned event files. If a bin has >2000 counts, and if more than 50% of those come from <1% of pixels, then it is considered to be noise-dominated and hence unusable.
| Quadrant | # 1 sec bins | Bins with >0 counts | Bins with >2000 counts | High rate bins dominated by noise | Noise dominated (total time) | Noise dominated (detector-on time) | Marked lightcurve |
|---|---|---|---|---|---|---|---|
| A | 8550 | 8550 | 186 | 186 | 2.18% | 2.18% | 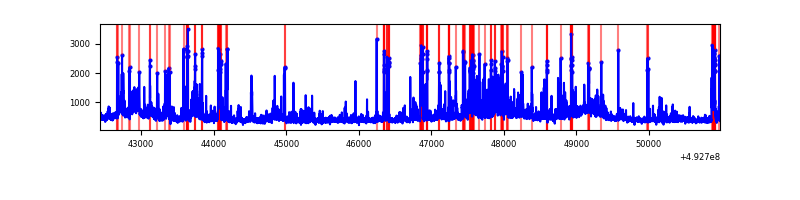 |
| B | 8550 | 8550 | 1616 | 1616 | 18.90% | 18.90% | 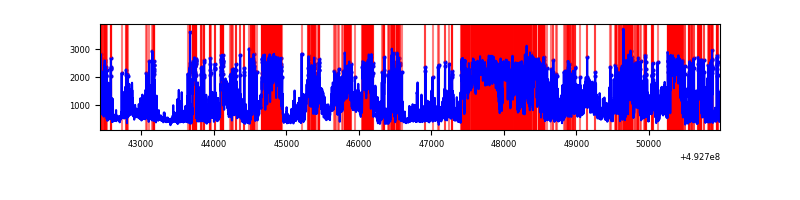 |
| C | 8550 | 8550 | 3623 | 3623 | 42.37% | 42.37% | 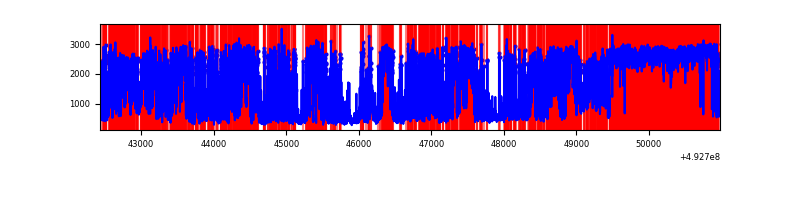 |
| D | 8551 | 8551 | 231 | 231 | 2.70% | 2.70% | 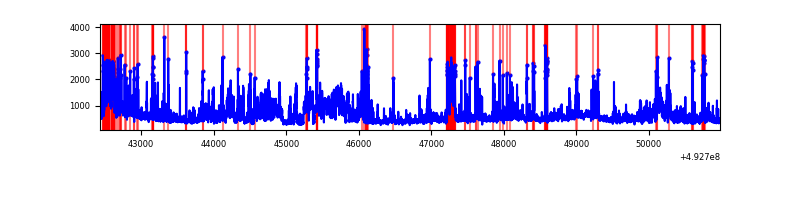 |
Top three noisy pixels from each quadrant. If the there are fewer than three noisy pixels in the level2.evt file, extra rows are filled as -1
| Pixel properties | Quadrant properties | ||||||
|---|---|---|---|---|---|---|---|
| Quadrant | DetID | PixID | Counts | Sigma | Mean | Median | Sigma |
| A | 15 | 174 | 643328 | 2884.58 | 899 | 875 | 222.7 |
| A | 3 | 63 | 629112 | 2820.75 | 899 | 875 | 222.7 |
| A | 7 | 206 | 156592 | 699.16 | 899 | 875 | 222.7 |
| B | 4 | 206 | 5832334 | 33808.8 | 812 | 785 | 172.5 |
| B | 10 | 28 | 353169 | 2042.97 | 812 | 785 | 172.5 |
| B | 4 | 171 | 279872 | 1618.03 | 812 | 785 | 172.5 |
| C | 1 | 241 | 5701363 | 29911.01 | 699 | 693 | 190.6 |
| C | 15 | 224 | 4795166 | 25156.26 | 699 | 693 | 190.6 |
| C | 4 | 5 | 163180 | 852.56 | 699 | 693 | 190.6 |
| D | 0 | 18 | 1029390 | 4156.4 | 874 | 833 | 247.5 |
| D | 4 | 234 | 305242 | 1230.12 | 874 | 833 | 247.5 |
| D | 2 | 153 | 246556 | 992.97 | 874 | 833 | 247.5 |
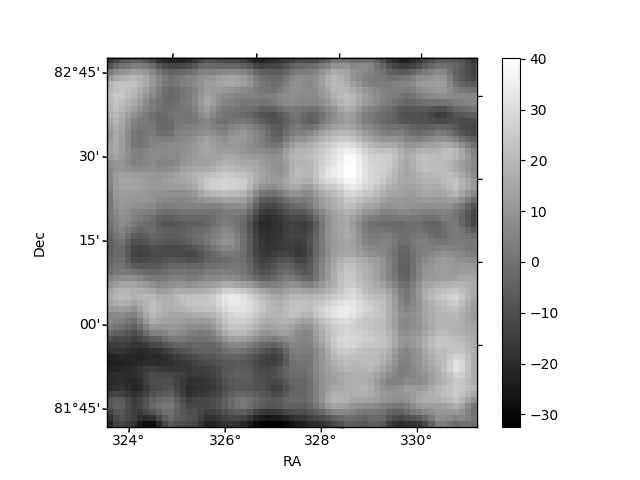
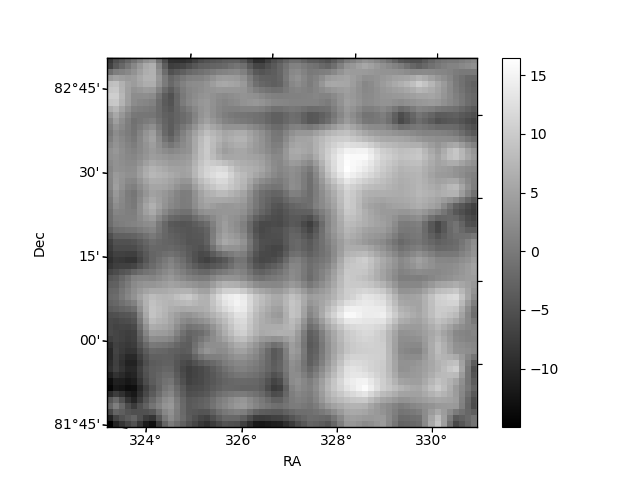
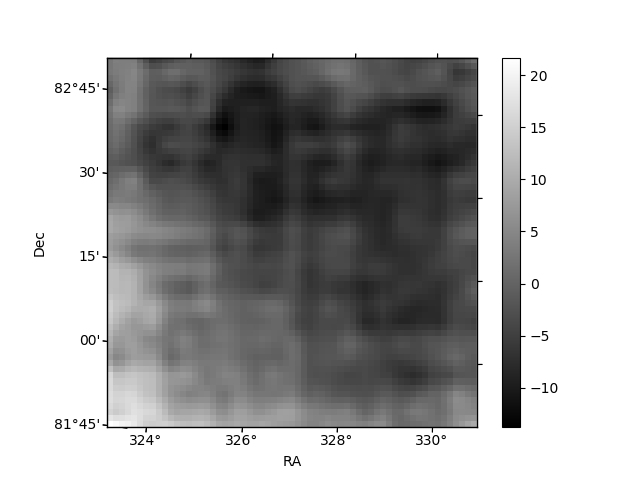
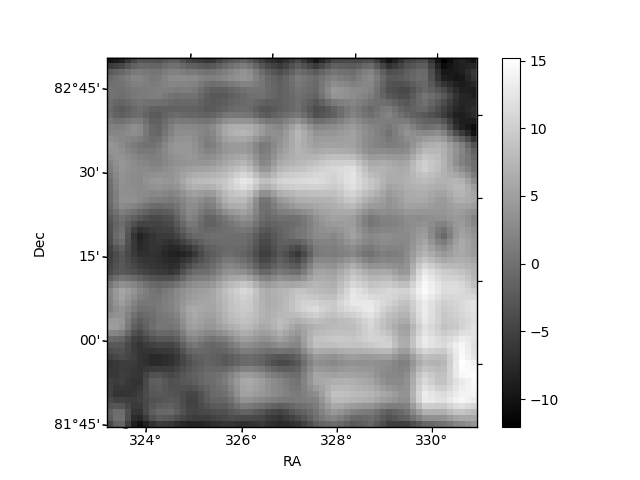
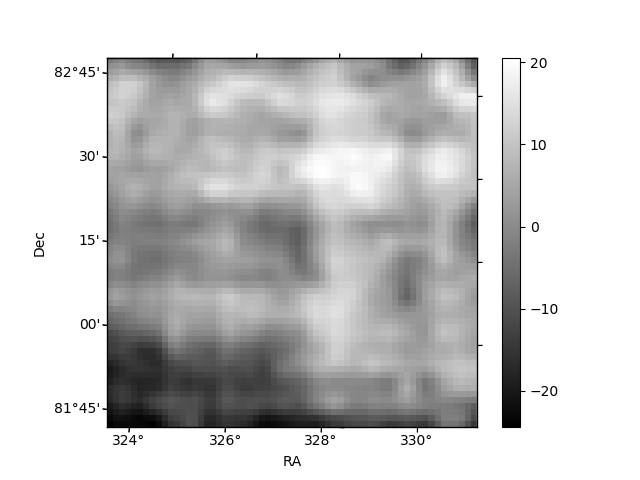
Histogram calculated using DETX and DETY for each event in the final _common_clean file
| Quadrant A | 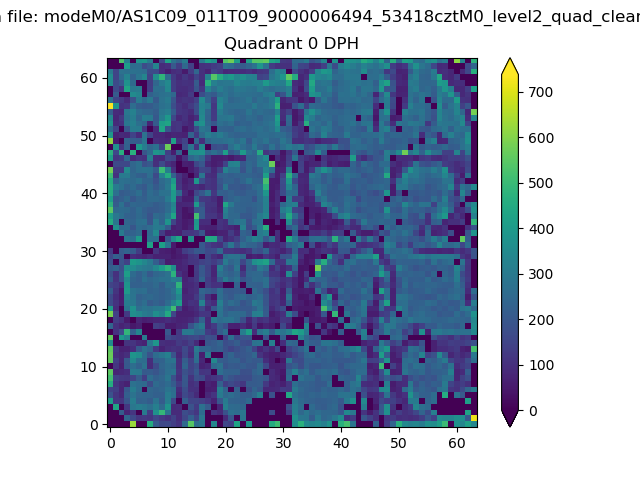 |
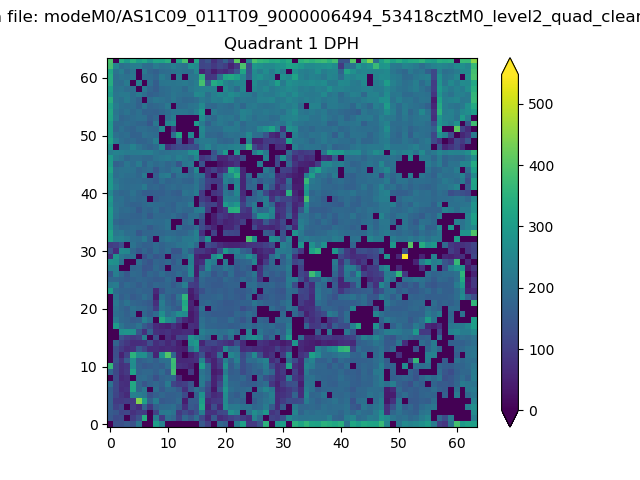 |
Quadrant B |
|---|---|---|---|
| Quadrant D | 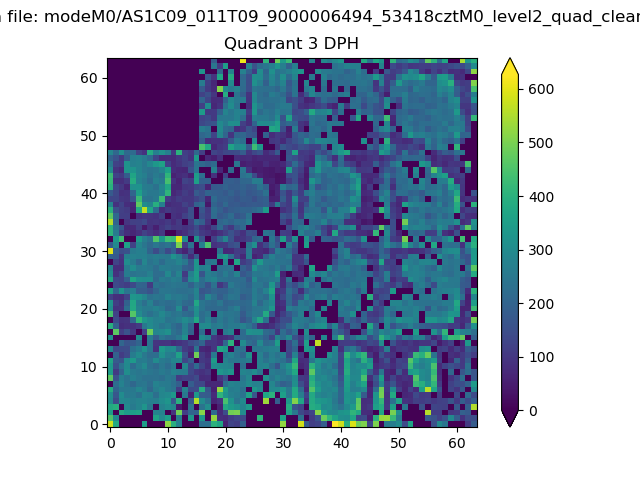 |
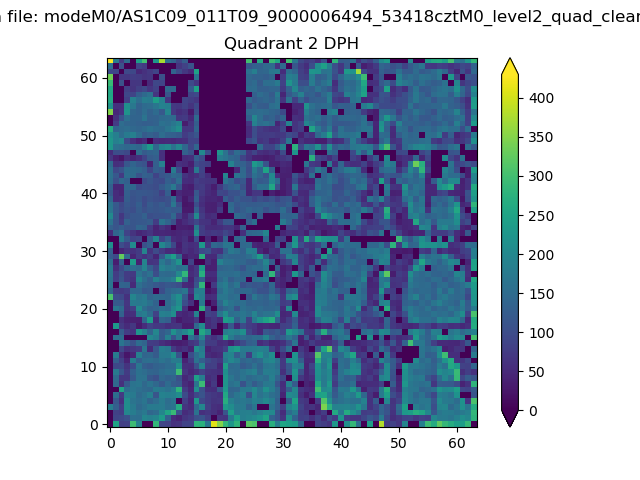 |
Quadrant C |
| Plot type | Count rate plots | Images |
|---|---|---|
| Comparison with Poisson distribution Blue bars denote a histogram of data divided into 1 sec bins. Red curve is a Poisson curve with rate = median count rate of data. |
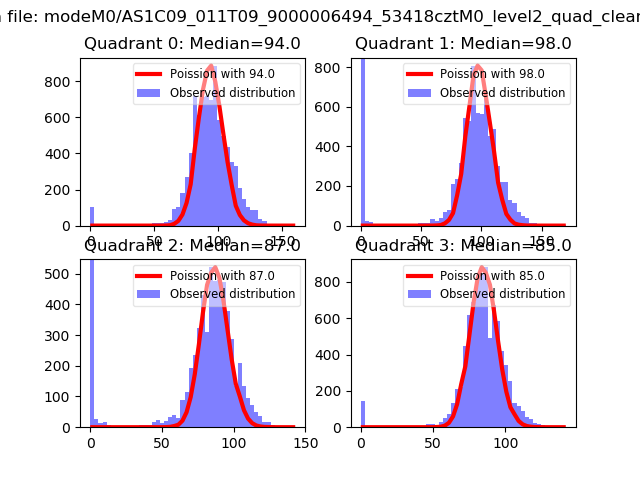 |
 |
| Quadrant-wise count rates Data is divided into 100 sec bins |
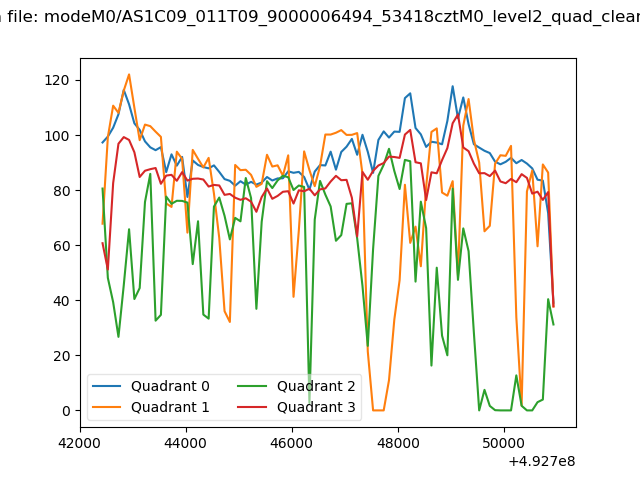 |
|
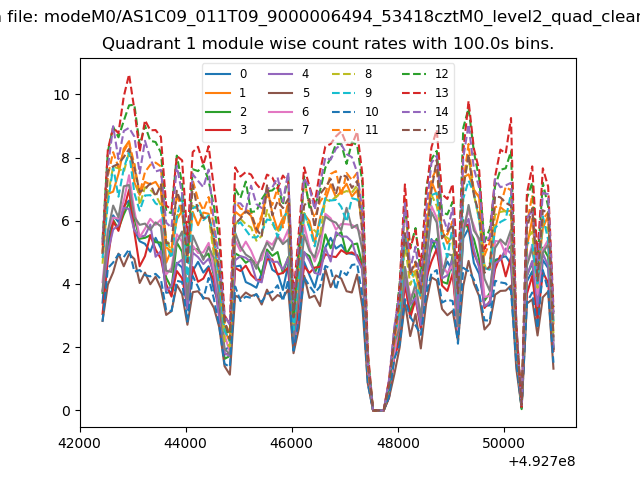
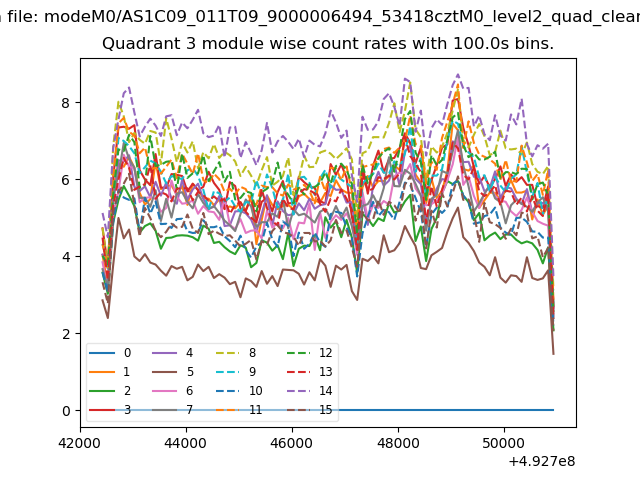
| Module-wise count rates for Quadrant A Data is divided into 100 sec bins |
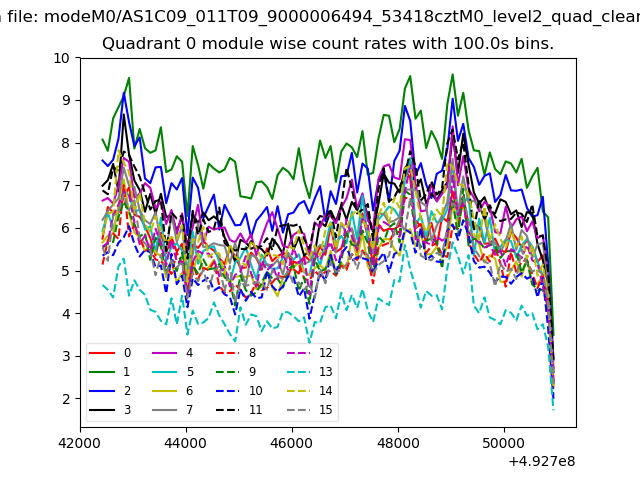 |
 |
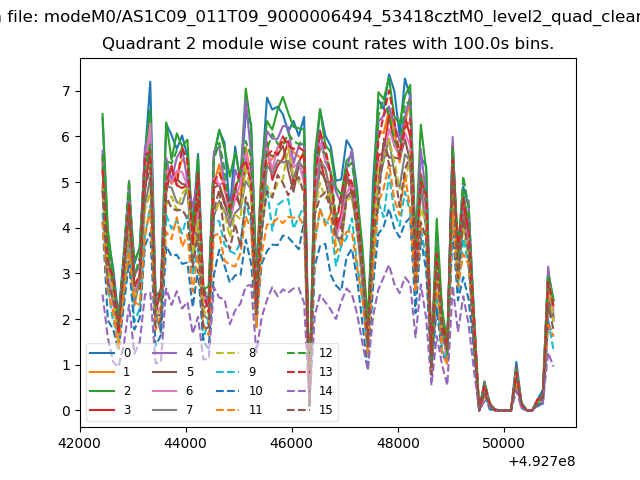
| Module-wise count rates for Quadrant B Data is divided into 100 sec bins |
 |
 |
| Module-wise count rates for Quadrant C Data is divided into 100 sec bins |
 |
 |
| Module-wise count rates for Quadrant D Data is divided into 100 sec bins |
 |
 |
| Parameter | Plot |
|---|---|
| CZT HV Monitor | 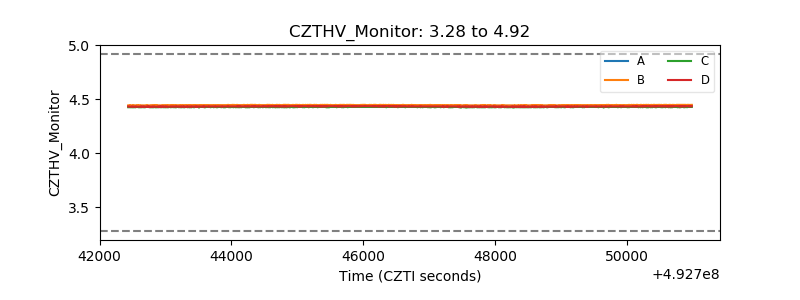 |
| D_VDD | 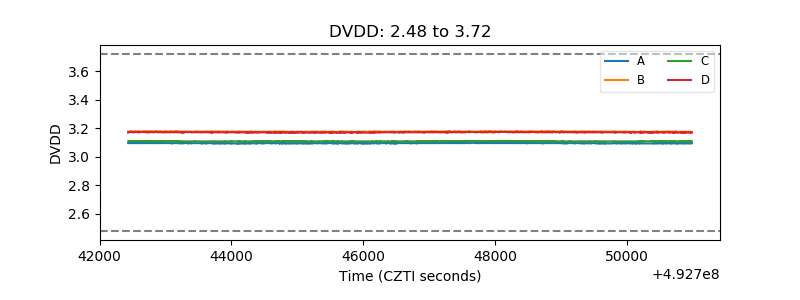 |
| Temperature 1 | 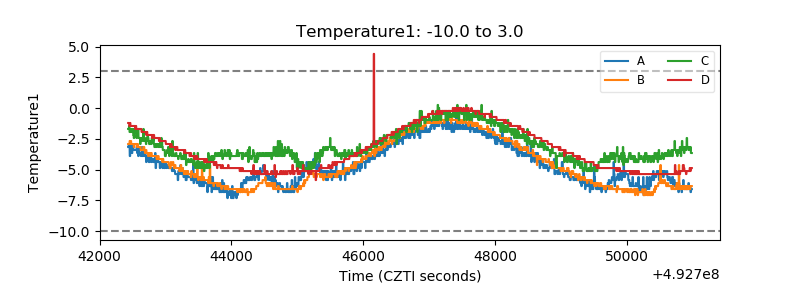 |
| Veto HV Monitor | 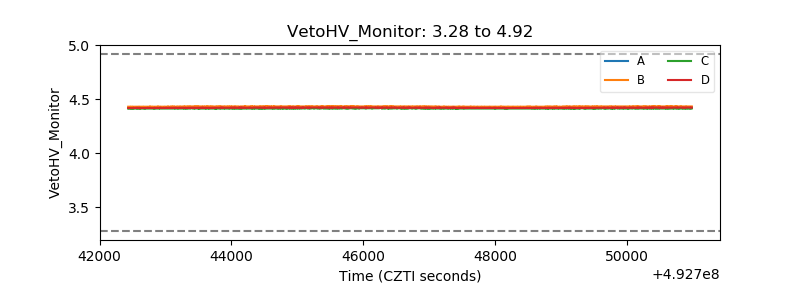 |
| Veto LLD | 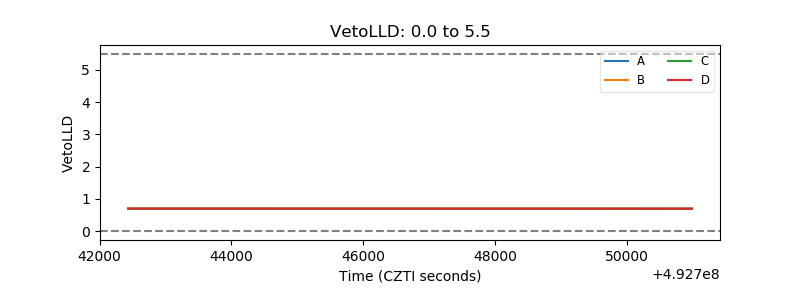 |
| Alpha Counter | 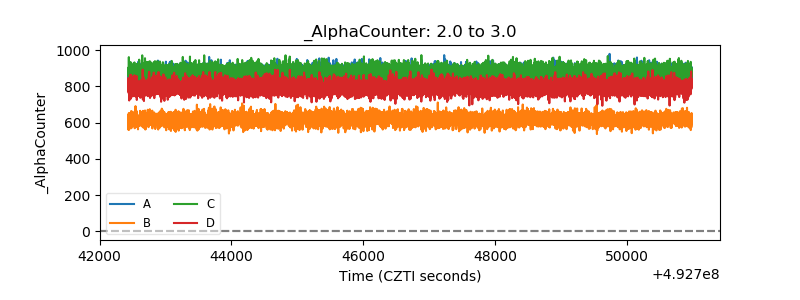 |
| _CPM_Rate | 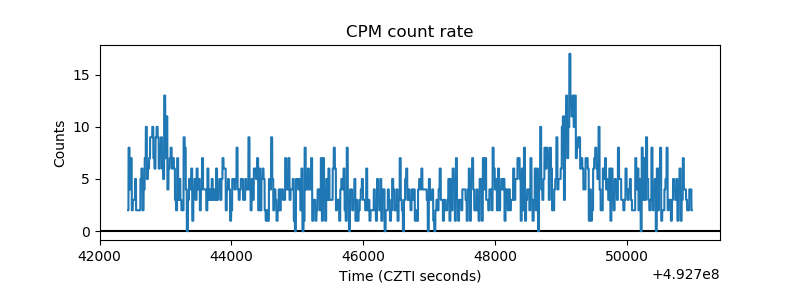 |
| CZT Counter | 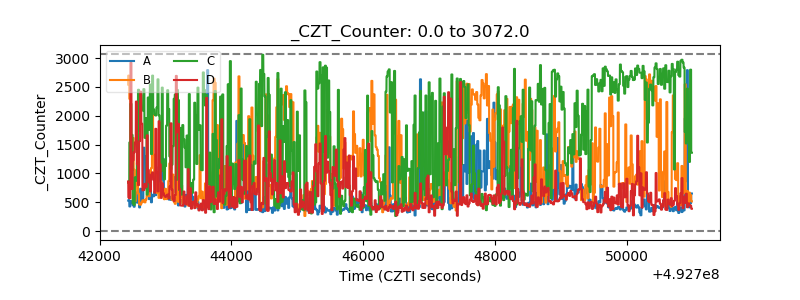 |
| +2.5 Volts monitor | 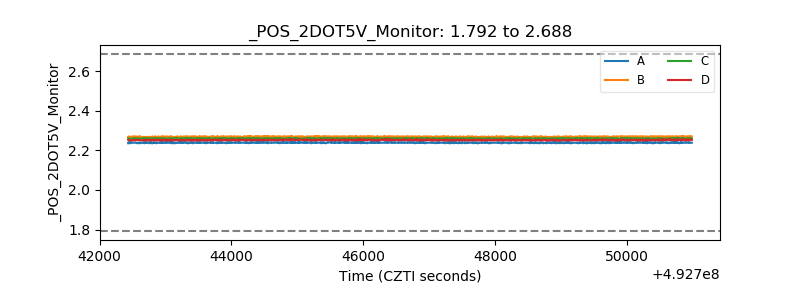 |
| +5 Volts monitor | 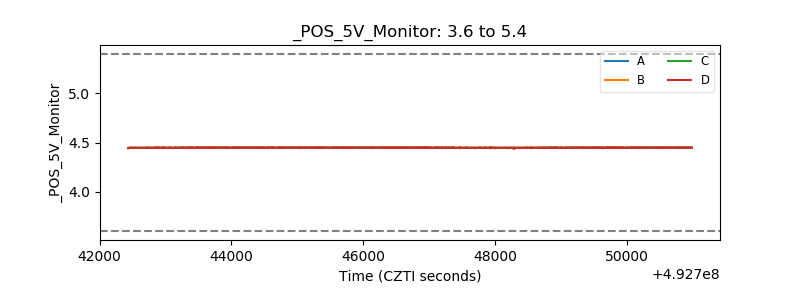 |
| _ROLL_ROT | 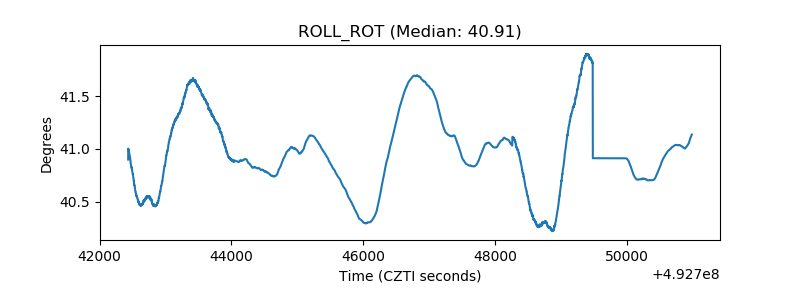 |
| _Roll_DEC | 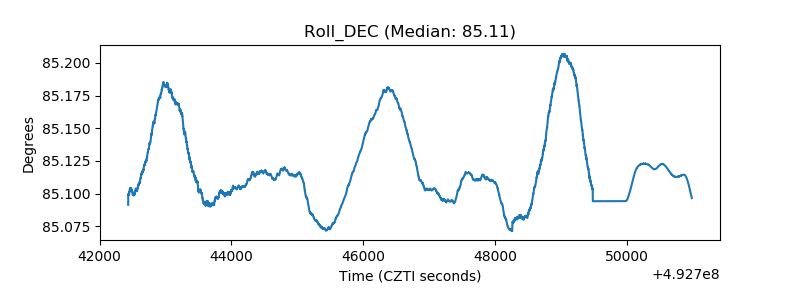 |
| _Roll_RA | 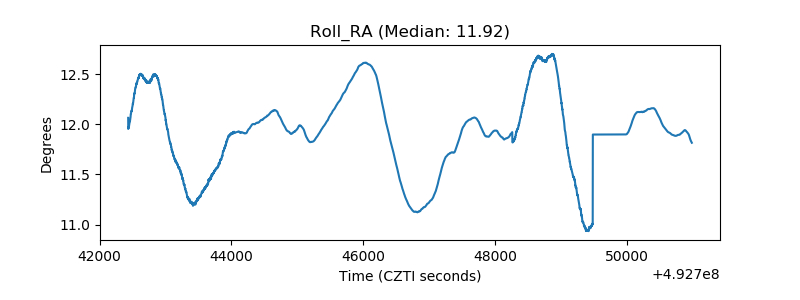 |
| Veto Counter | 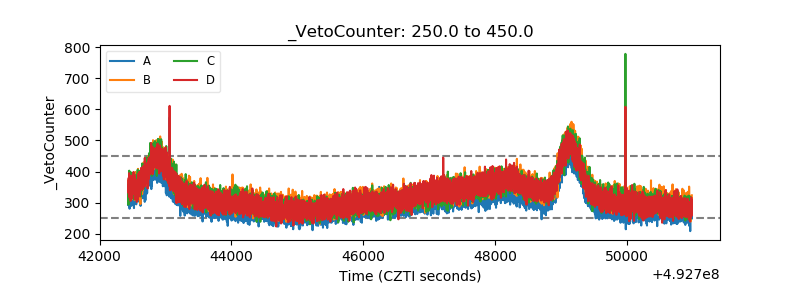 |