| Param | Original file | Final file |
|---|---|---|
| Filename | modeM0/AS1C09_011T09_9000006494_53424cztM0_level2.fits | modeM0/AS1C09_011T09_9000006494_53424cztM0_level2_quad_clean.evt |
| Size (bytes) | 647,069,760 | 85,625,280 |
| Size | 617.1 MB | 81.7 MB |
| Events in quadrant A | 3,831,312 | 606,256 |
| Events in quadrant B | 5,037,248 | 631,443 |
| Events in quadrant C | 10,791,059 | 374,354 |
| Events in quadrant D | 3,803,317 | 539,598 |
| Mode SS | |||
|---|---|---|---|
| Quadrant | BADHDUFLAG | Total packets | Discarded packets |
| A | 0 | 128 | 0 |
| B | 0 | 128 | 0 |
| C | 0 | 128 | 0 |
| D | 0 | 128 | 0 |
| Mode M0 | |||
|---|---|---|---|
| Quadrant | BADHDUFLAG | Total packets | Discarded packets |
| A | 0 | 15728 | 1 |
| B | 0 | 19384 | 1 |
| C | 0 | 36471 | 1 |
| D | 0 | 15758 | 1 |
| Mode M9 | |||
|---|---|---|---|
| Quadrant | BADHDUFLAG | Total packets | Discarded packets |
| A | 0 | 10 | 0 |
| B | 0 | 10 | 0 |
| C | 0 | 10 | 0 |
| D | 0 | 10 | 0 |
| Quadrant | Total seconds | Saturated seconds | Saturation percentage |
|---|---|---|---|
| A | 6314 | 200 | 3.167564% |
| B | 6314 | 447 | 7.079506% |
| C | 6314 | 2560 | 40.544821% |
| D | 6314 | 214 | 3.389294% |
Noise dominated data is calculated using 1-second bins in cleaned event files. If a bin has >2000 counts, and if more than 50% of those come from <1% of pixels, then it is considered to be noise-dominated and hence unusable.
| Quadrant | # 1 sec bins | Bins with >0 counts | Bins with >2000 counts | High rate bins dominated by noise | Noise dominated (total time) | Noise dominated (detector-on time) | Marked lightcurve |
|---|---|---|---|---|---|---|---|
| A | 7324 | 6314 | 154 | 154 | 2.10% | 2.44% | 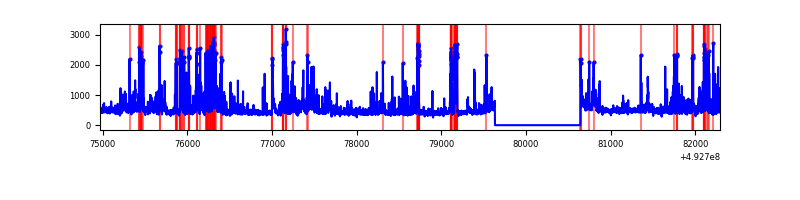 |
| B | 7324 | 6314 | 267 | 267 | 3.65% | 4.23% | 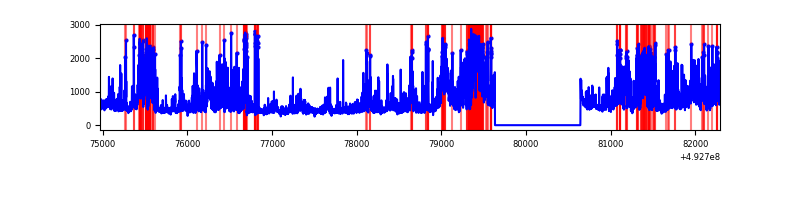 |
| C | 7323 | 6313 | 2574 | 2574 | 35.15% | 40.77% | 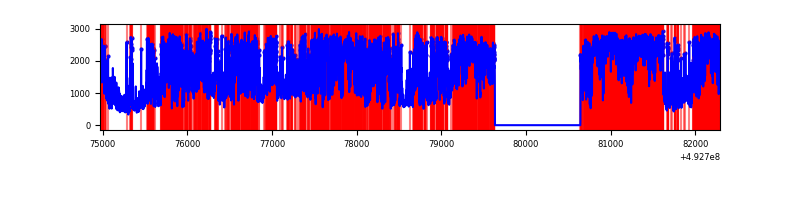 |
| D | 7324 | 6314 | 197 | 197 | 2.69% | 3.12% | 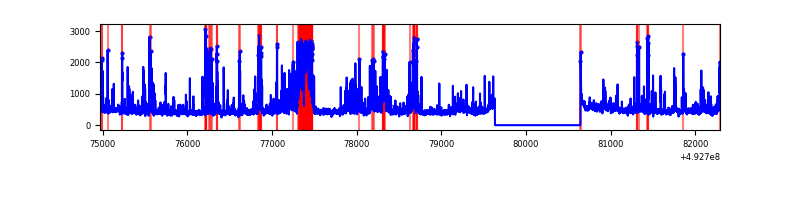 |
Top three noisy pixels from each quadrant. If the there are fewer than three noisy pixels in the level2.evt file, extra rows are filled as -1
| Pixel properties | Quadrant properties | ||||||
|---|---|---|---|---|---|---|---|
| Quadrant | DetID | PixID | Counts | Sigma | Mean | Median | Sigma |
| A | 15 | 174 | 374468 | 2249.73 | 666 | 648 | 166.2 |
| A | 4 | 249 | 179534 | 1076.58 | 666 | 648 | 166.2 |
| A | 0 | 8 | 128284 | 768.14 | 666 | 648 | 166.2 |
| B | 4 | 206 | 1247880 | 8998.43 | 650 | 626 | 138.6 |
| B | 4 | 171 | 295753 | 2129.22 | 650 | 626 | 138.6 |
| B | 0 | 171 | 269356 | 1938.78 | 650 | 626 | 138.6 |
| C | 9 | 38 | 4439637 | 30003.67 | 543 | 537 | 148.0 |
| C | 15 | 224 | 3039277 | 20538.7 | 543 | 537 | 148.0 |
| C | 15 | 178 | 272612 | 1838.94 | 543 | 537 | 148.0 |
| D | 12 | 1 | 711983 | 3900.77 | 643 | 615 | 182.4 |
| D | 2 | 153 | 206763 | 1130.41 | 643 | 615 | 182.4 |
| D | 2 | 249 | 66393 | 360.69 | 643 | 615 | 182.4 |
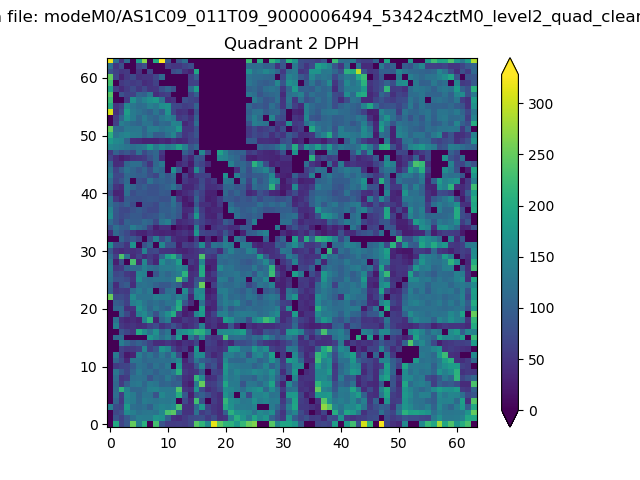
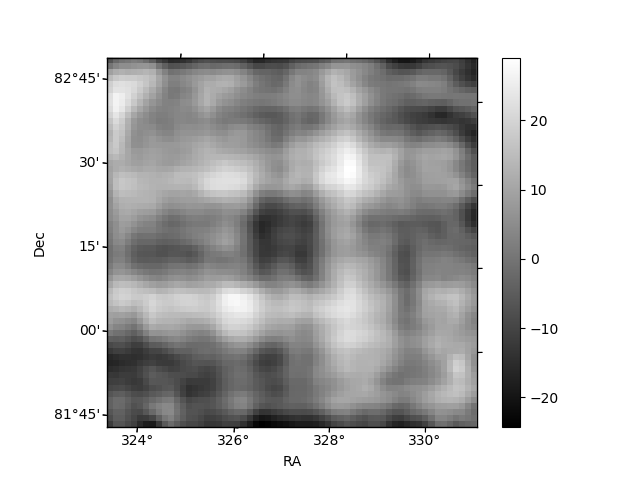
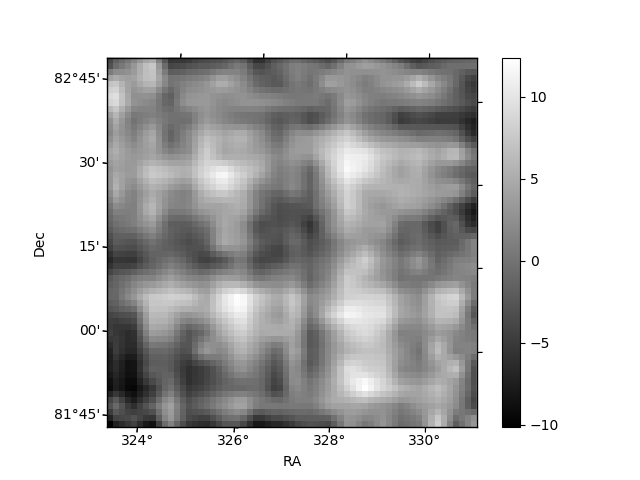
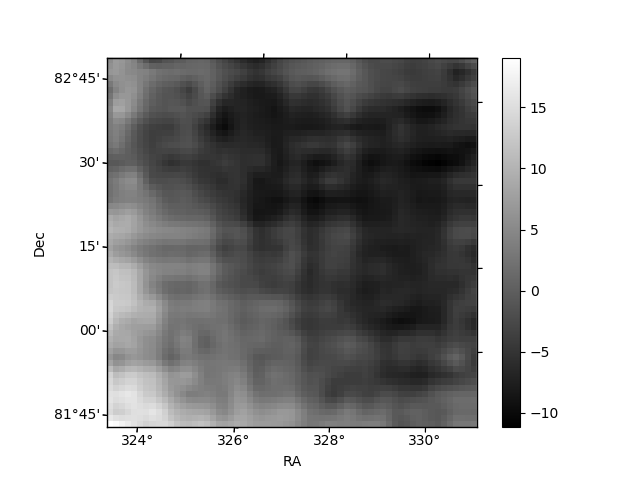
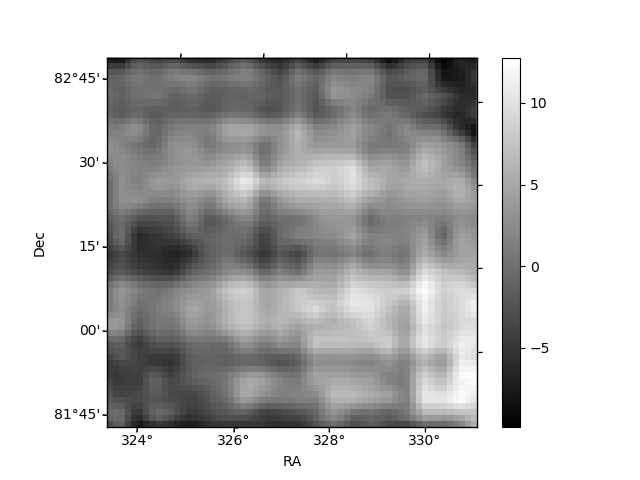
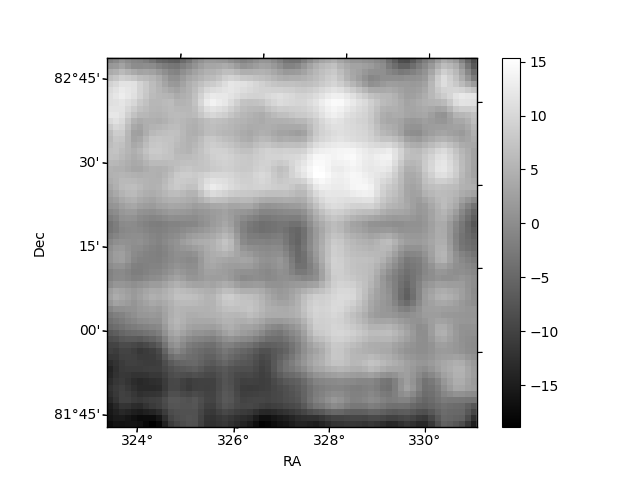
Histogram calculated using DETX and DETY for each event in the final _common_clean file
| Quadrant A | 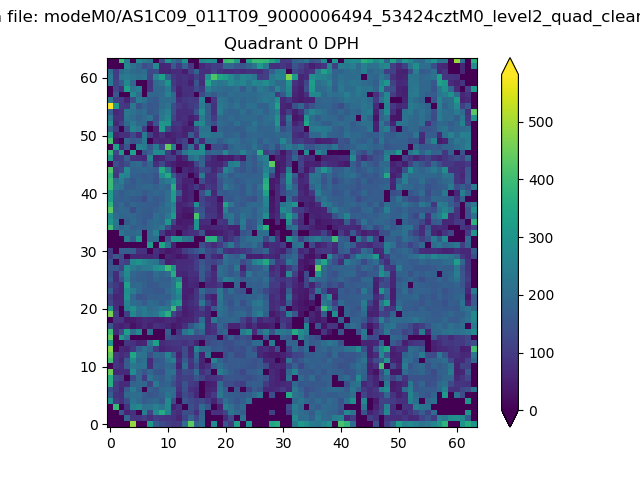 |
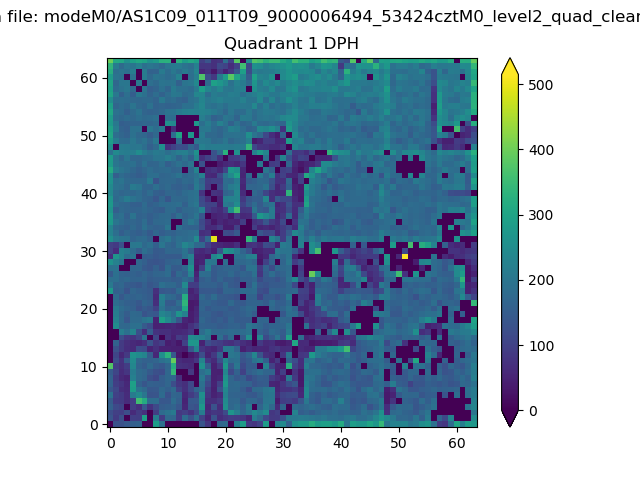 |
Quadrant B |
|---|---|---|---|
| Quadrant D | 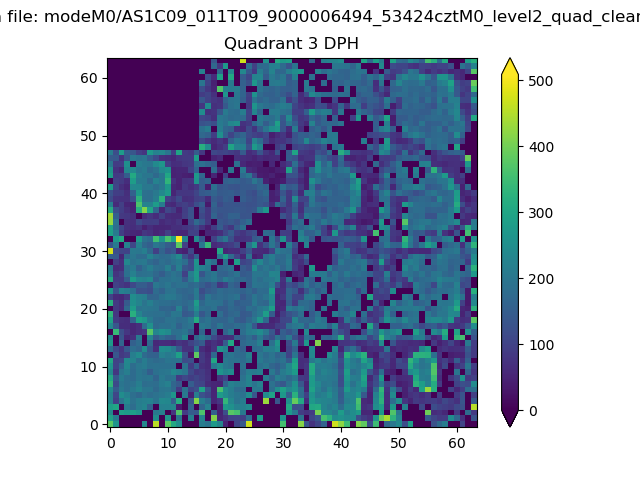 |
 |
Quadrant C |
| Plot type | Count rate plots | Images |
|---|---|---|
| Comparison with Poisson distribution Blue bars denote a histogram of data divided into 1 sec bins. Red curve is a Poisson curve with rate = median count rate of data. |
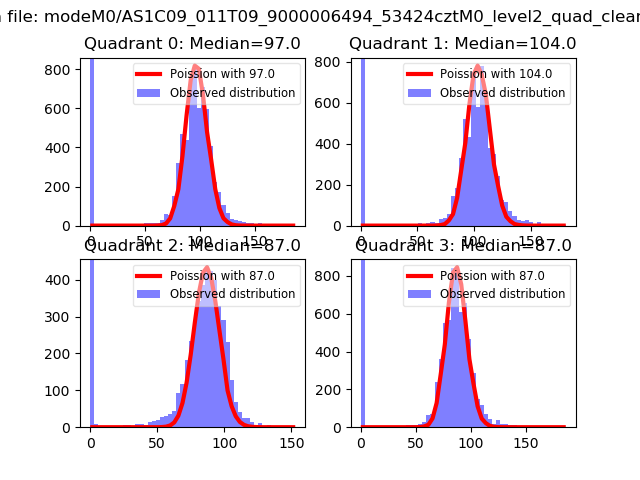 |
 |
| Quadrant-wise count rates Data is divided into 100 sec bins |
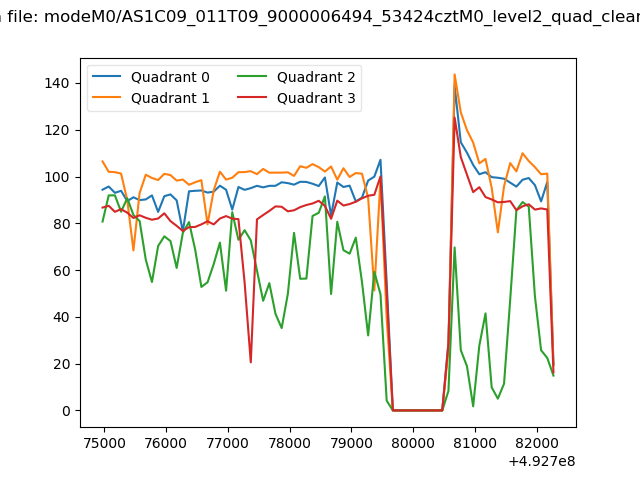 |
|
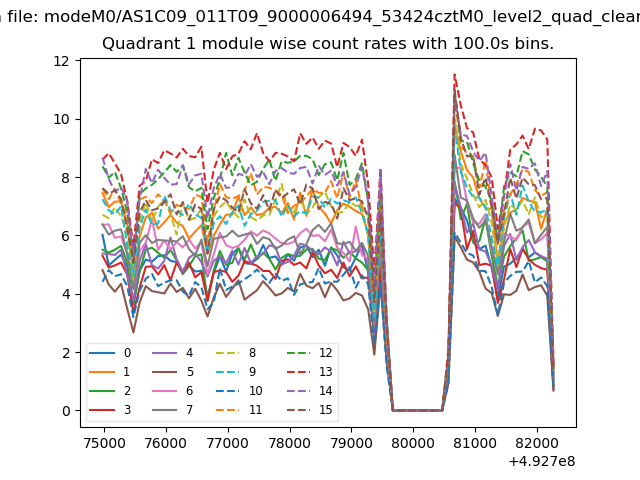
| Module-wise count rates for Quadrant A Data is divided into 100 sec bins |
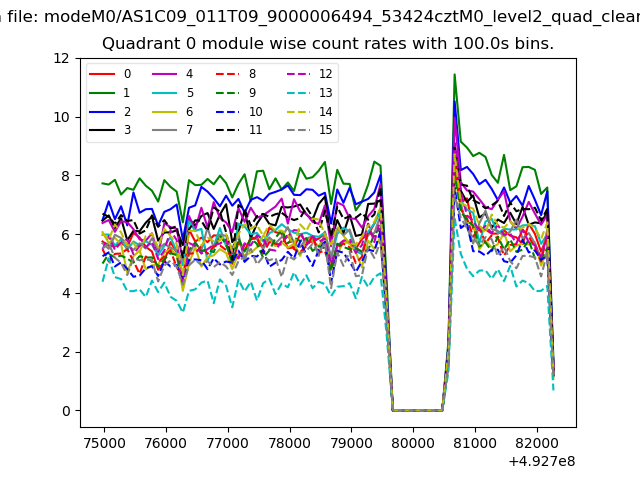 |
 |
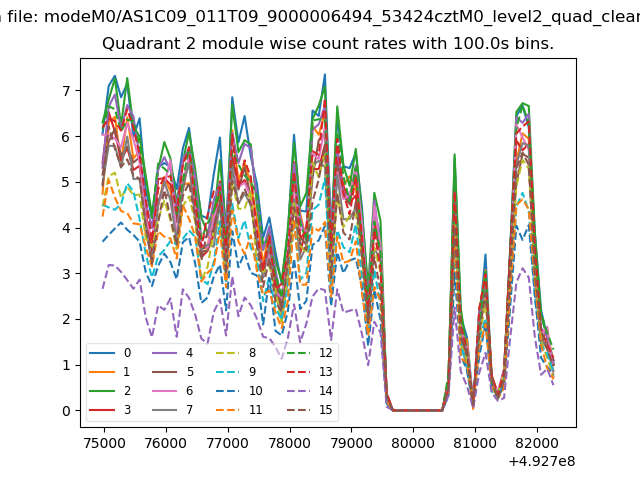
| Module-wise count rates for Quadrant B Data is divided into 100 sec bins |
 |
 |
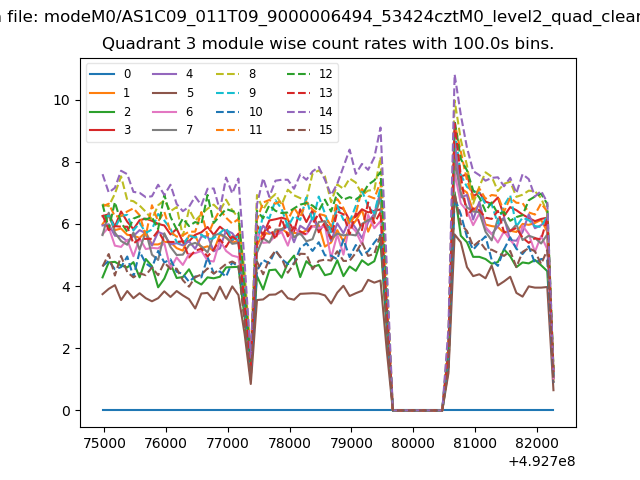
| Module-wise count rates for Quadrant C Data is divided into 100 sec bins |
 |
 |
| Module-wise count rates for Quadrant D Data is divided into 100 sec bins |
 |
 |
| Parameter | Plot |
|---|---|
| CZT HV Monitor | 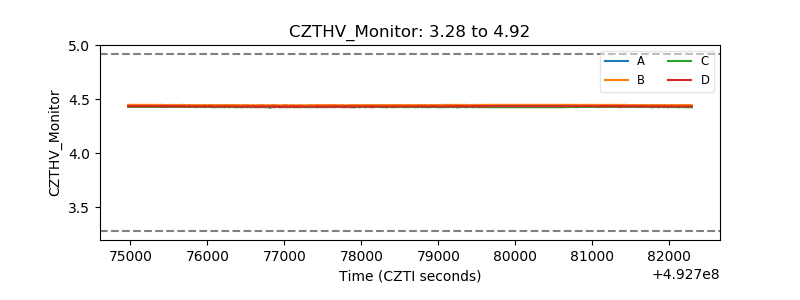 |
| D_VDD | 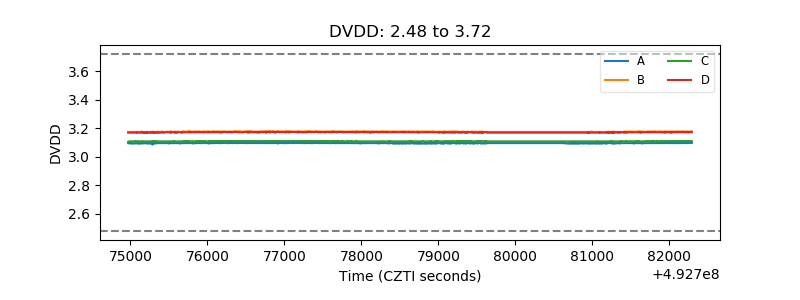 |
| Temperature 1 | 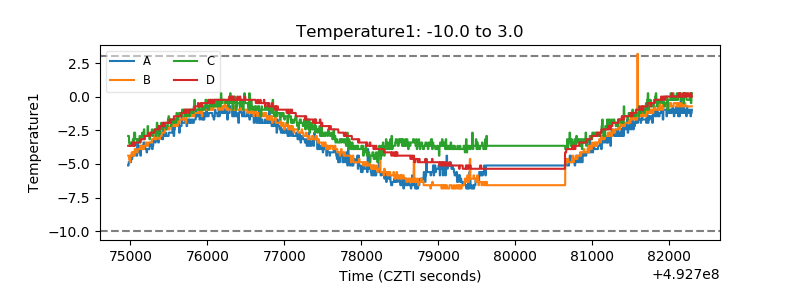 |
| Veto HV Monitor | 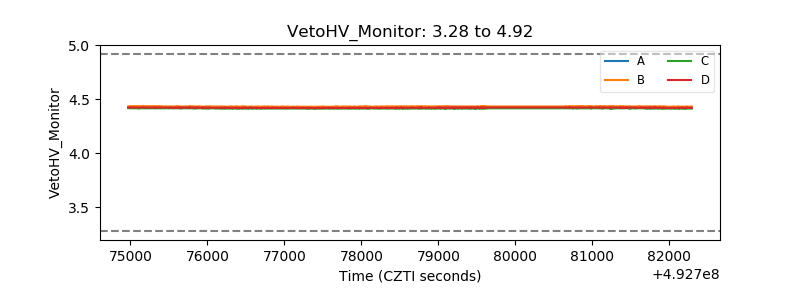 |
| Veto LLD |  |
| Alpha Counter | 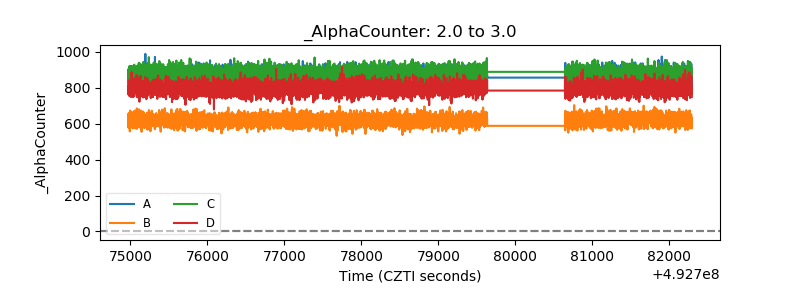 |
| _CPM_Rate | 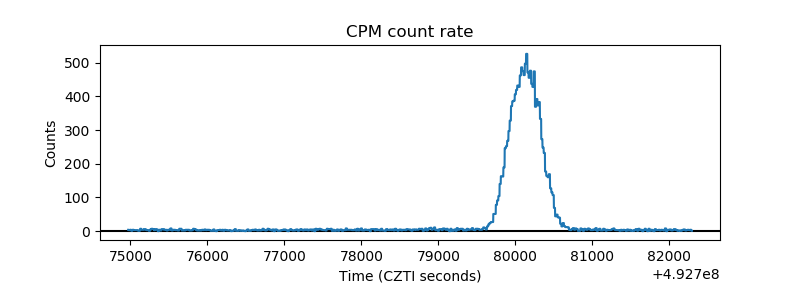 |
| CZT Counter | 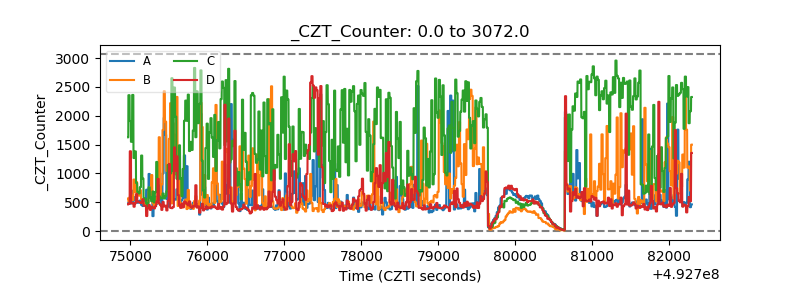 |
| +2.5 Volts monitor |  |
| +5 Volts monitor |  |
| _ROLL_ROT | 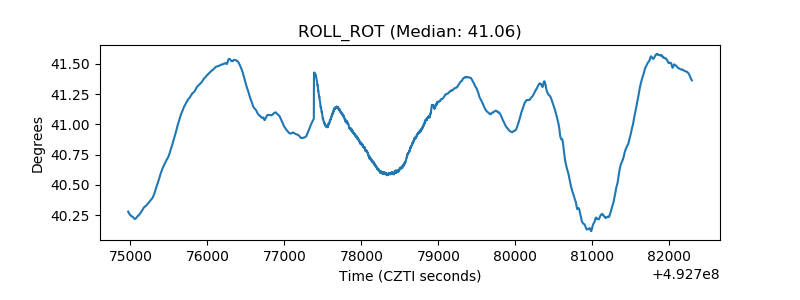 |
| _Roll_DEC | 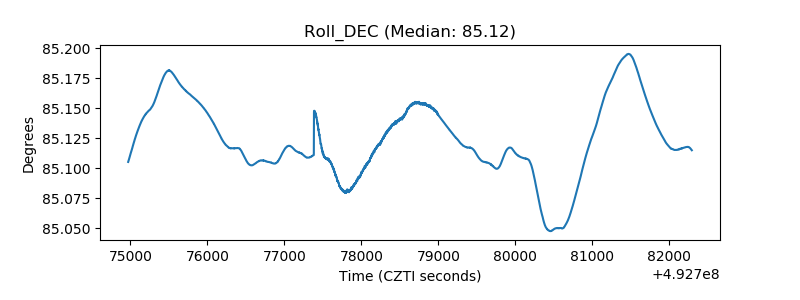 |
| _Roll_RA | 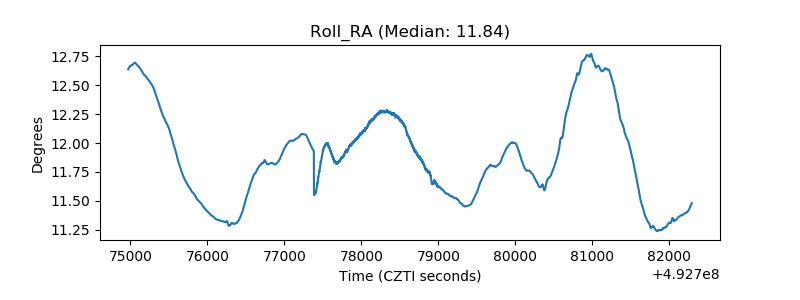 |
| Veto Counter | 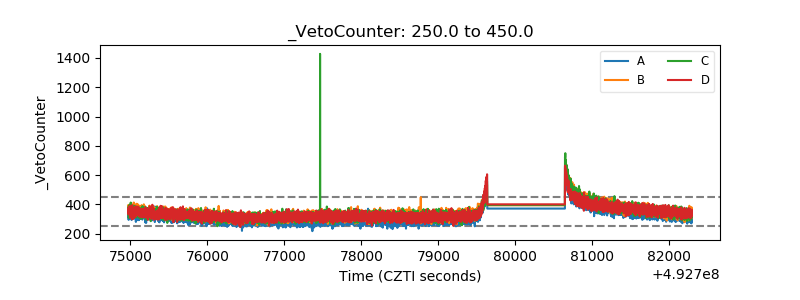 |