| Param | Original file | Final file |
|---|---|---|
| Filename | modeM0/AS1C09_011T09_9000006494_53425cztM0_level2.fits | modeM0/AS1C09_011T09_9000006494_53425cztM0_level2_quad_clean.evt |
| Size (bytes) | 729,028,800 | 76,155,840 |
| Size | 695.3 MB | 72.6 MB |
| Events in quadrant A | 3,768,569 | 581,181 |
| Events in quadrant B | 6,620,294 | 531,085 |
| Events in quadrant C | 12,561,285 | 248,830 |
| Events in quadrant D | 3,573,503 | 527,319 |
| Mode SS | |||
|---|---|---|---|
| Quadrant | BADHDUFLAG | Total packets | Discarded packets |
| A | 0 | 122 | 0 |
| B | 0 | 122 | 0 |
| C | 0 | 122 | 0 |
| D | 0 | 122 | 0 |
| Mode M0 | |||
|---|---|---|---|
| Quadrant | BADHDUFLAG | Total packets | Discarded packets |
| A | 0 | 15297 | 1 |
| B | 0 | 23864 | 13 |
| C | 0 | 41384 | 7 |
| D | 0 | 14748 | 1 |
| Mode M9 | |||
|---|---|---|---|
| Quadrant | BADHDUFLAG | Total packets | Discarded packets |
| A | 0 | 11 | 0 |
| B | 0 | 11 | 0 |
| C | 0 | 11 | 0 |
| D | 0 | 11 | 0 |
| Quadrant | Total seconds | Saturated seconds | Saturation percentage |
|---|---|---|---|
| A | 5971 | 260 | 4.354380% |
| B | 5969 | 1228 | 20.572960% |
| C | 5971 | 3683 | 61.681460% |
| D | 5971 | 158 | 2.646123% |
Noise dominated data is calculated using 1-second bins in cleaned event files. If a bin has >2000 counts, and if more than 50% of those come from <1% of pixels, then it is considered to be noise-dominated and hence unusable.
| Quadrant | # 1 sec bins | Bins with >0 counts | Bins with >2000 counts | High rate bins dominated by noise | Noise dominated (total time) | Noise dominated (detector-on time) | Marked lightcurve |
|---|---|---|---|---|---|---|---|
| A | 7056 | 5971 | 194 | 194 | 2.75% | 3.25% |  |
| B | 7055 | 5968 | 807 | 807 | 11.44% | 13.52% | 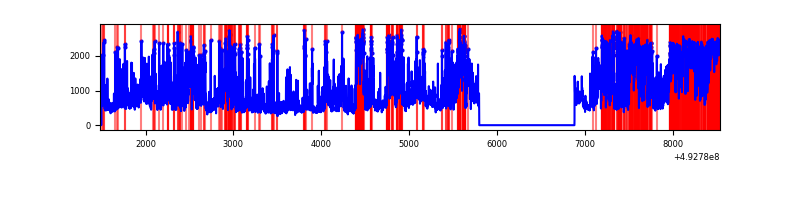 |
| C | 7055 | 5970 | 3686 | 3686 | 52.25% | 61.74% | 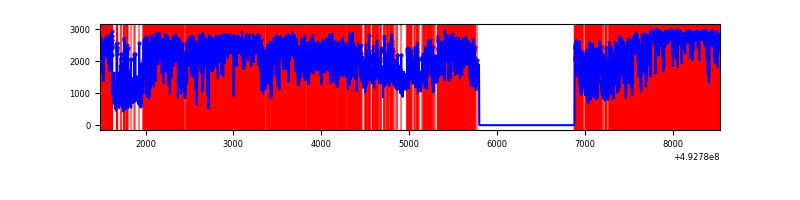 |
| D | 7056 | 5971 | 132 | 132 | 1.87% | 2.21% | 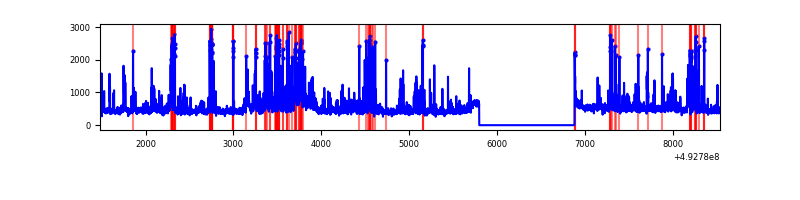 |
Top three noisy pixels from each quadrant. If the there are fewer than three noisy pixels in the level2.evt file, extra rows are filled as -1
| Pixel properties | Quadrant properties | ||||||
|---|---|---|---|---|---|---|---|
| Quadrant | DetID | PixID | Counts | Sigma | Mean | Median | Sigma |
| A | 15 | 174 | 622794 | 3929.42 | 632 | 614 | 158.3 |
| A | 3 | 63 | 190569 | 1199.67 | 632 | 614 | 158.3 |
| A | 3 | 62 | 151781 | 954.7 | 632 | 614 | 158.3 |
| B | 4 | 171 | 1467095 | 11693.14 | 588 | 568 | 125.4 |
| B | 4 | 206 | 1351128 | 10768.5 | 588 | 568 | 125.4 |
| B | 0 | 171 | 577596 | 4600.85 | 588 | 568 | 125.4 |
| C | 9 | 38 | 5244610 | 44194.91 | 429 | 425 | 118.7 |
| C | 1 | 241 | 2051308 | 17283.64 | 429 | 425 | 118.7 |
| C | 15 | 224 | 2040802 | 17195.1 | 429 | 425 | 118.7 |
| D | 3 | 12 | 255817 | 1438.28 | 618 | 590 | 177.5 |
| D | 2 | 153 | 174620 | 980.71 | 618 | 590 | 177.5 |
| D | 12 | 1 | 120546 | 675.99 | 618 | 590 | 177.5 |
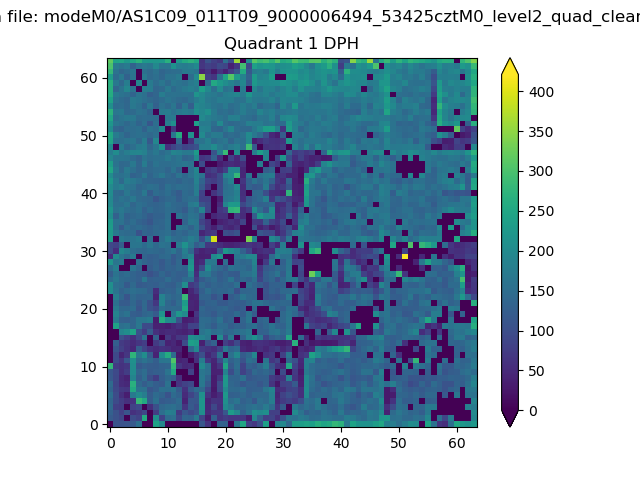
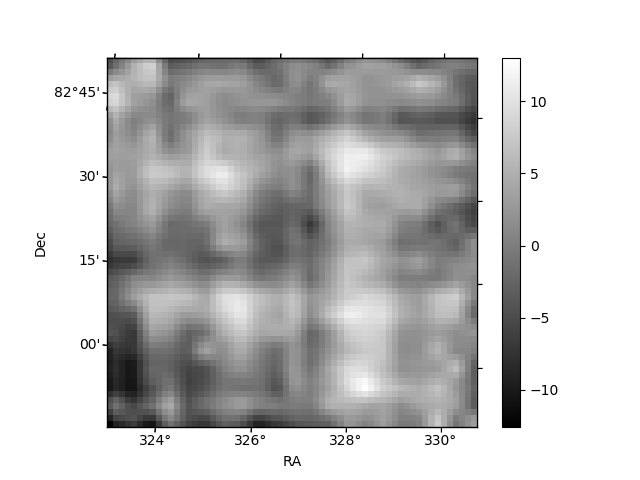
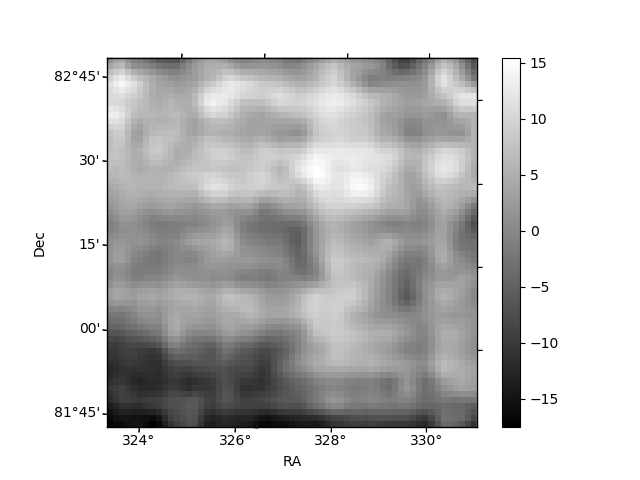
Histogram calculated using DETX and DETY for each event in the final _common_clean file
| Quadrant A | 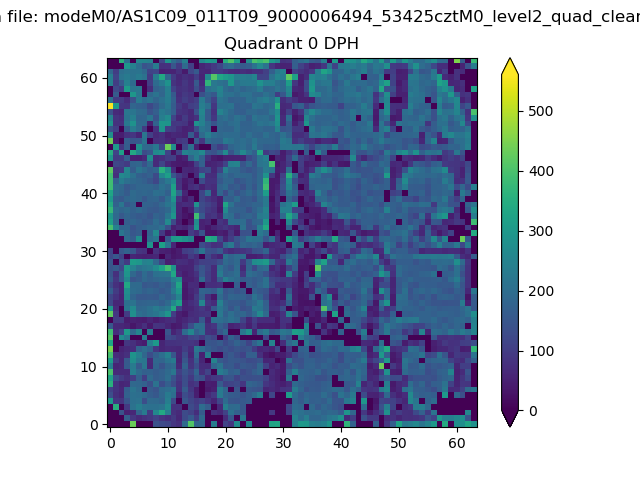 |
 |
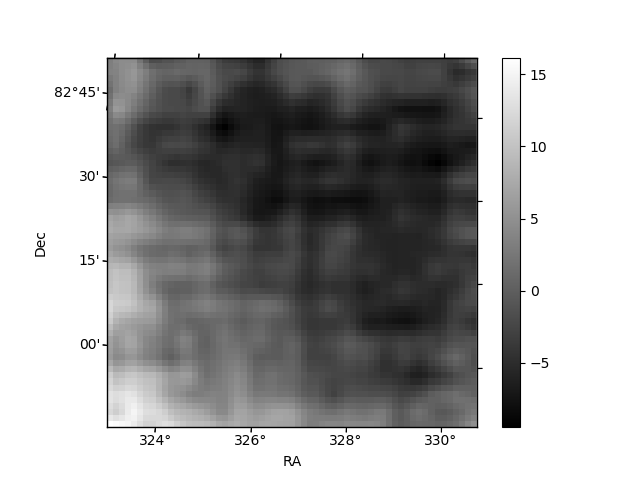
Quadrant B |
|---|---|---|---|
| Quadrant D | 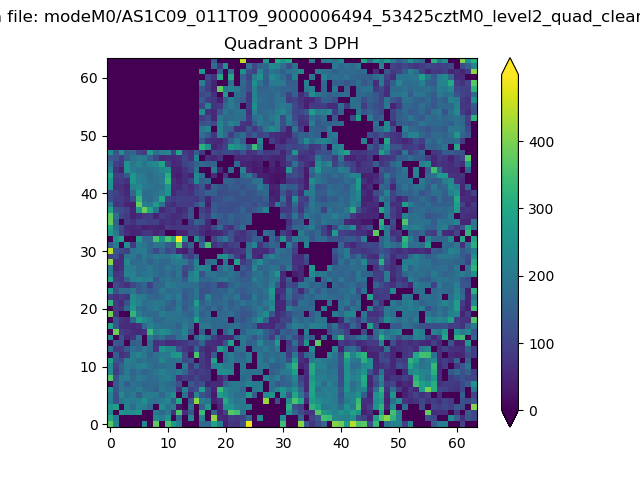 |
 |
Quadrant C |
| Plot type | Count rate plots | Images |
|---|---|---|
| Comparison with Poisson distribution Blue bars denote a histogram of data divided into 1 sec bins. Red curve is a Poisson curve with rate = median count rate of data. |
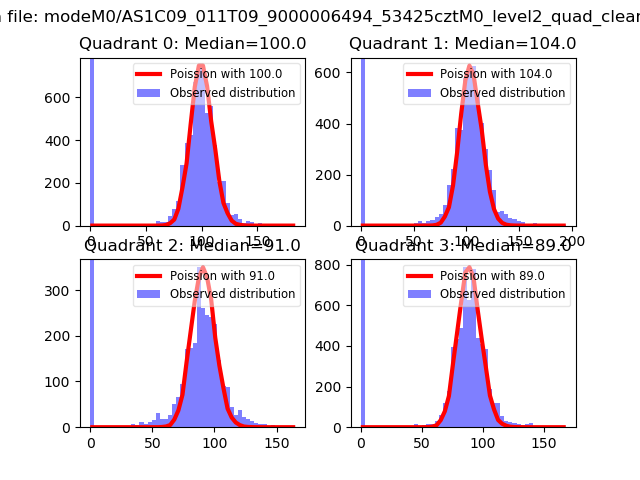 |
 |
| Quadrant-wise count rates Data is divided into 100 sec bins |
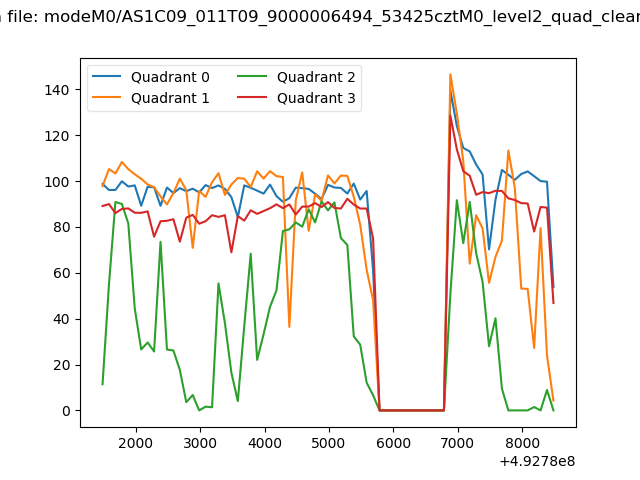 |
|
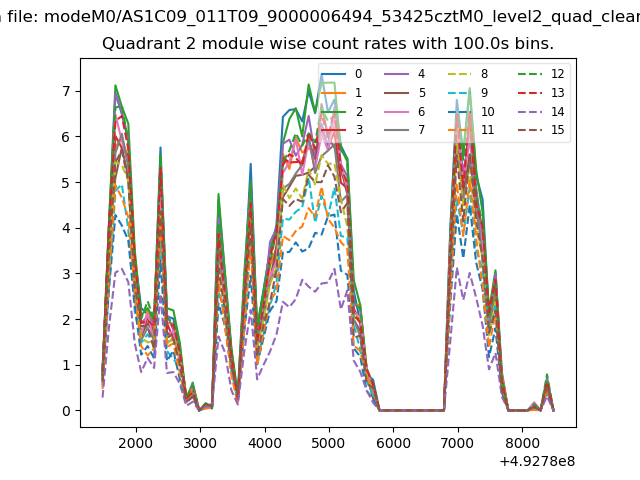
| Module-wise count rates for Quadrant A Data is divided into 100 sec bins |
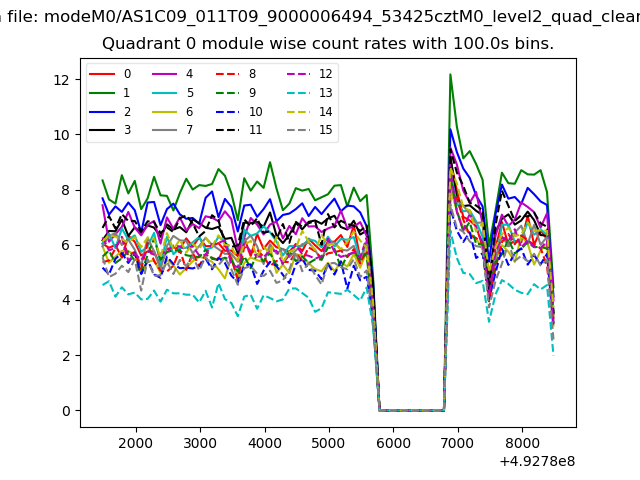 |
 |
| Module-wise count rates for Quadrant B Data is divided into 100 sec bins |
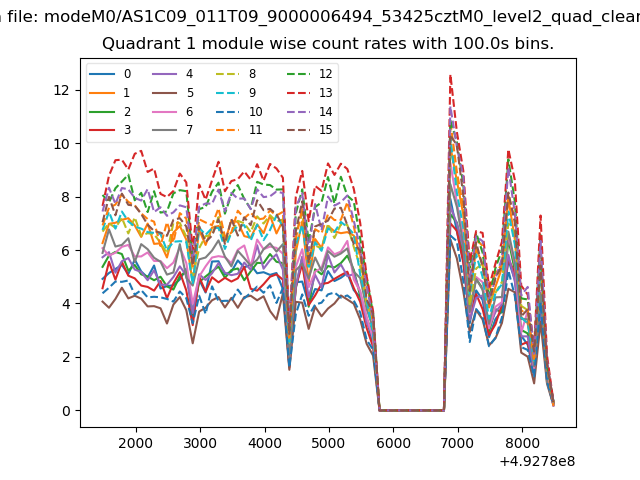 |
 |
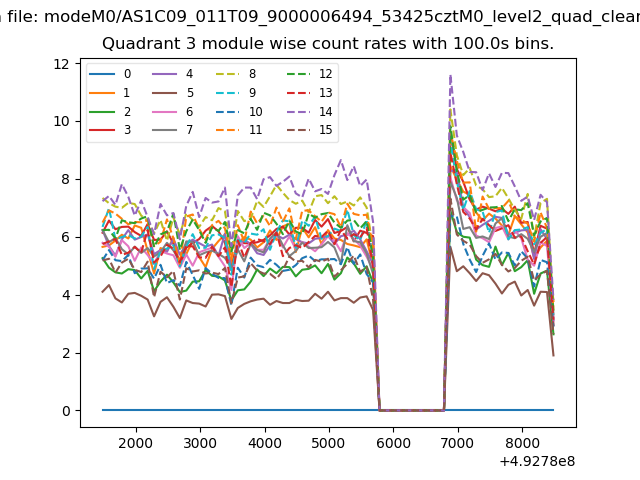
| Module-wise count rates for Quadrant C Data is divided into 100 sec bins |
 |
 |
| Module-wise count rates for Quadrant D Data is divided into 100 sec bins |
 |
 |
| Parameter | Plot |
|---|---|
| CZT HV Monitor |  |
| D_VDD | 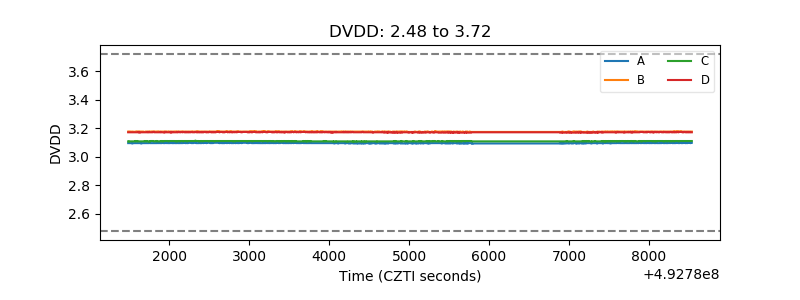 |
| Temperature 1 | 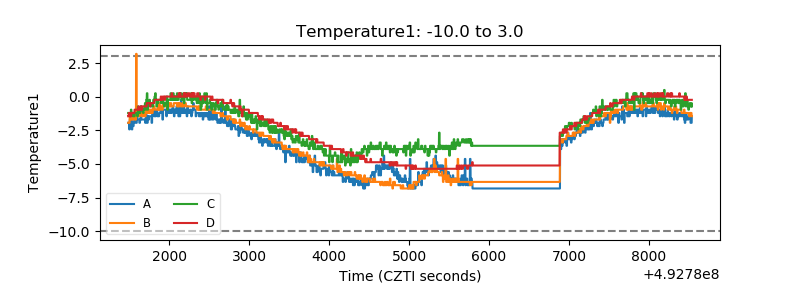 |
| Veto HV Monitor | 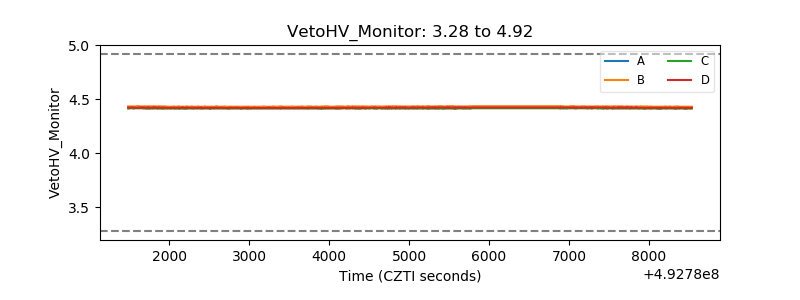 |
| Veto LLD | 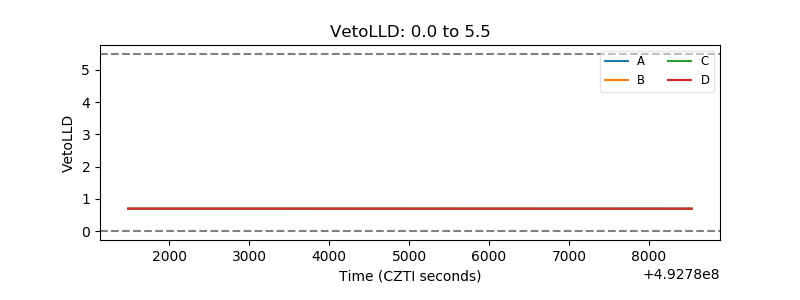 |
| Alpha Counter |  |
| _CPM_Rate | 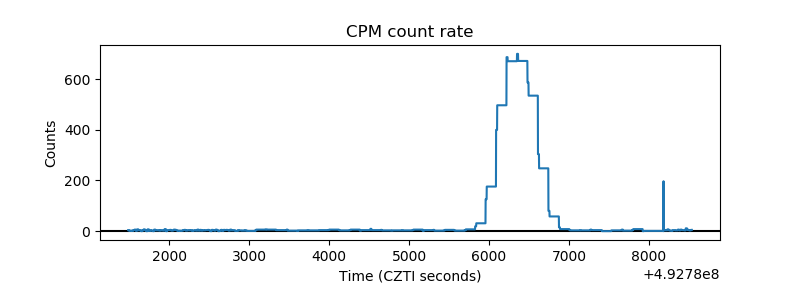 |
| CZT Counter | 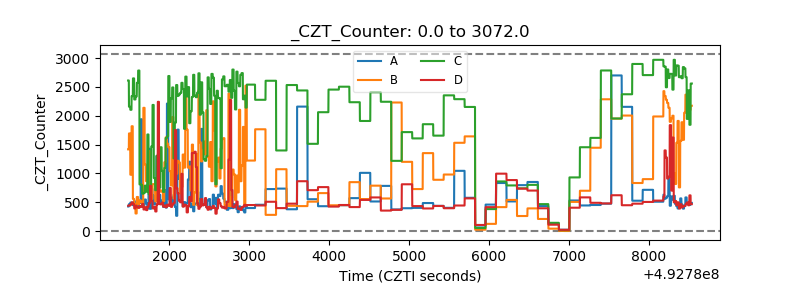 |
| +2.5 Volts monitor | 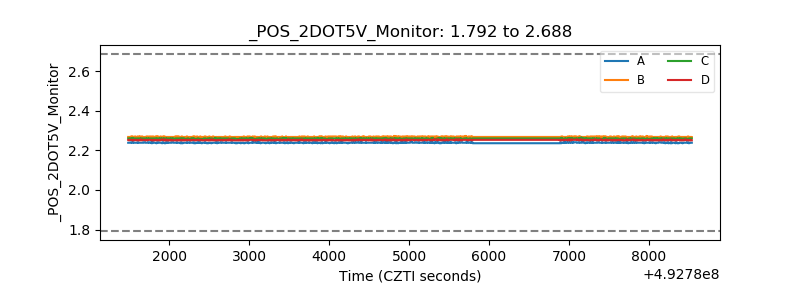 |
| +5 Volts monitor |  |
| _ROLL_ROT | 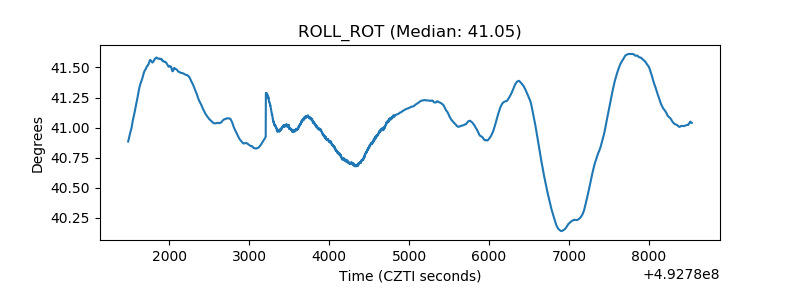 |
| _Roll_DEC | 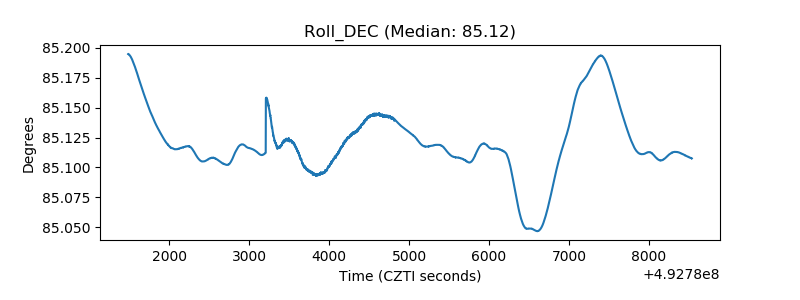 |
| _Roll_RA | 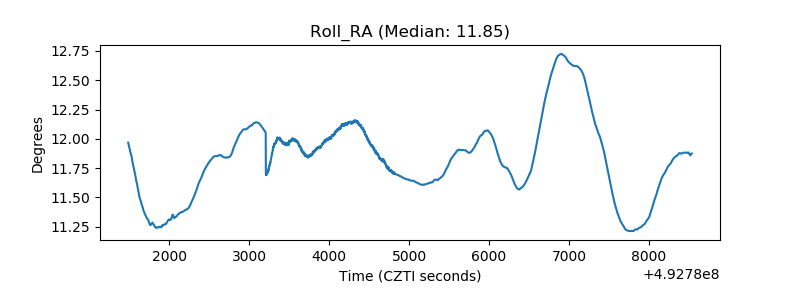 |
| Veto Counter | 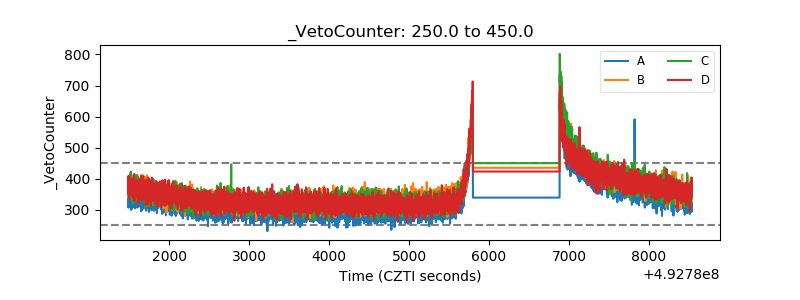 |