| Param | Original file | Final file |
|---|---|---|
| Filename | modeM0/AS1C09_011T09_9000006494_53427cztM0_level2.fits | modeM0/AS1C09_011T09_9000006494_53427cztM0_level2_quad_clean.evt |
| Size (bytes) | 739,359,360 | 75,968,640 |
| Size | 705.1 MB | 72.4 MB |
| Events in quadrant A | 3,941,393 | 571,654 |
| Events in quadrant B | 5,852,827 | 545,539 |
| Events in quadrant C | 11,133,896 | 335,043 |
| Events in quadrant D | 5,985,467 | 436,921 |
| Mode SS | |||
|---|---|---|---|
| Quadrant | BADHDUFLAG | Total packets | Discarded packets |
| A | 0 | 118 | 0 |
| B | 0 | 118 | 0 |
| C | 0 | 118 | 0 |
| D | 0 | 118 | 0 |
| Mode M0 | |||
|---|---|---|---|
| Quadrant | BADHDUFLAG | Total packets | Discarded packets |
| A | 0 | 15758 | 1 |
| B | 0 | 21493 | 1 |
| C | 0 | 37123 | 4 |
| D | 0 | 21895 | 1 |
| Mode M9 | |||
|---|---|---|---|
| Quadrant | BADHDUFLAG | Total packets | Discarded packets |
| A | 0 | 12 | 0 |
| B | 0 | 12 | 0 |
| C | 0 | 12 | 0 |
| D | 0 | 12 | 0 |
| Quadrant | Total seconds | Saturated seconds | Saturation percentage |
|---|---|---|---|
| A | 5882 | 332 | 5.644339% |
| B | 5883 | 1014 | 17.236104% |
| C | 5882 | 2736 | 46.514791% |
| D | 5882 | 1121 | 19.058143% |
Noise dominated data is calculated using 1-second bins in cleaned event files. If a bin has >2000 counts, and if more than 50% of those come from <1% of pixels, then it is considered to be noise-dominated and hence unusable.
| Quadrant | # 1 sec bins | Bins with >0 counts | Bins with >2000 counts | High rate bins dominated by noise | Noise dominated (total time) | Noise dominated (detector-on time) | Marked lightcurve |
|---|---|---|---|---|---|---|---|
| A | 7046 | 5882 | 210 | 210 | 2.98% | 3.57% | 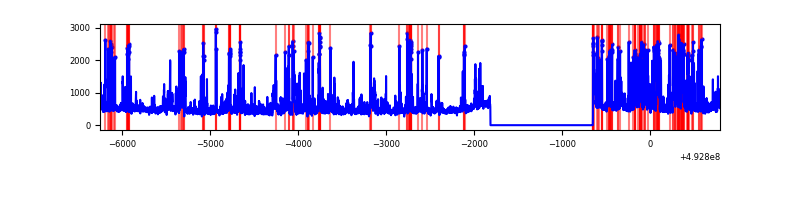 |
| B | 7047 | 5883 | 554 | 554 | 7.86% | 9.42% | 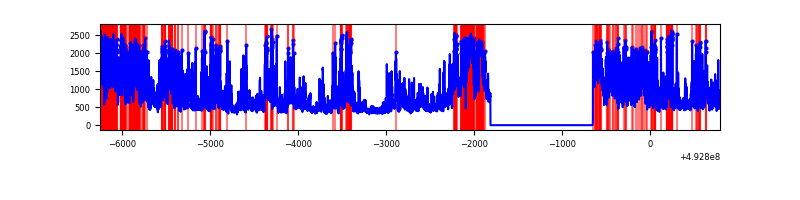 |
| C | 7046 | 5882 | 2748 | 2748 | 39.00% | 46.72% | 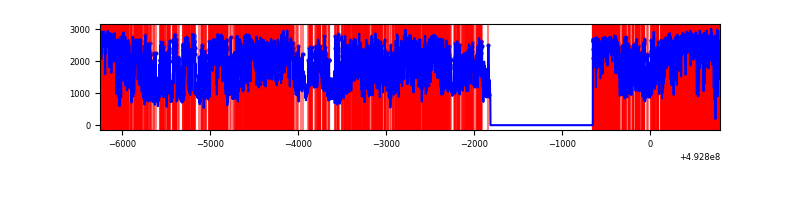 |
| D | 7046 | 5882 | 982 | 982 | 13.94% | 16.70% | 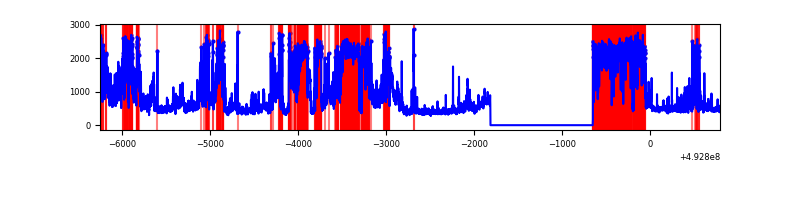 |
Top three noisy pixels from each quadrant. If the there are fewer than three noisy pixels in the level2.evt file, extra rows are filled as -1
| Pixel properties | Quadrant properties | ||||||
|---|---|---|---|---|---|---|---|
| Quadrant | DetID | PixID | Counts | Sigma | Mean | Median | Sigma |
| A | 3 | 63 | 817417 | 5262.34 | 621 | 607 | 155.2 |
| A | 15 | 174 | 336906 | 2166.62 | 621 | 607 | 155.2 |
| A | 8 | 249 | 65836 | 420.24 | 621 | 607 | 155.2 |
| B | 0 | 171 | 1237310 | 10013.71 | 585 | 566 | 123.5 |
| B | 4 | 171 | 1193317 | 9657.51 | 585 | 566 | 123.5 |
| B | 4 | 206 | 311201 | 2515.16 | 585 | 566 | 123.5 |
| C | 9 | 38 | 3339696 | 25291.27 | 482 | 477 | 132.0 |
| C | 15 | 224 | 2340005 | 17719.6 | 482 | 477 | 132.0 |
| C | 1 | 241 | 1228652 | 9302.21 | 482 | 477 | 132.0 |
| D | 2 | 120 | 1706936 | 10651.78 | 564 | 539 | 160.2 |
| D | 2 | 172 | 1021978 | 6376.09 | 564 | 539 | 160.2 |
| D | 12 | 1 | 366668 | 2285.47 | 564 | 539 | 160.2 |
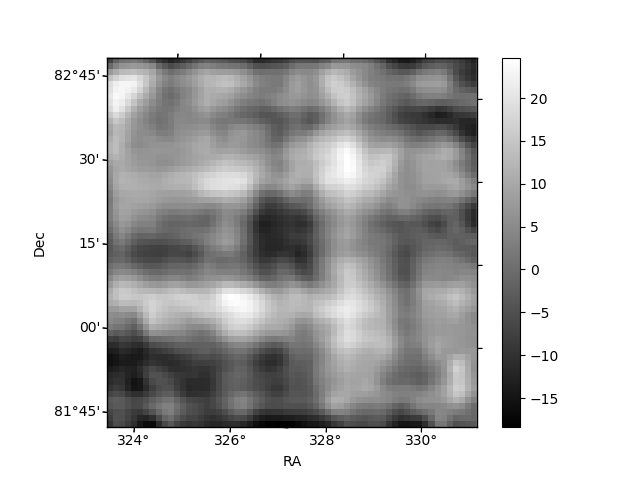
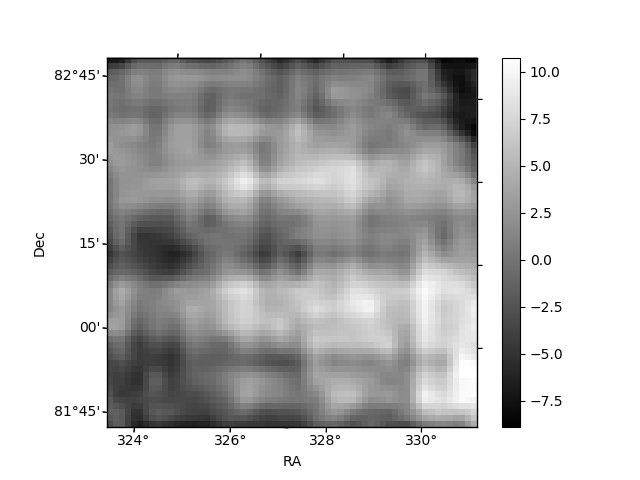
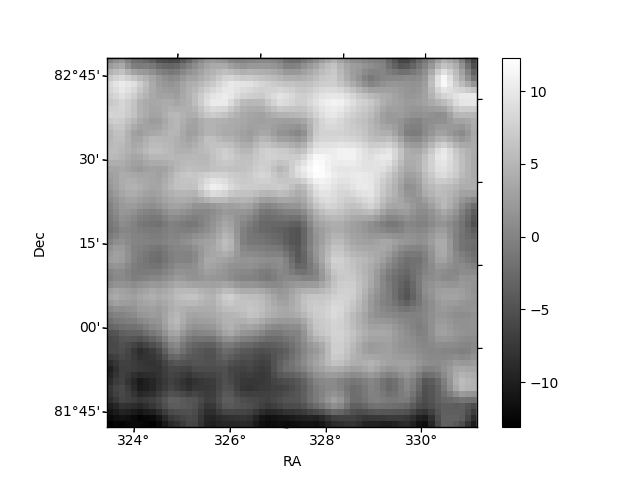
Histogram calculated using DETX and DETY for each event in the final _common_clean file
| Quadrant A | 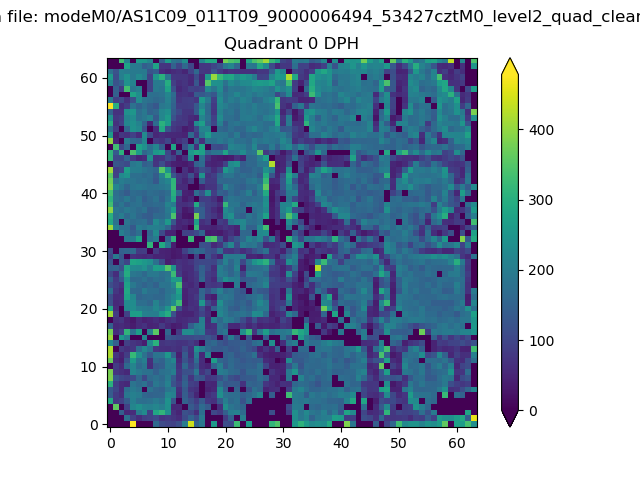 |
 |
Quadrant B |
|---|---|---|---|
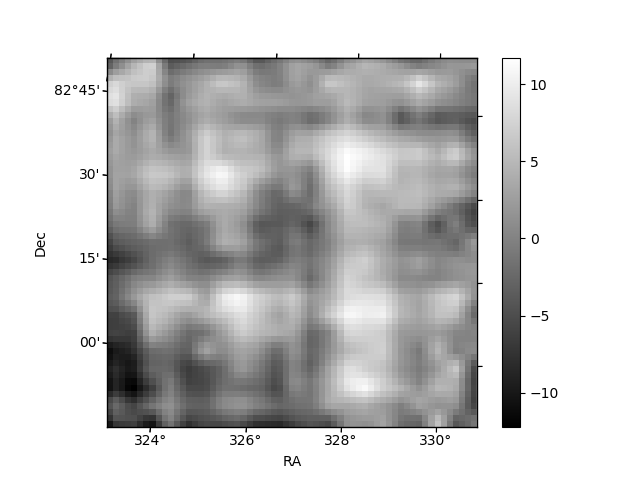
| Quadrant D | 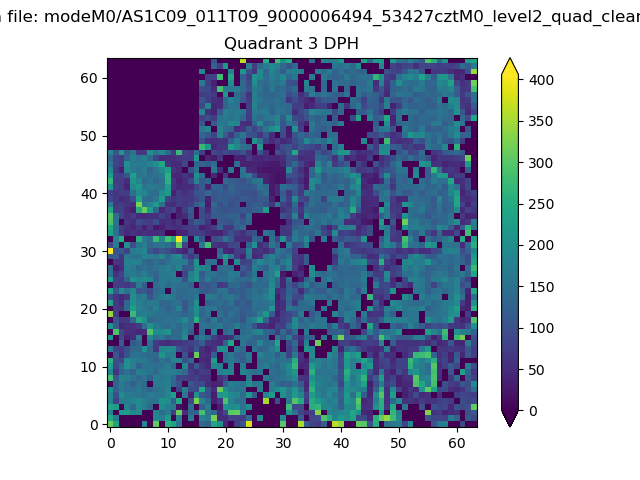 |
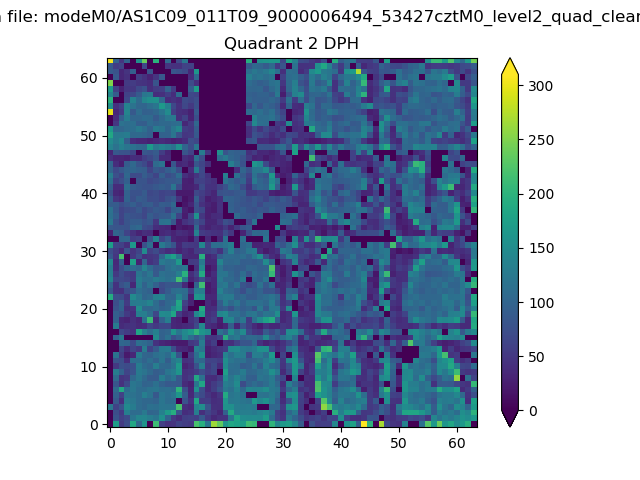 |
Quadrant C |
| Plot type | Count rate plots | Images |
|---|---|---|
| Comparison with Poisson distribution Blue bars denote a histogram of data divided into 1 sec bins. Red curve is a Poisson curve with rate = median count rate of data. |
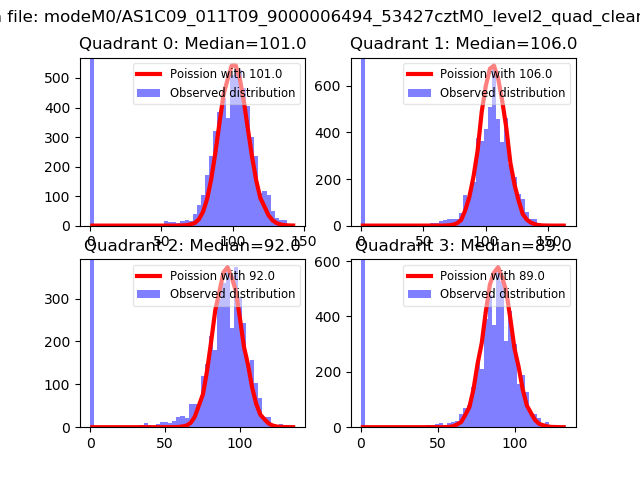 |
 |
| Quadrant-wise count rates Data is divided into 100 sec bins |
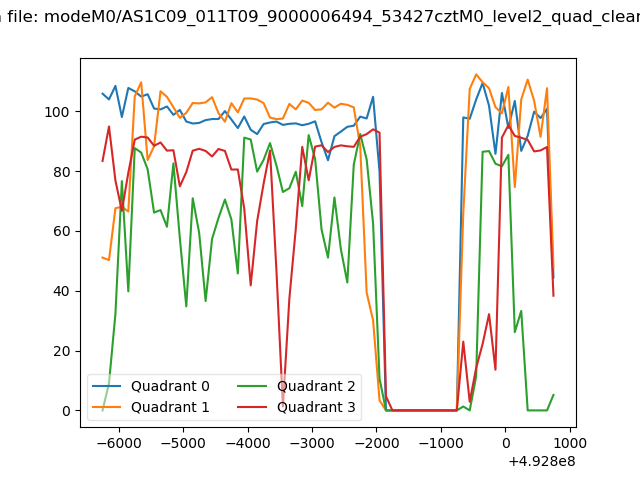 |
|
| Module-wise count rates for Quadrant A Data is divided into 100 sec bins |
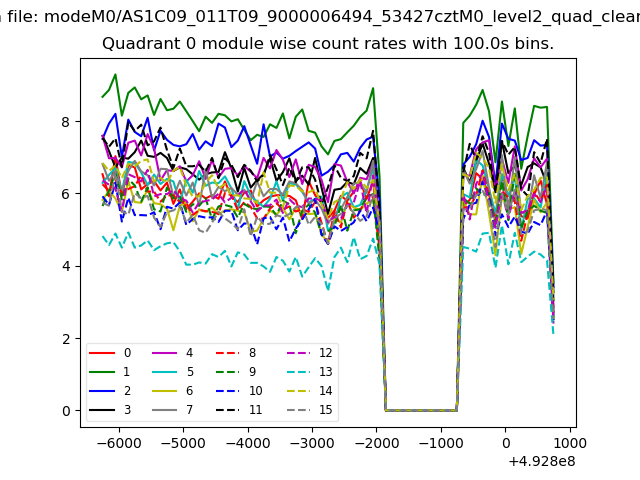 |
 |
| Module-wise count rates for Quadrant B Data is divided into 100 sec bins |
 |
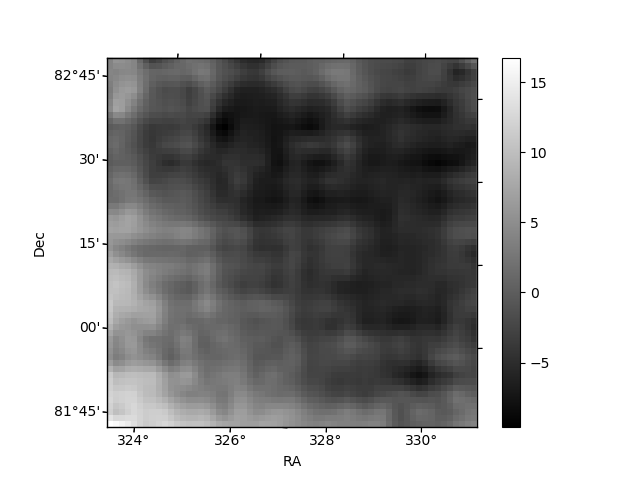 |
| Module-wise count rates for Quadrant C Data is divided into 100 sec bins |
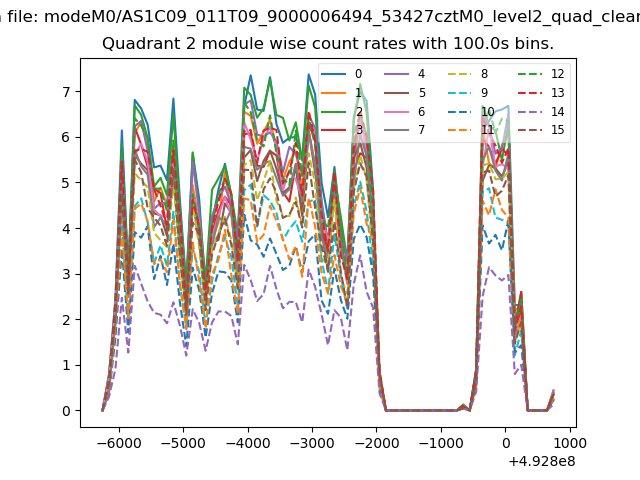 |
 |
| Module-wise count rates for Quadrant D Data is divided into 100 sec bins |
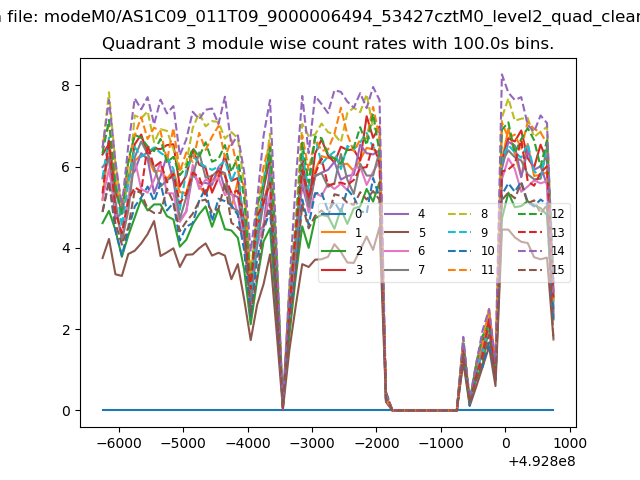 |
 |
| Parameter | Plot |
|---|---|
| CZT HV Monitor | 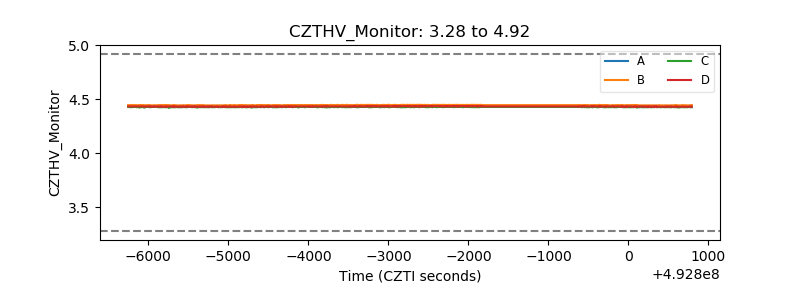 |
| D_VDD | 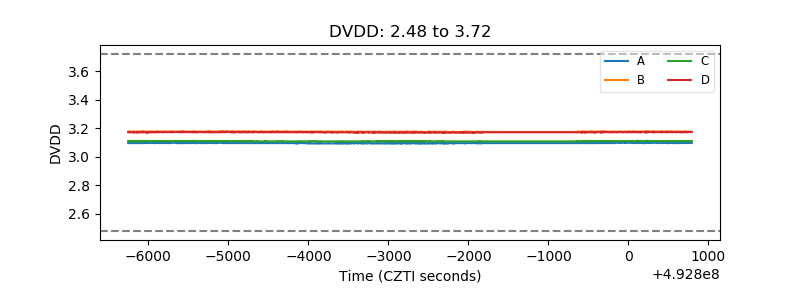 |
| Temperature 1 | 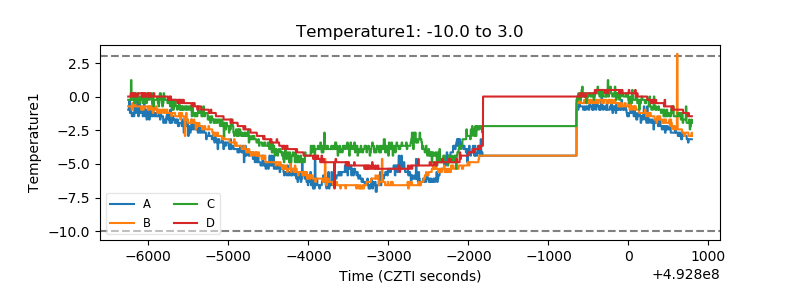 |
| Veto HV Monitor | 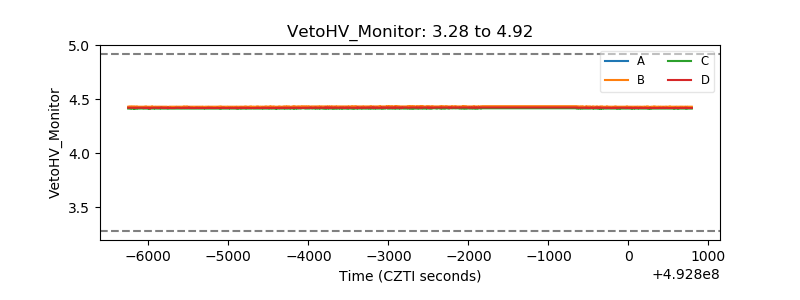 |
| Veto LLD | 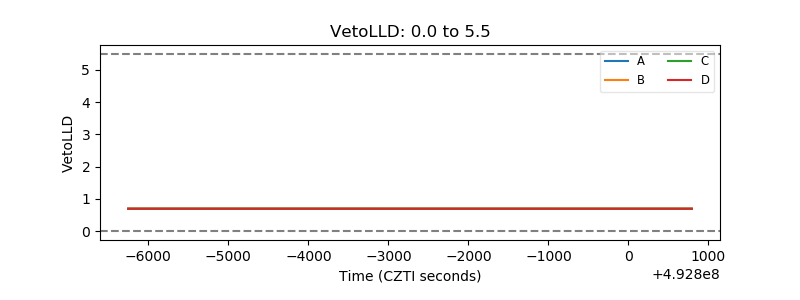 |
| Alpha Counter | 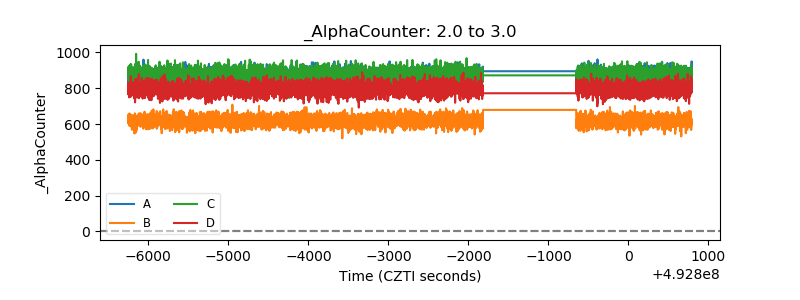 |
| _CPM_Rate | 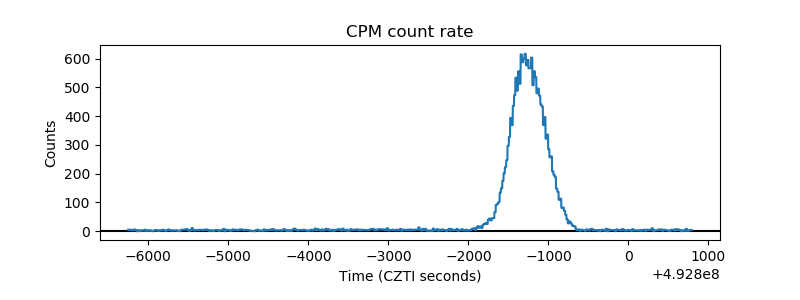 |
| CZT Counter | 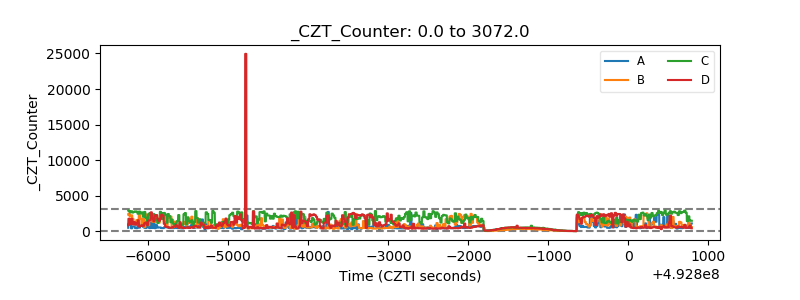 |
| +2.5 Volts monitor |  |
| +5 Volts monitor | 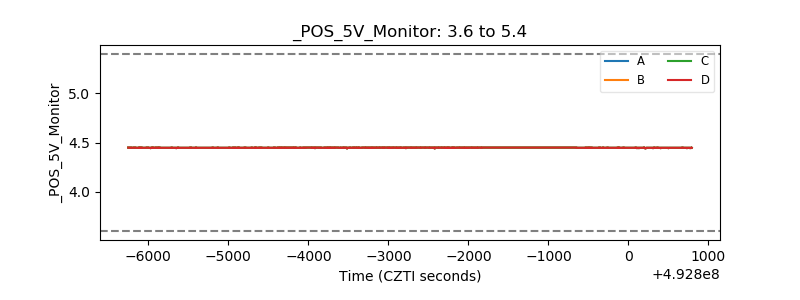 |
| _ROLL_ROT | 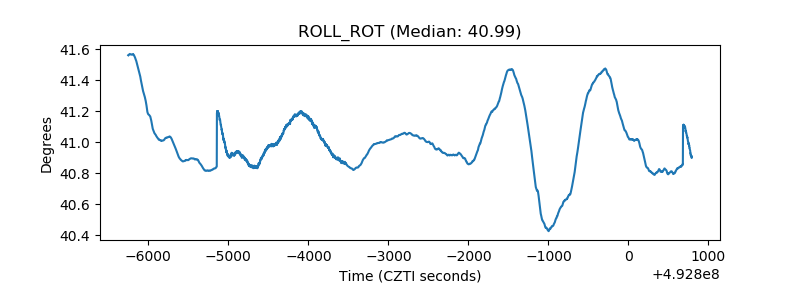 |
| _Roll_DEC | 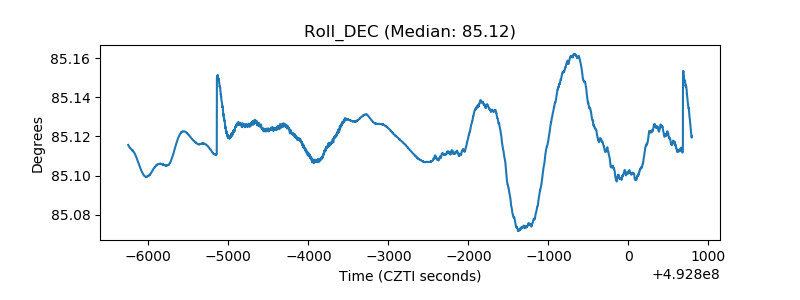 |
| _Roll_RA | 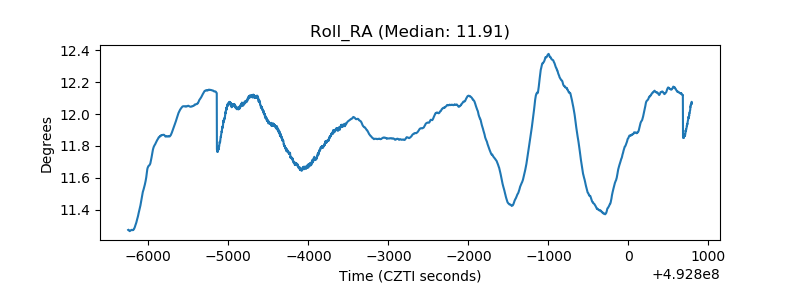 |
| Veto Counter | 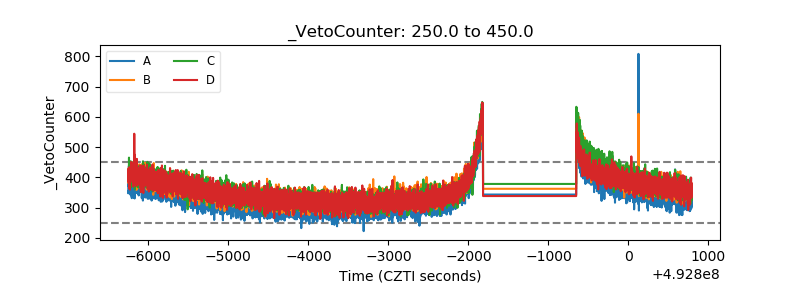 |