| Param | Original file | Final file |
|---|---|---|
| Filename | modeM0/AS1C09_011T09_9000006494_53429cztM0_level2.fits | modeM0/AS1C09_011T09_9000006494_53429cztM0_level2_quad_clean.evt |
| Size (bytes) | 948,602,880 | 66,703,680 |
| Size | 904.7 MB | 63.6 MB |
| Events in quadrant A | 5,120,306 | 575,370 |
| Events in quadrant B | 4,710,006 | 627,891 |
| Events in quadrant C | 16,286,079 | 13,139 |
| Events in quadrant D | 8,511,617 | 364,913 |
| Mode SS | |||
|---|---|---|---|
| Quadrant | BADHDUFLAG | Total packets | Discarded packets |
| A | 0 | 126 | 0 |
| B | 0 | 126 | 0 |
| C | 0 | 126 | 0 |
| D | 0 | 126 | 0 |
| Mode M0 | |||
|---|---|---|---|
| Quadrant | BADHDUFLAG | Total packets | Discarded packets |
| A | 0 | 19610 | 1 |
| B | 0 | 18345 | 1 |
| C | 0 | 52696 | 2 |
| D | 0 | 29751 | 1 |
| Mode M9 | |||
|---|---|---|---|
| Quadrant | BADHDUFLAG | Total packets | Discarded packets |
| A | 0 | 9 | 0 |
| B | 0 | 9 | 0 |
| C | 0 | 9 | 0 |
| D | 0 | 9 | 0 |
| Quadrant | Total seconds | Saturated seconds | Saturation percentage |
|---|---|---|---|
| A | 6283 | 470 | 7.480503% |
| B | 6283 | 358 | 5.697915% |
| C | 6282 | 6196 | 98.631009% |
| D | 6283 | 2360 | 37.561674% |
Noise dominated data is calculated using 1-second bins in cleaned event files. If a bin has >2000 counts, and if more than 50% of those come from <1% of pixels, then it is considered to be noise-dominated and hence unusable.
| Quadrant | # 1 sec bins | Bins with >0 counts | Bins with >2000 counts | High rate bins dominated by noise | Noise dominated (total time) | Noise dominated (detector-on time) | Marked lightcurve |
|---|---|---|---|---|---|---|---|
| A | 7153 | 6284 | 432 | 432 | 6.04% | 6.87% | 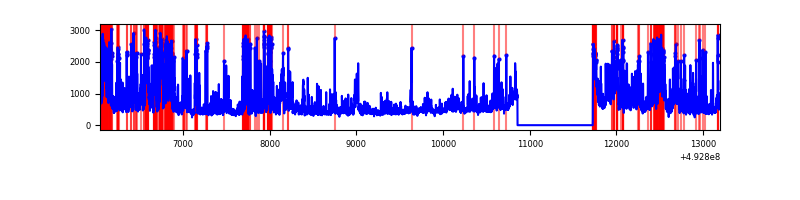 |
| B | 7153 | 6284 | 212 | 212 | 2.96% | 3.37% | 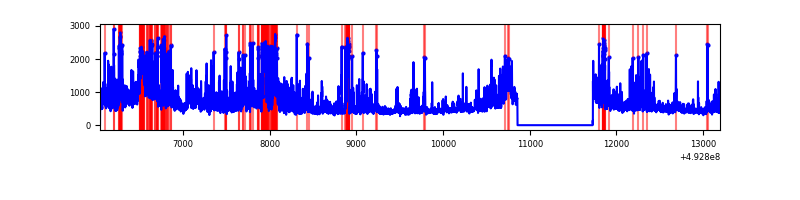 |
| C | 7152 | 6283 | 6030 | 6030 | 84.31% | 95.97% | 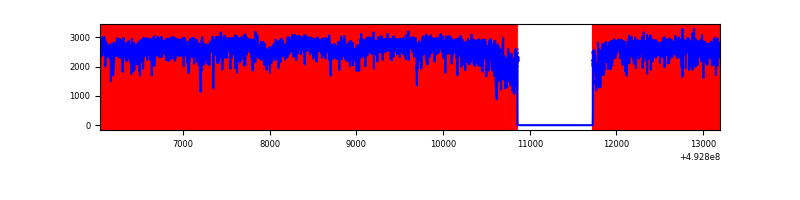 |
| D | 7153 | 6284 | 2011 | 2011 | 28.11% | 32.00% | 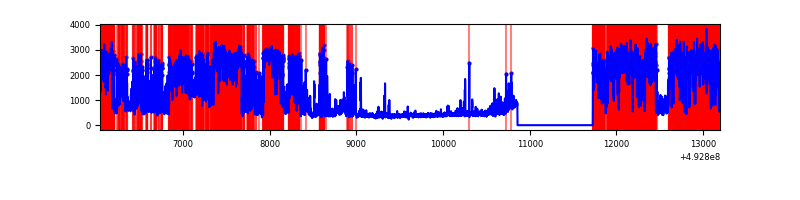 |
Top three noisy pixels from each quadrant. If the there are fewer than three noisy pixels in the level2.evt file, extra rows are filled as -1
| Pixel properties | Quadrant properties | ||||||
|---|---|---|---|---|---|---|---|
| Quadrant | DetID | PixID | Counts | Sigma | Mean | Median | Sigma |
| A | 3 | 63 | 1940422 | 12237.73 | 632 | 617 | 158.5 |
| A | 15 | 174 | 257816 | 1622.6 | 632 | 617 | 158.5 |
| A | 12 | 80 | 56652 | 353.51 | 632 | 617 | 158.5 |
| B | 4 | 171 | 469141 | 3459.03 | 639 | 615 | 135.5 |
| B | 4 | 206 | 379045 | 2793.87 | 639 | 615 | 135.5 |
| B | 10 | 28 | 308502 | 2273.07 | 639 | 615 | 135.5 |
| C | 7 | 64 | 11602039 | 219144.67 | 187 | 184 | 52.9 |
| C | 1 | 241 | 2107474 | 39804.09 | 187 | 184 | 52.9 |
| C | 15 | 224 | 969763 | 18314.14 | 187 | 184 | 52.9 |
| D | 8 | 176 | 4818409 | 34035.08 | 493 | 472 | 141.6 |
| D | 13 | 153 | 629847 | 4446.06 | 493 | 472 | 141.6 |
| D | 2 | 172 | 595485 | 4203.32 | 493 | 472 | 141.6 |
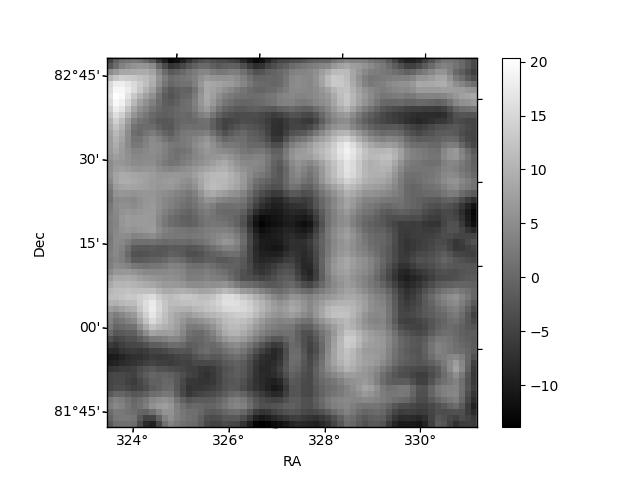
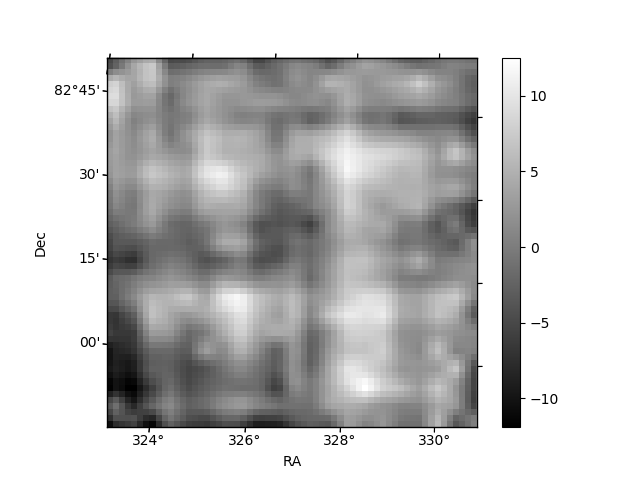
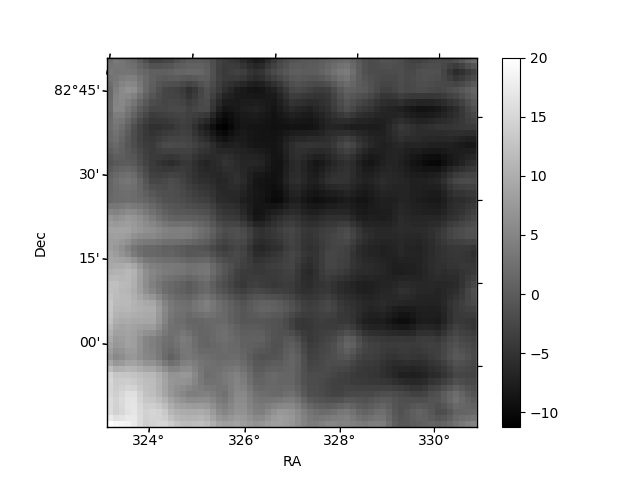
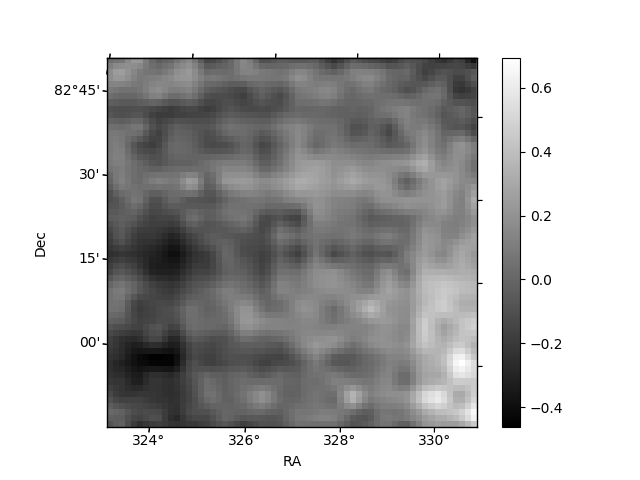
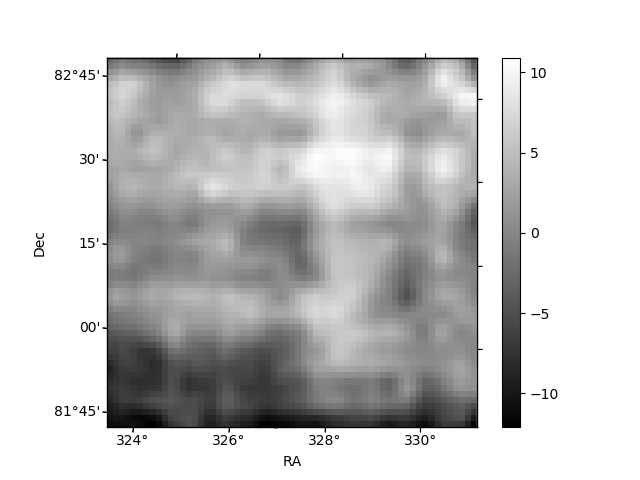
Histogram calculated using DETX and DETY for each event in the final _common_clean file
| Quadrant A | 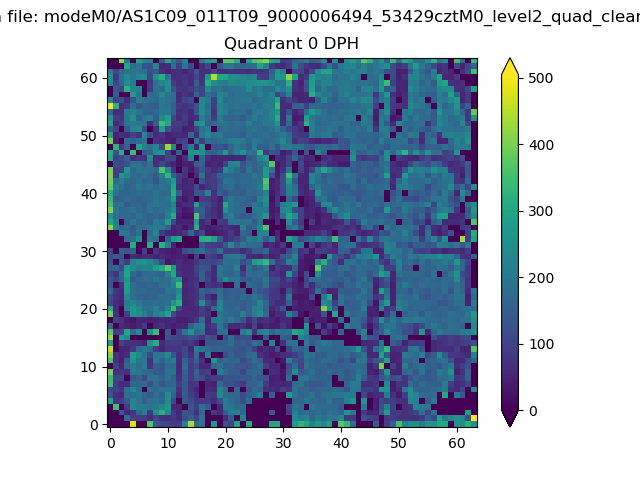 |
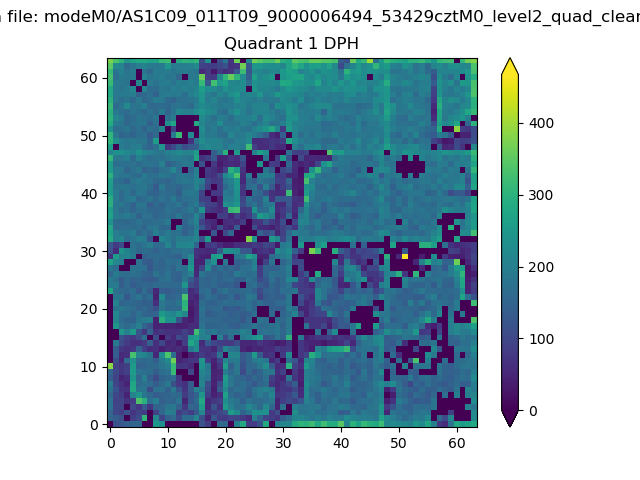 |
Quadrant B |
|---|---|---|---|
| Quadrant D | 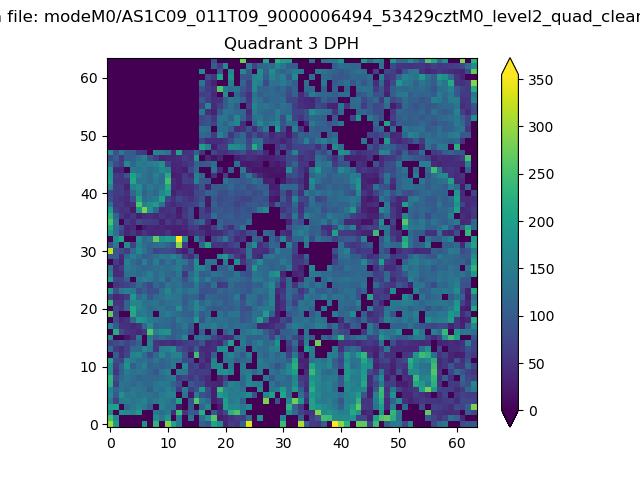 |
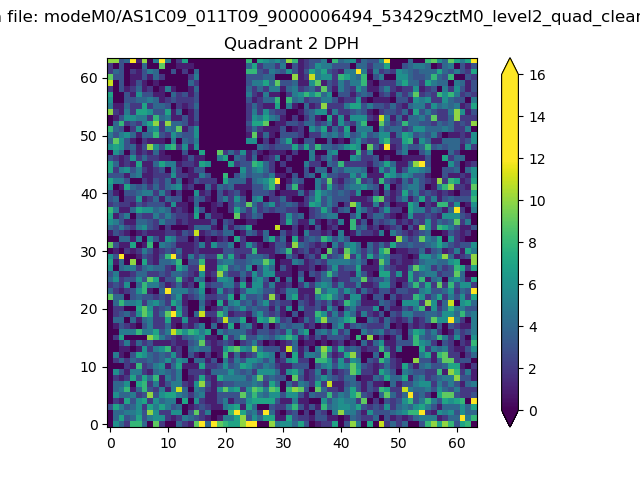 |
Quadrant C |
| Plot type | Count rate plots | Images |
|---|---|---|
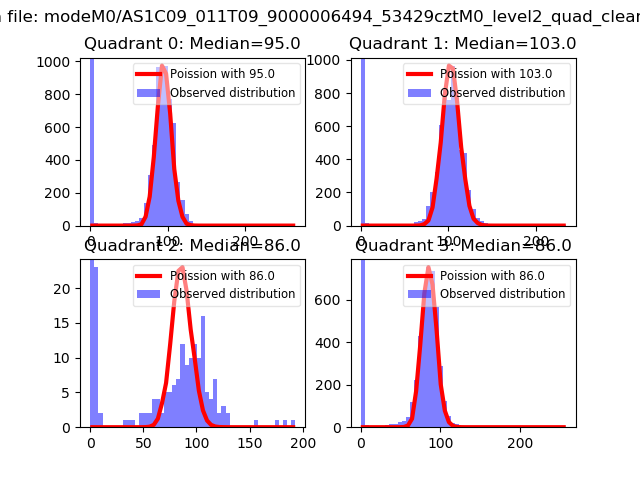
| Comparison with Poisson distribution Blue bars denote a histogram of data divided into 1 sec bins. Red curve is a Poisson curve with rate = median count rate of data. |
 |
 |
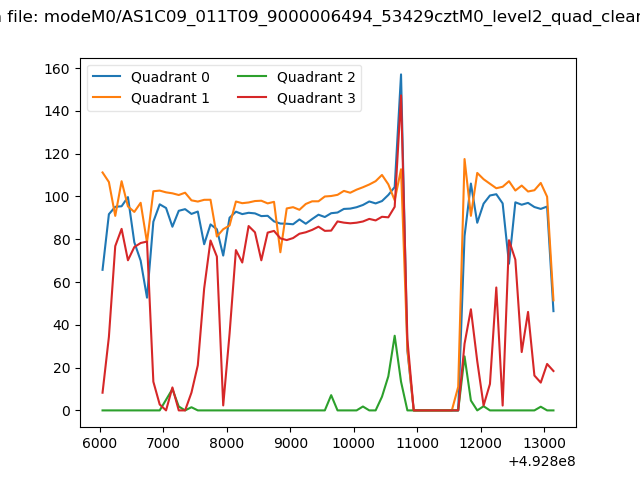
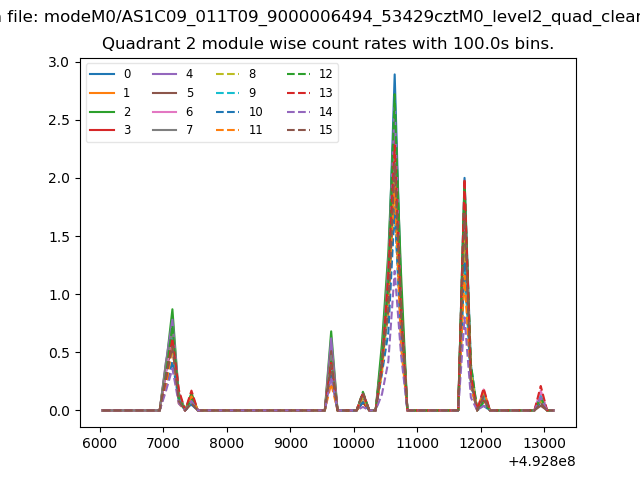
| Quadrant-wise count rates Data is divided into 100 sec bins |
 |
|
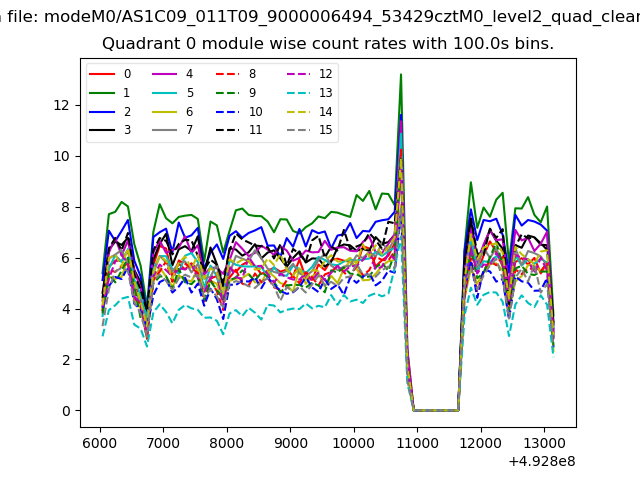
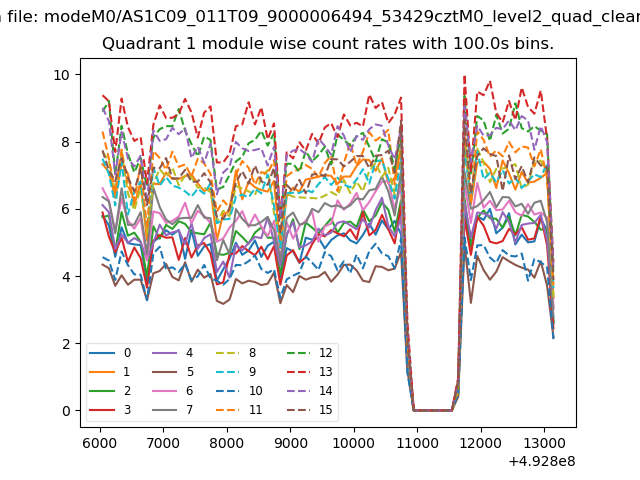
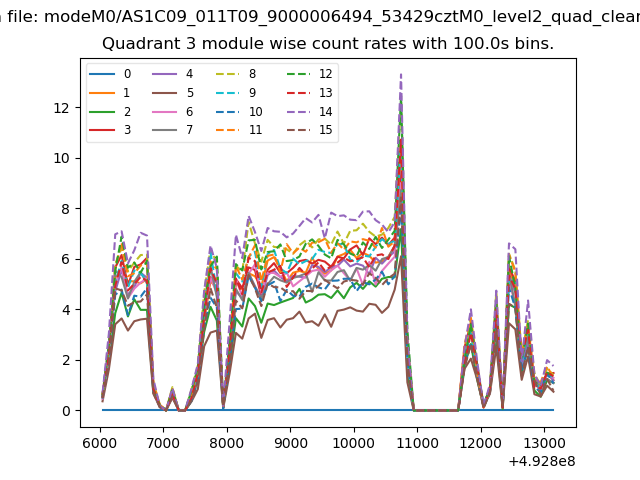
| Module-wise count rates for Quadrant A Data is divided into 100 sec bins |
 |
 |
| Module-wise count rates for Quadrant B Data is divided into 100 sec bins |
 |
 |
| Module-wise count rates for Quadrant C Data is divided into 100 sec bins |
 |
 |
| Module-wise count rates for Quadrant D Data is divided into 100 sec bins |
 |
 |
| Parameter | Plot |
|---|---|
| CZT HV Monitor | 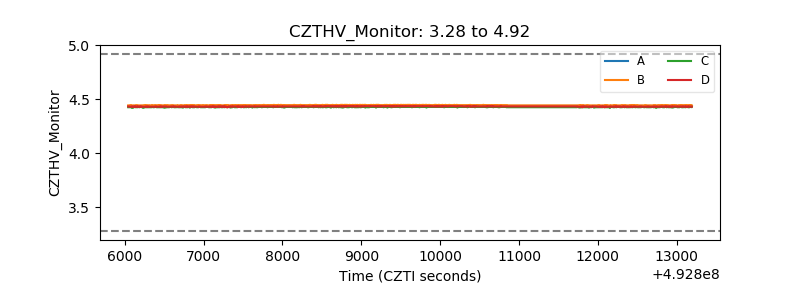 |
| D_VDD | 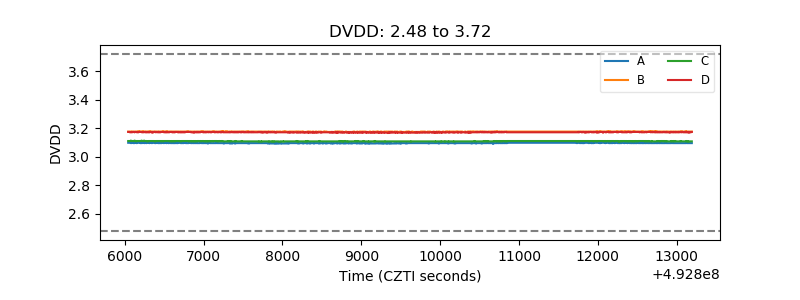 |
| Temperature 1 | 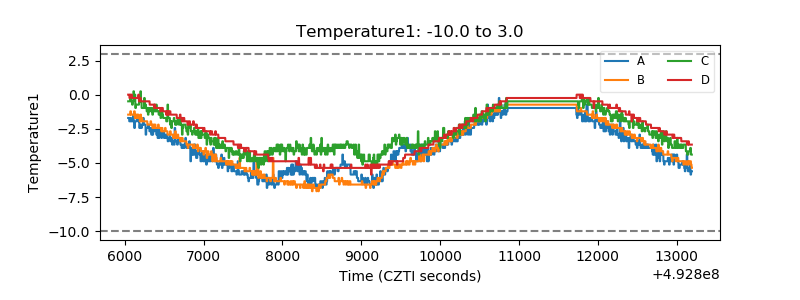 |
| Veto HV Monitor | 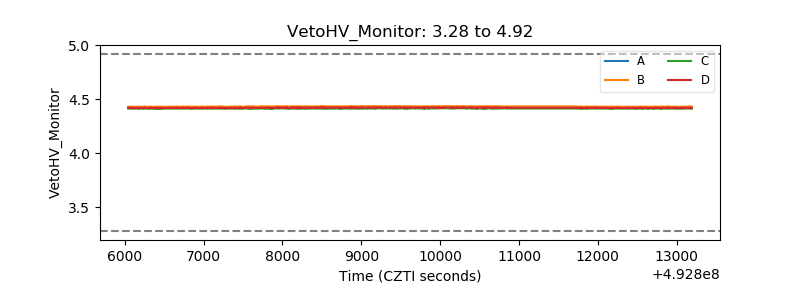 |
| Veto LLD | 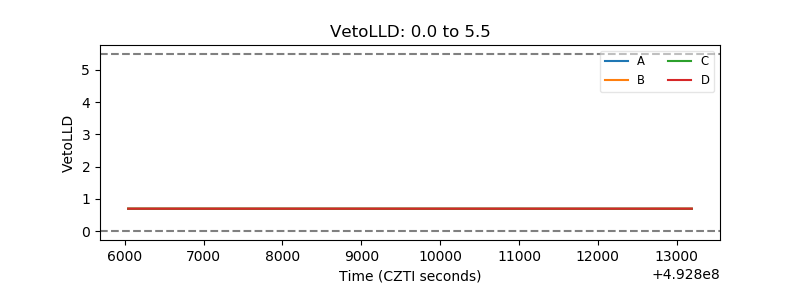 |
| Alpha Counter | 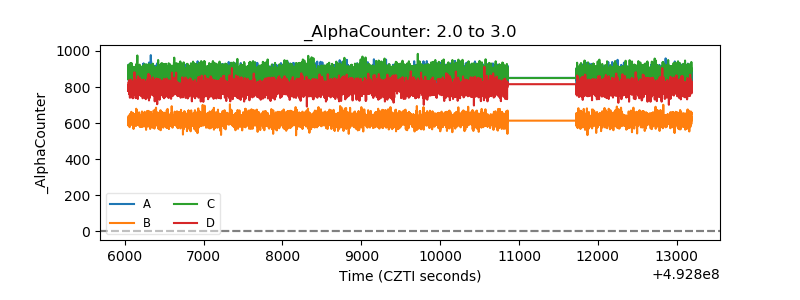 |
| _CPM_Rate | 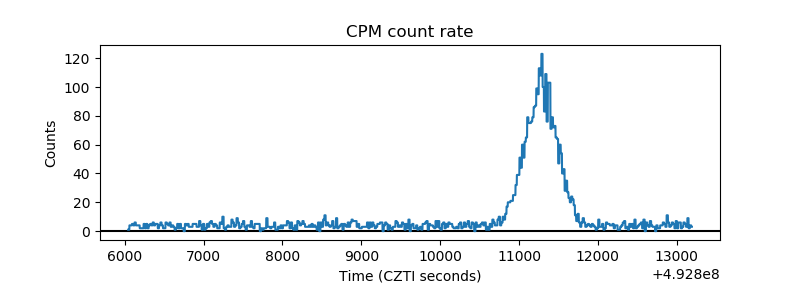 |
| CZT Counter | 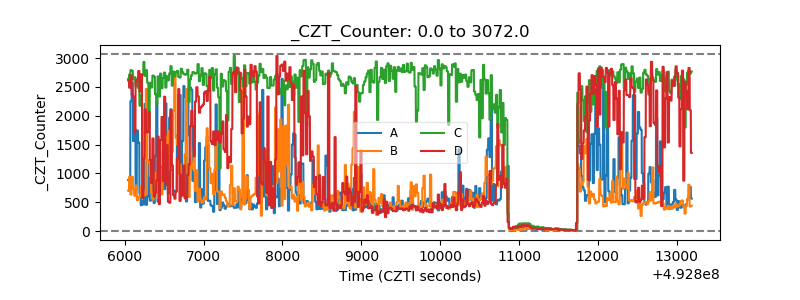 |
| +2.5 Volts monitor | 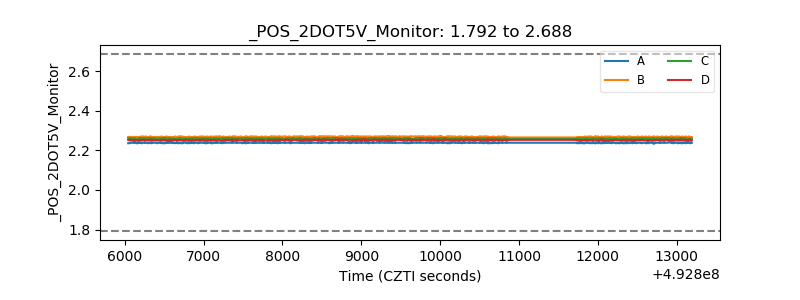 |
| +5 Volts monitor | 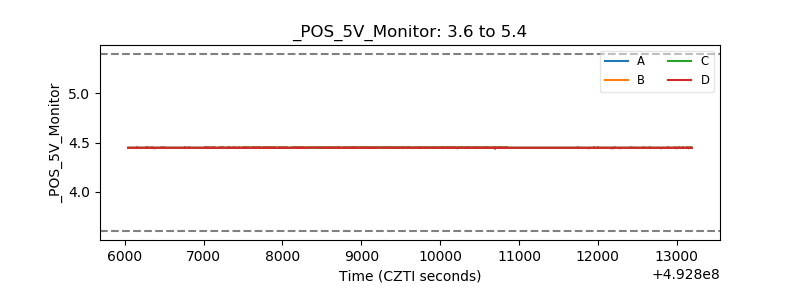 |
| _ROLL_ROT | 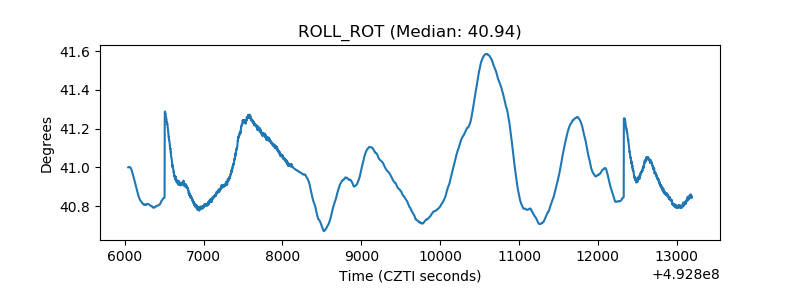 |
| _Roll_DEC | 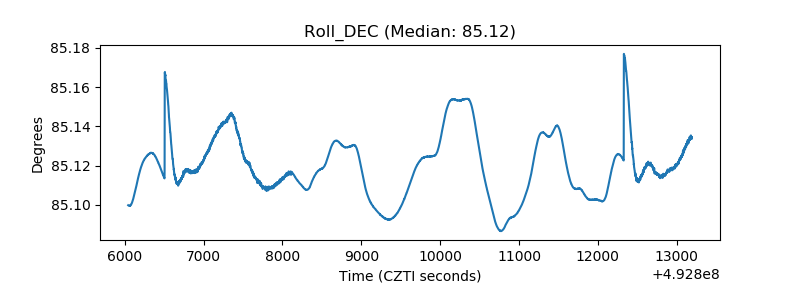 |
| _Roll_RA | 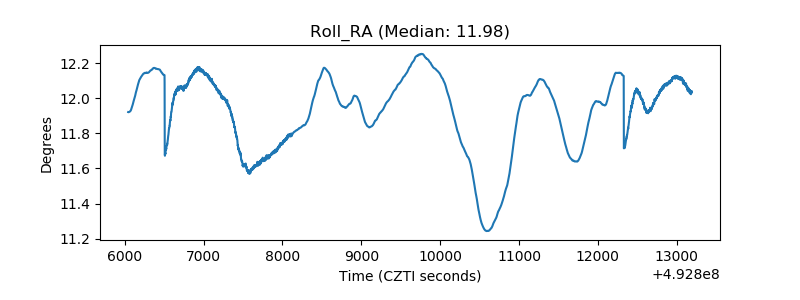 |
| Veto Counter | 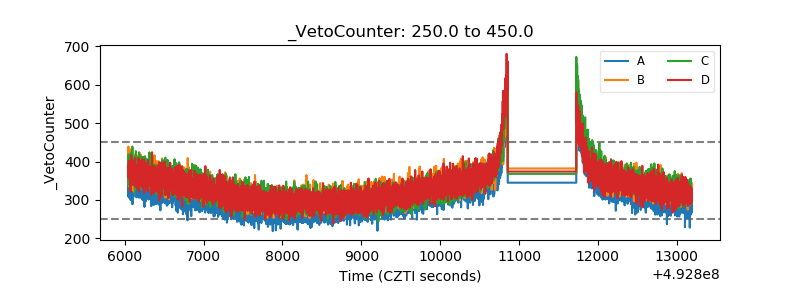 |