| Param | Original file | Final file |
|---|---|---|
| Filename | modeM0/AS1C09_011T09_9000006494_53430cztM0_level2.fits | modeM0/AS1C09_011T09_9000006494_53430cztM0_level2_quad_clean.evt |
| Size (bytes) | 1,022,031,360 | 75,090,240 |
| Size | 974.7 MB | 71.6 MB |
| Events in quadrant A | 5,324,008 | 652,346 |
| Events in quadrant B | 5,666,211 | 634,487 |
| Events in quadrant C | 18,174,914 | 41,294 |
| Events in quadrant D | 8,123,520 | 455,262 |
| Mode SS | |||
|---|---|---|---|
| Quadrant | BADHDUFLAG | Total packets | Discarded packets |
| A | 0 | 144 | 0 |
| B | 0 | 144 | 0 |
| C | 0 | 144 | 0 |
| D | 0 | 144 | 0 |
| Mode M0 | |||
|---|---|---|---|
| Quadrant | BADHDUFLAG | Total packets | Discarded packets |
| A | 0 | 20738 | 1 |
| B | 0 | 21805 | 2 |
| C | 0 | 58890 | 1 |
| D | 0 | 29296 | 1 |
| Mode M9 | |||
|---|---|---|---|
| Quadrant | BADHDUFLAG | Total packets | Discarded packets |
| A | 0 | 4 | 0 |
| B | 0 | 4 | 0 |
| C | 0 | 4 | 0 |
| D | 0 | 4 | 0 |
| Quadrant | Total seconds | Saturated seconds | Saturation percentage |
|---|---|---|---|
| A | 7028 | 392 | 5.577689% |
| B | 7028 | 898 | 12.777462% |
| C | 7028 | 6644 | 94.536141% |
| D | 7028 | 1963 | 27.931133% |
Noise dominated data is calculated using 1-second bins in cleaned event files. If a bin has >2000 counts, and if more than 50% of those come from <1% of pixels, then it is considered to be noise-dominated and hence unusable.
| Quadrant | # 1 sec bins | Bins with >0 counts | Bins with >2000 counts | High rate bins dominated by noise | Noise dominated (total time) | Noise dominated (detector-on time) | Marked lightcurve |
|---|---|---|---|---|---|---|---|
| A | 7468 | 7030 | 296 | 296 | 3.96% | 4.21% | 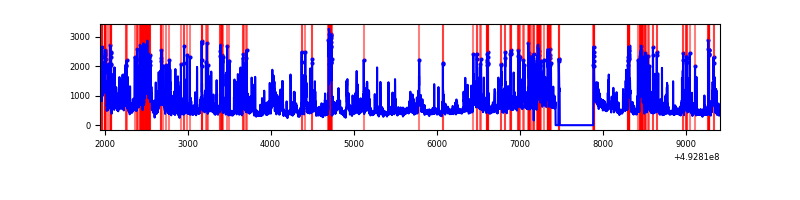 |
| B | 7468 | 7030 | 456 | 456 | 6.11% | 6.49% | 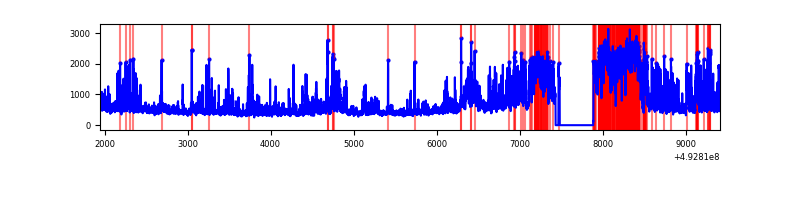 |
| C | 7468 | 7030 | 6691 | 6691 | 89.60% | 95.18% | 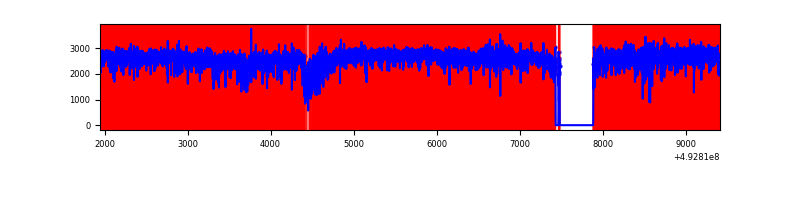 |
| D | 7468 | 7030 | 1938 | 1938 | 25.95% | 27.57% | 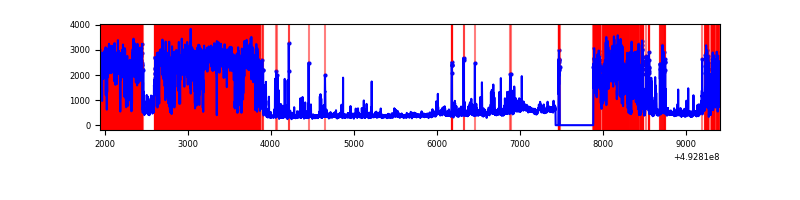 |
Top three noisy pixels from each quadrant. If the there are fewer than three noisy pixels in the level2.evt file, extra rows are filled as -1
| Pixel properties | Quadrant properties | ||||||
|---|---|---|---|---|---|---|---|
| Quadrant | DetID | PixID | Counts | Sigma | Mean | Median | Sigma |
| A | 3 | 63 | 1358946 | 7580.65 | 717 | 700 | 179.2 |
| A | 15 | 174 | 469352 | 2615.64 | 717 | 700 | 179.2 |
| A | 0 | 8 | 283751 | 1579.76 | 717 | 700 | 179.2 |
| B | 4 | 171 | 1764301 | 12027.21 | 689 | 664 | 146.6 |
| B | 10 | 254 | 270171 | 1837.92 | 689 | 664 | 146.6 |
| B | 4 | 206 | 187276 | 1272.61 | 689 | 664 | 146.6 |
| C | 7 | 64 | 14097622 | 190927.66 | 261 | 259 | 73.8 |
| C | 15 | 224 | 1117432 | 15130.43 | 261 | 259 | 73.8 |
| C | 1 | 241 | 543678 | 7359.8 | 261 | 259 | 73.8 |
| D | 8 | 176 | 5148689 | 30166.92 | 601 | 573 | 170.7 |
| D | 2 | 153 | 168082 | 981.57 | 601 | 573 | 170.7 |
| D | 10 | 172 | 94420 | 549.92 | 601 | 573 | 170.7 |
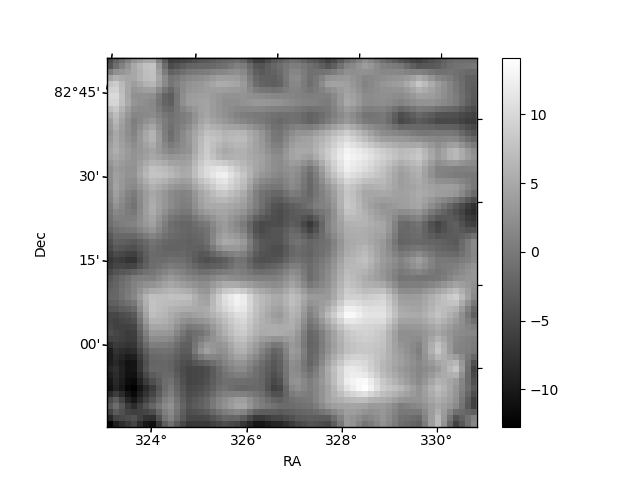
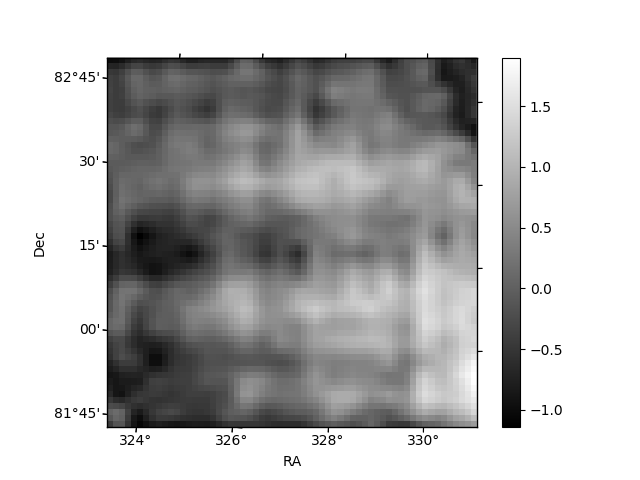
Histogram calculated using DETX and DETY for each event in the final _common_clean file
| Quadrant A | 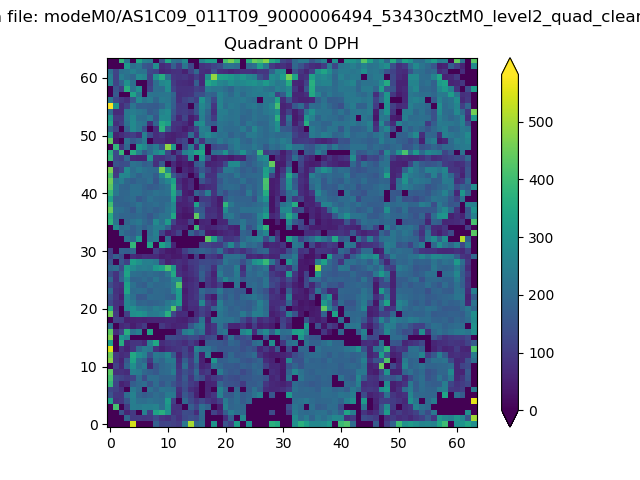 |
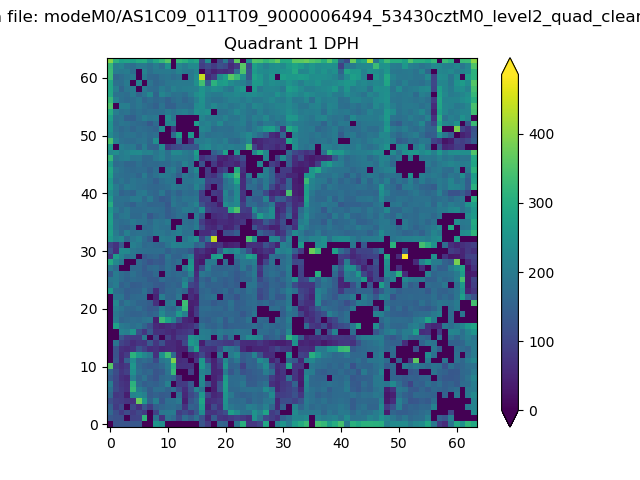 |
Quadrant B |
|---|---|---|---|
| Quadrant D | 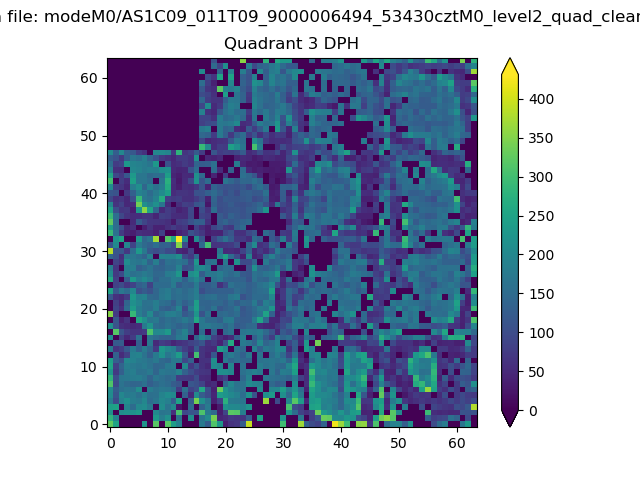 |
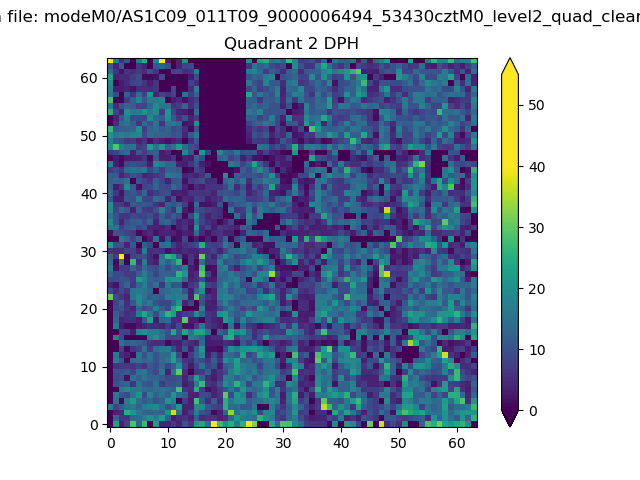 |
Quadrant C |
| Plot type | Count rate plots | Images |
|---|---|---|
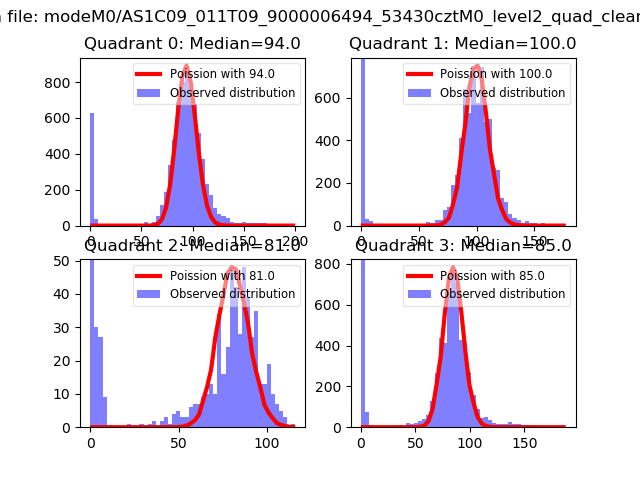
| Comparison with Poisson distribution Blue bars denote a histogram of data divided into 1 sec bins. Red curve is a Poisson curve with rate = median count rate of data. |
 |
 |
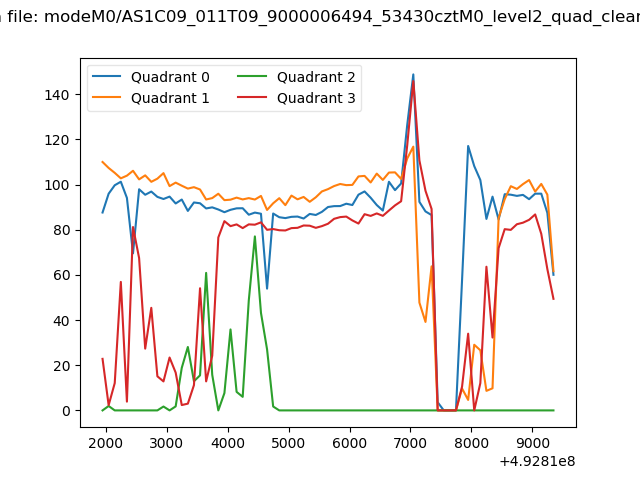
| Quadrant-wise count rates Data is divided into 100 sec bins |
 |
|
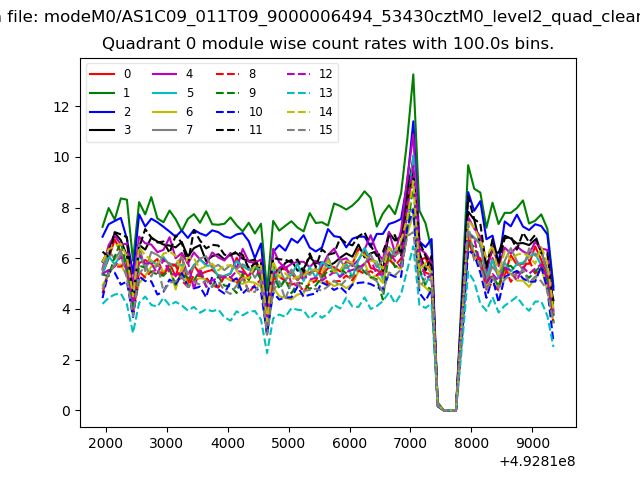
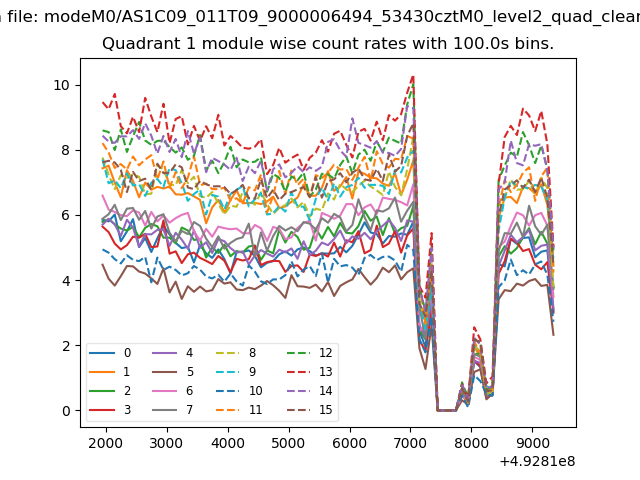
| Module-wise count rates for Quadrant A Data is divided into 100 sec bins |
 |
 |
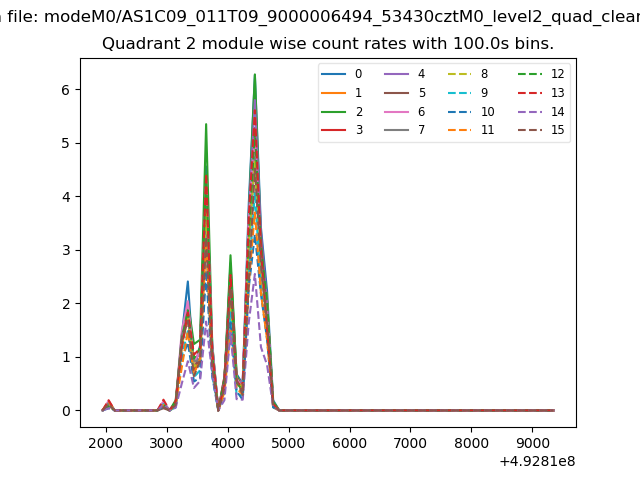
| Module-wise count rates for Quadrant B Data is divided into 100 sec bins |
 |
 |
| Module-wise count rates for Quadrant C Data is divided into 100 sec bins |
 |
 |
| Module-wise count rates for Quadrant D Data is divided into 100 sec bins |
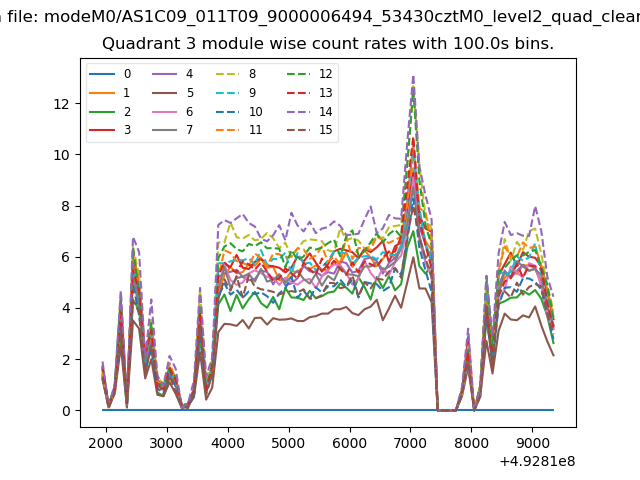 |
 |
| Parameter | Plot |
|---|---|
| CZT HV Monitor |  |
| D_VDD | 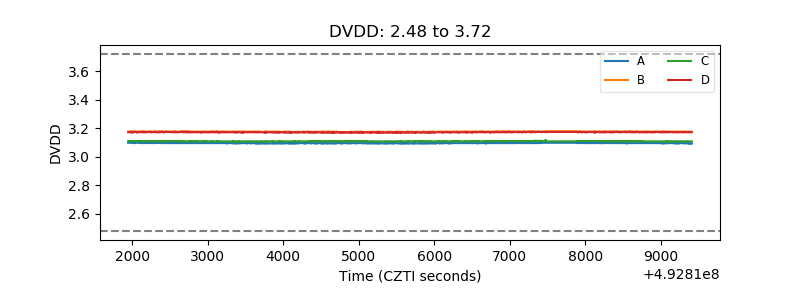 |
| Temperature 1 | 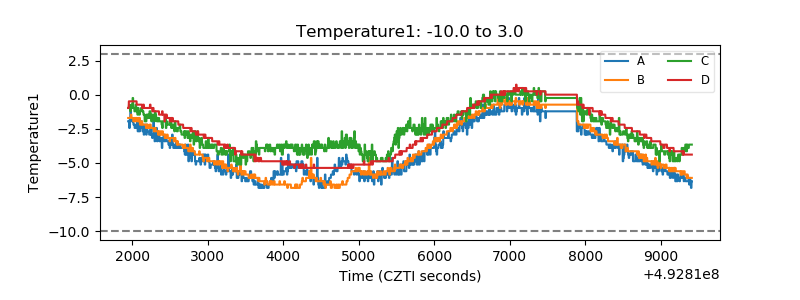 |
| Veto HV Monitor | 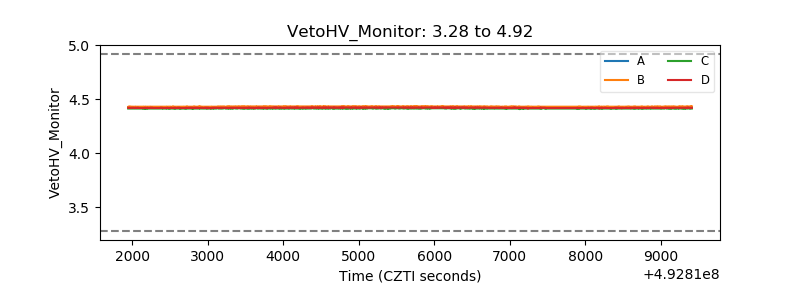 |
| Veto LLD | 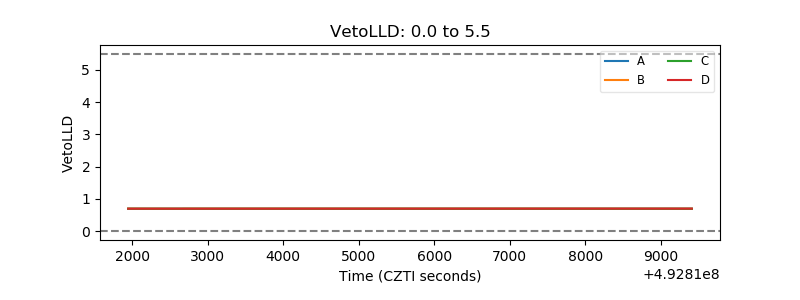 |
| Alpha Counter | 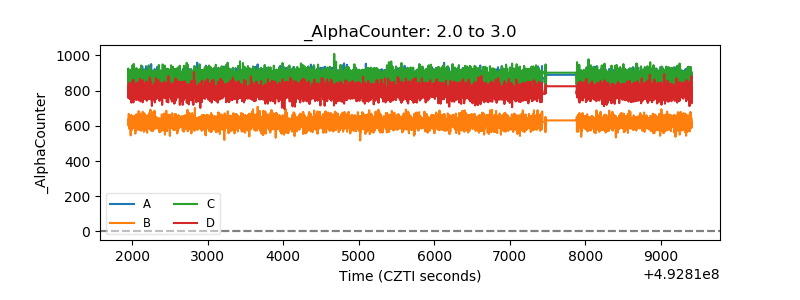 |
| _CPM_Rate | 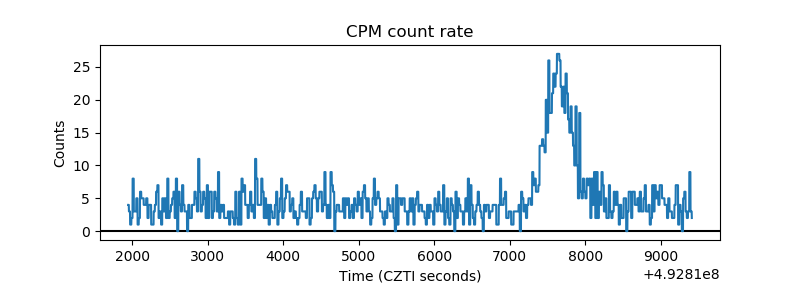 |
| CZT Counter | 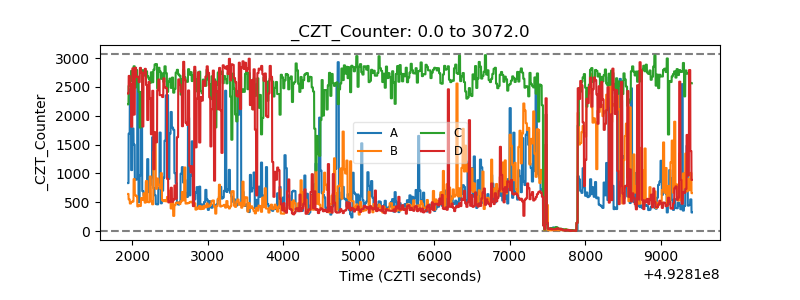 |
| +2.5 Volts monitor |  |
| +5 Volts monitor |  |
| _ROLL_ROT | 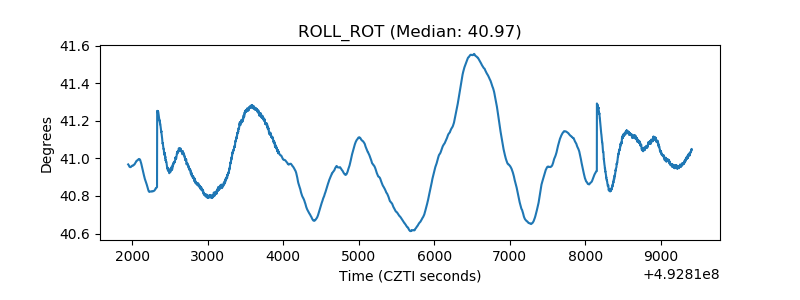 |
| _Roll_DEC | 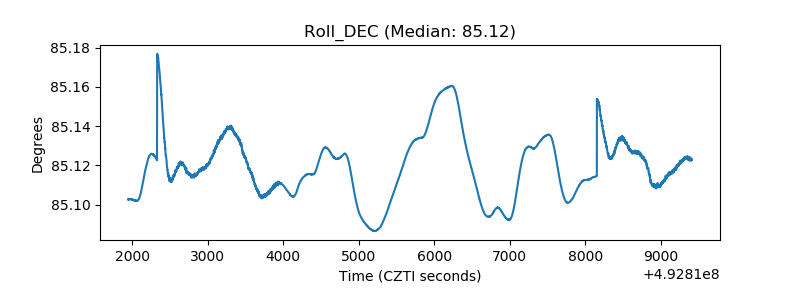 |
| _Roll_RA | 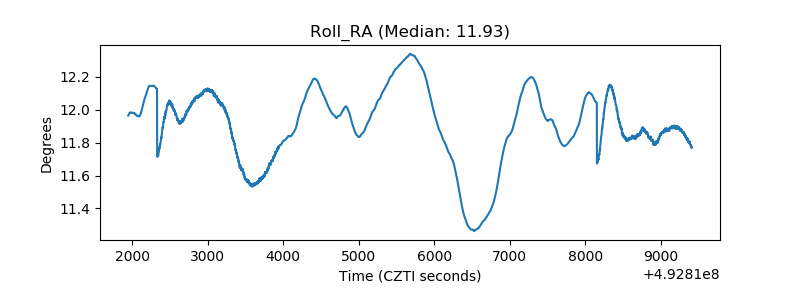 |
| Veto Counter | 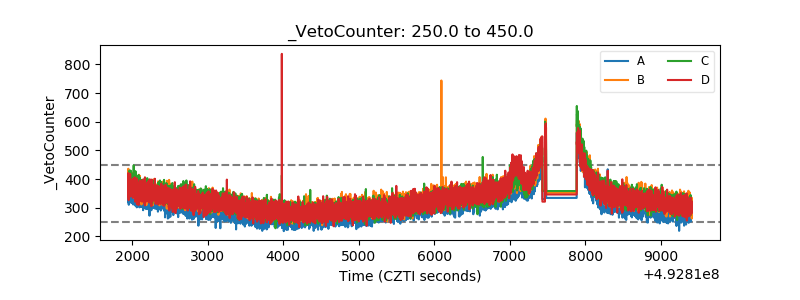 |