| Param | Original file | Final file |
|---|---|---|
| Filename | modeM0/AS1C09_011T09_9000006494_53432cztM0_level2.fits | modeM0/AS1C09_011T09_9000006494_53432cztM0_level2_quad_clean.evt |
| Size (bytes) | 1,058,760,000 | 86,739,840 |
| Size | 1009.7 MB | 82.7 MB |
| Events in quadrant A | 6,498,780 | 690,475 |
| Events in quadrant B | 8,048,869 | 678,360 |
| Events in quadrant C | 19,787,095 | 54,658 |
| Events in quadrant D | 4,258,195 | 664,368 |
| Mode SS | |||
|---|---|---|---|
| Quadrant | BADHDUFLAG | Total packets | Discarded packets |
| A | 0 | 154 | 0 |
| B | 0 | 154 | 0 |
| C | 0 | 154 | 0 |
| D | 0 | 154 | 0 |
| Mode M0 | |||
|---|---|---|---|
| Quadrant | BADHDUFLAG | Total packets | Discarded packets |
| A | 0 | 24789 | 0 |
| B | 0 | 29365 | 0 |
| C | 0 | 64075 | 0 |
| D | 0 | 18382 | 0 |
| Quadrant | Total seconds | Saturated seconds | Saturation percentage |
|---|---|---|---|
| A | 7739 | 547 | 7.068097% |
| B | 7739 | 1324 | 17.108154% |
| C | 7739 | 7264 | 93.862256% |
| D | 7739 | 71 | 0.917431% |
Noise dominated data is calculated using 1-second bins in cleaned event files. If a bin has >2000 counts, and if more than 50% of those come from <1% of pixels, then it is considered to be noise-dominated and hence unusable.
| Quadrant | # 1 sec bins | Bins with >0 counts | Bins with >2000 counts | High rate bins dominated by noise | Noise dominated (total time) | Noise dominated (detector-on time) | Marked lightcurve |
|---|---|---|---|---|---|---|---|
| A | 7739 | 7739 | 477 | 477 | 6.16% | 6.16% | 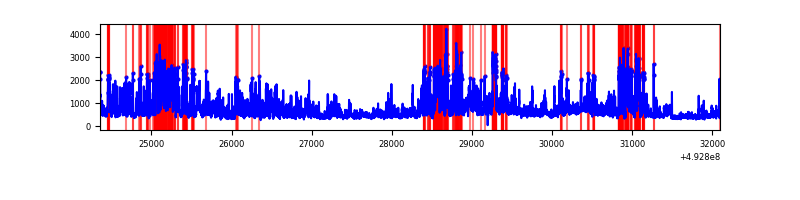 |
| B | 7739 | 7739 | 621 | 621 | 8.02% | 8.02% | 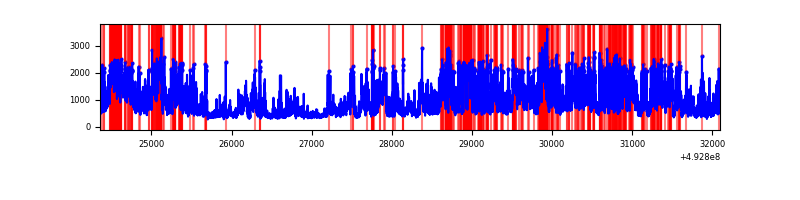 |
| C | 7739 | 7739 | 7114 | 7114 | 91.92% | 91.92% | 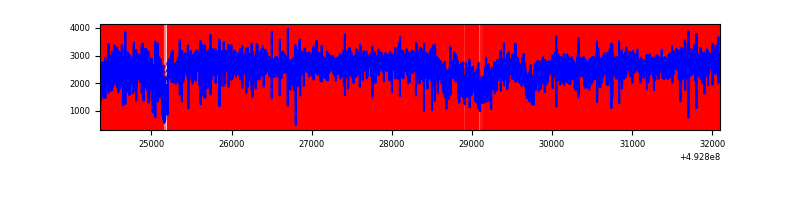 |
| D | 7739 | 7739 | 82 | 82 | 1.06% | 1.06% | 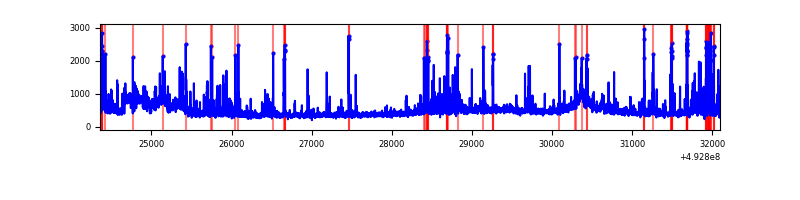 |
Top three noisy pixels from each quadrant. If the there are fewer than three noisy pixels in the level2.evt file, extra rows are filled as -1
| Pixel properties | Quadrant properties | ||||||
|---|---|---|---|---|---|---|---|
| Quadrant | DetID | PixID | Counts | Sigma | Mean | Median | Sigma |
| A | 3 | 14 | 1526399 | 7857.23 | 779 | 759 | 194.2 |
| A | 15 | 174 | 1022837 | 5263.83 | 779 | 759 | 194.2 |
| A | 3 | 63 | 452049 | 2324.2 | 779 | 759 | 194.2 |
| B | 4 | 171 | 1921280 | 11810.92 | 759 | 733 | 162.6 |
| B | 10 | 254 | 1294870 | 7958.64 | 759 | 733 | 162.6 |
| B | 4 | 206 | 1259002 | 7738.06 | 759 | 733 | 162.6 |
| C | 7 | 64 | 15298372 | 177191.87 | 312 | 308 | 86.3 |
| C | 15 | 224 | 1746357 | 20223.85 | 312 | 308 | 86.3 |
| C | 1 | 241 | 830817 | 9619.48 | 312 | 308 | 86.3 |
| D | 7 | 70 | 312897 | 1409.67 | 781 | 746 | 221.4 |
| D | 10 | 172 | 174895 | 786.45 | 781 | 746 | 221.4 |
| D | 2 | 249 | 163243 | 733.83 | 781 | 746 | 221.4 |
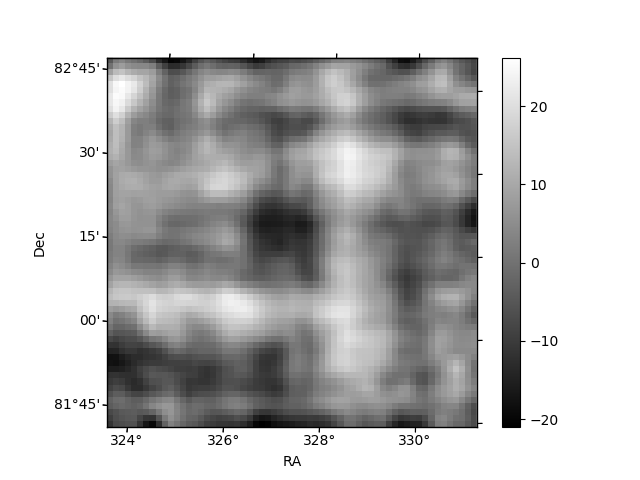
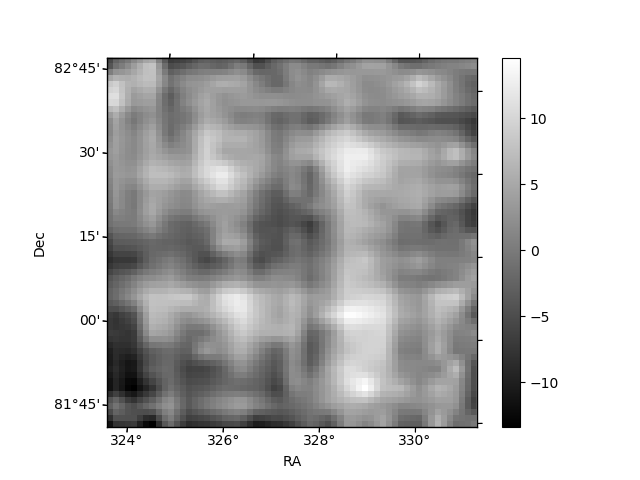
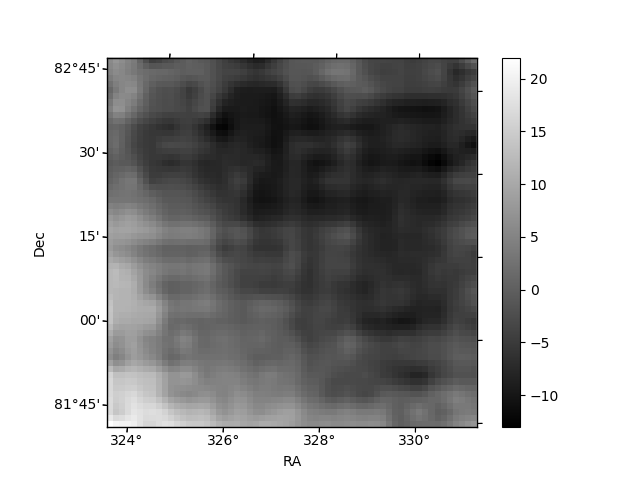
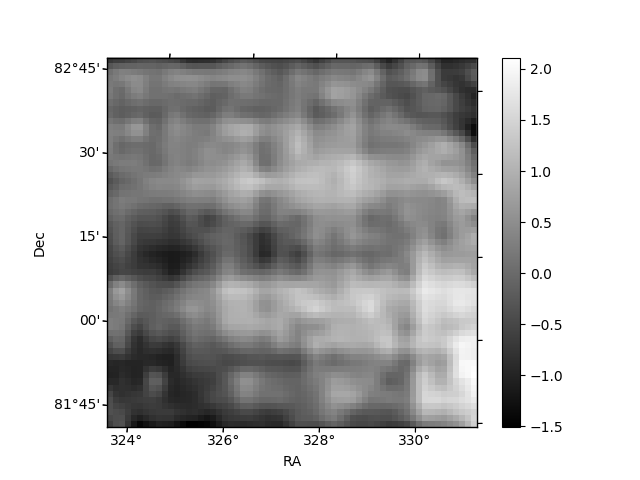
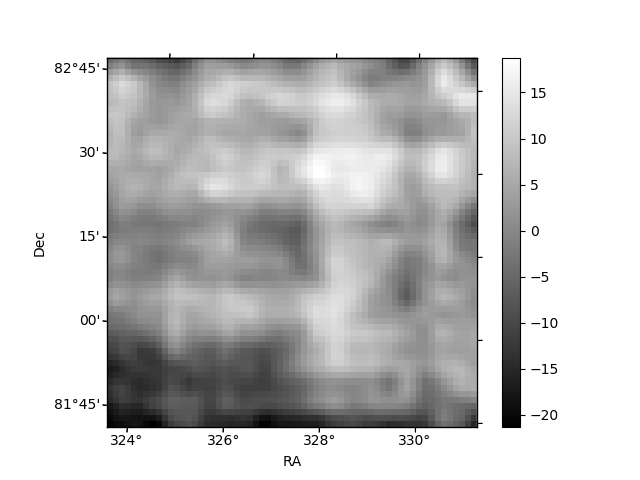
Histogram calculated using DETX and DETY for each event in the final _common_clean file
| Quadrant A | 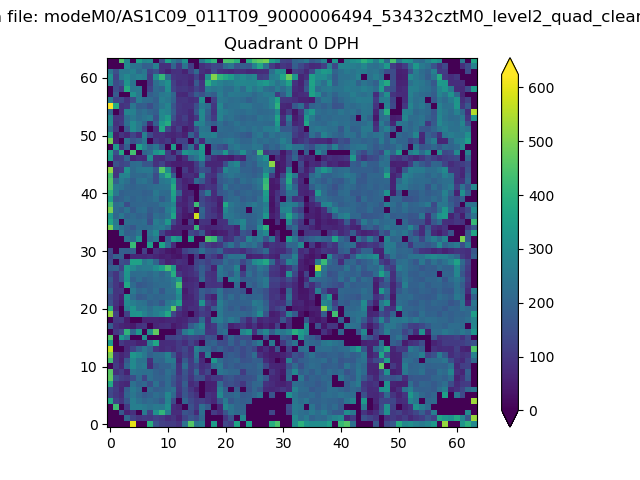 |
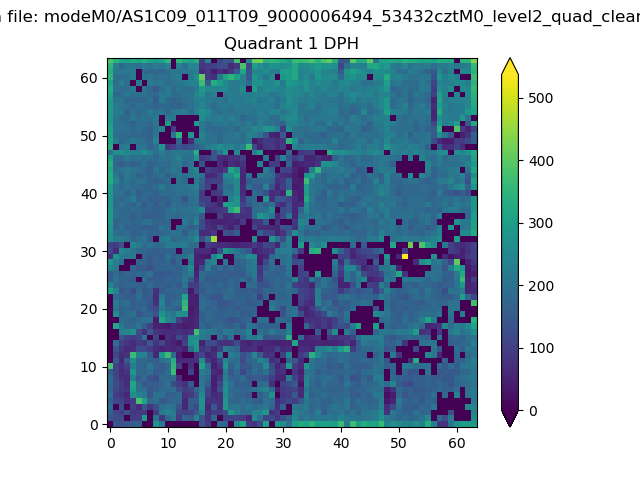 |
Quadrant B |
|---|---|---|---|
| Quadrant D | 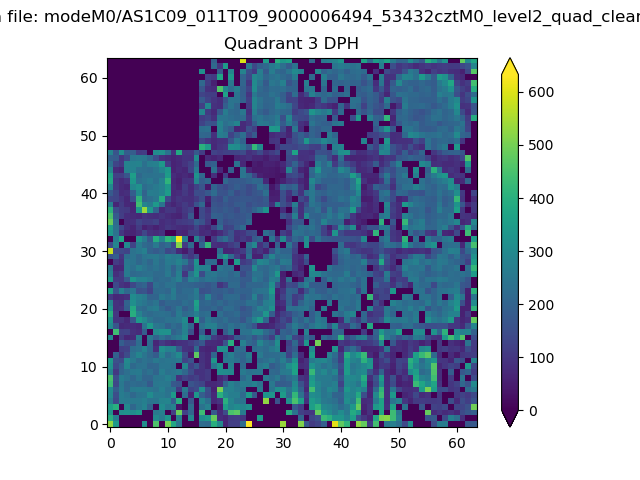 |
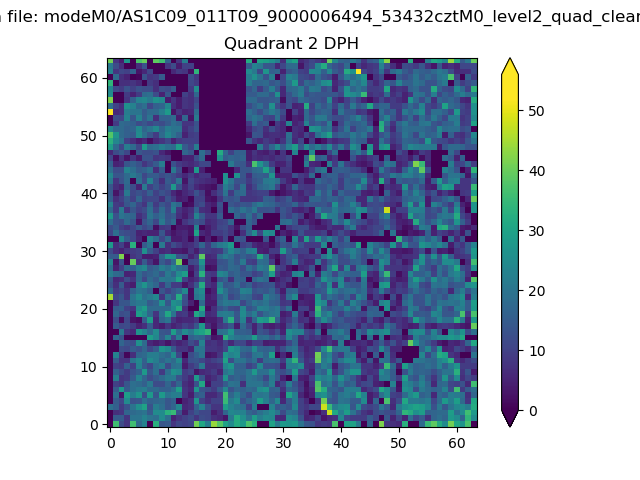 |
Quadrant C |
| Plot type | Count rate plots | Images |
|---|---|---|
| Comparison with Poisson distribution Blue bars denote a histogram of data divided into 1 sec bins. Red curve is a Poisson curve with rate = median count rate of data. |
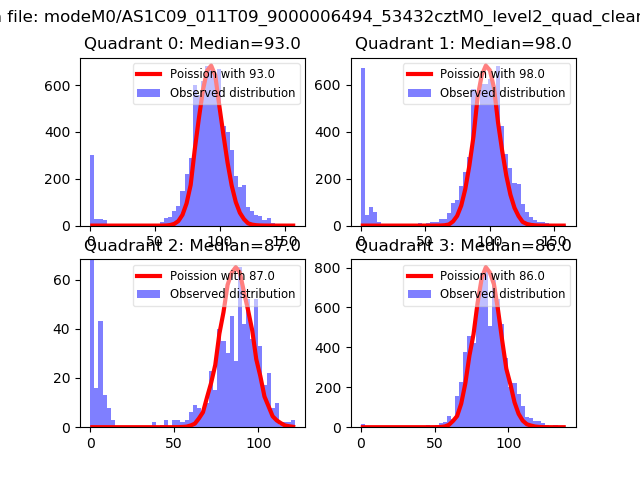 |
 |
| Quadrant-wise count rates Data is divided into 100 sec bins |
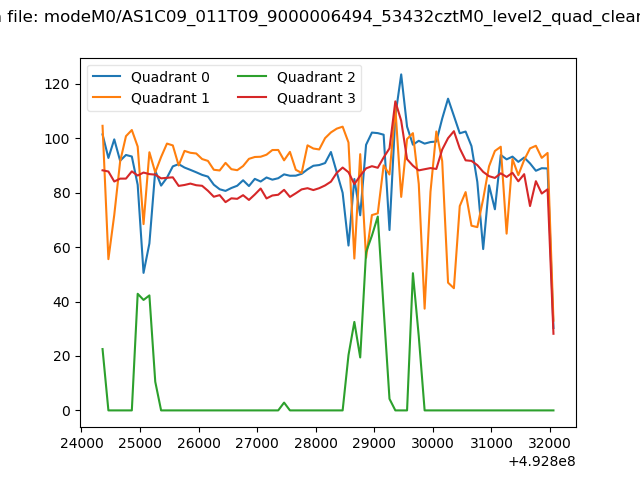 |
|
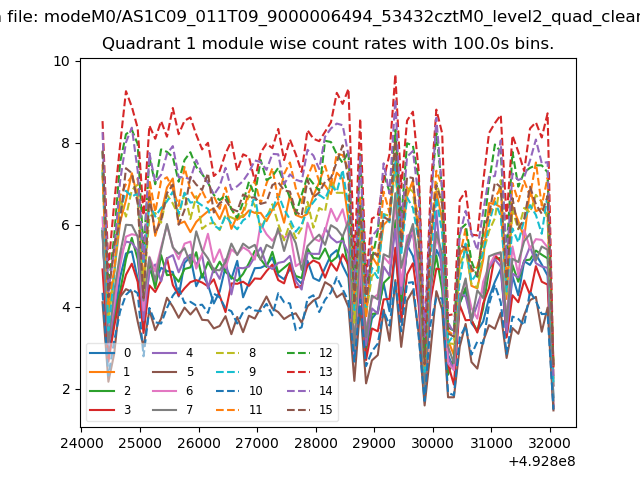
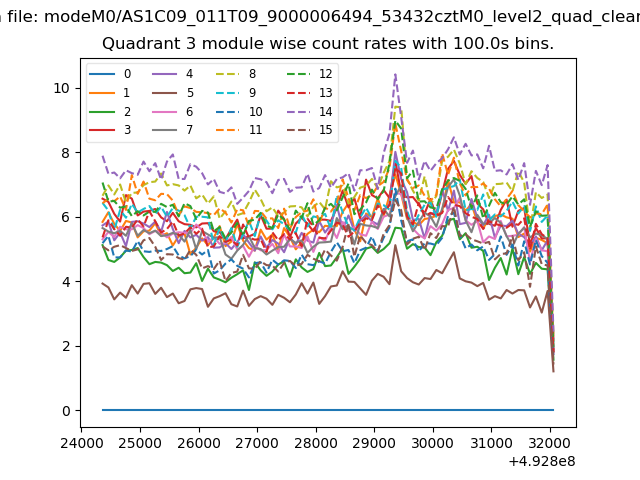
| Module-wise count rates for Quadrant A Data is divided into 100 sec bins |
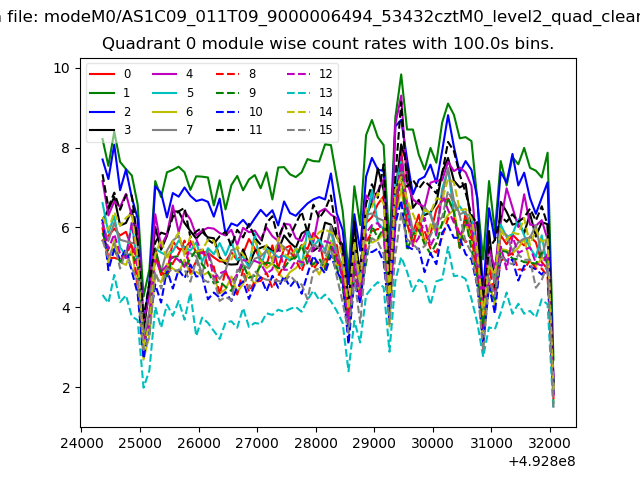 |
 |
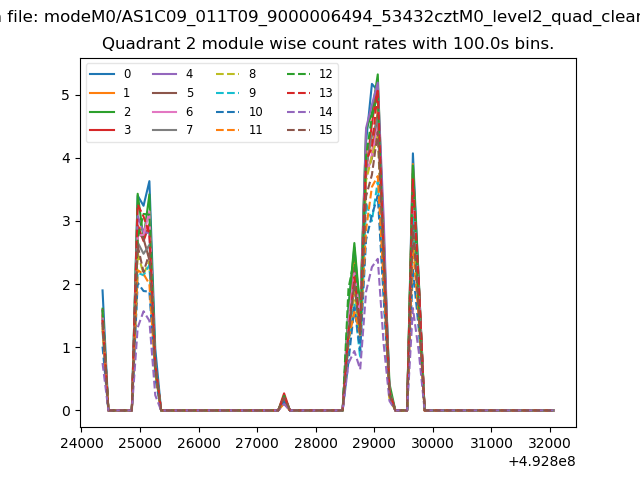
| Module-wise count rates for Quadrant B Data is divided into 100 sec bins |
 |
 |
| Module-wise count rates for Quadrant C Data is divided into 100 sec bins |
 |
 |
| Module-wise count rates for Quadrant D Data is divided into 100 sec bins |
 |
 |
| Parameter | Plot |
|---|---|
| CZT HV Monitor | 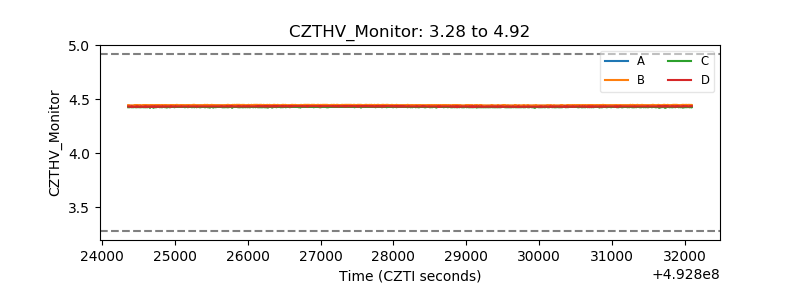 |
| D_VDD | 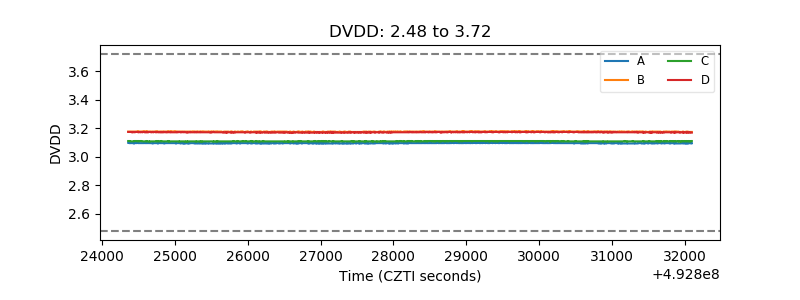 |
| Temperature 1 | 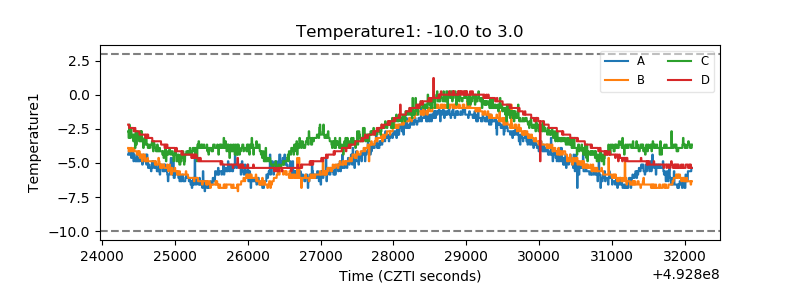 |
| Veto HV Monitor | 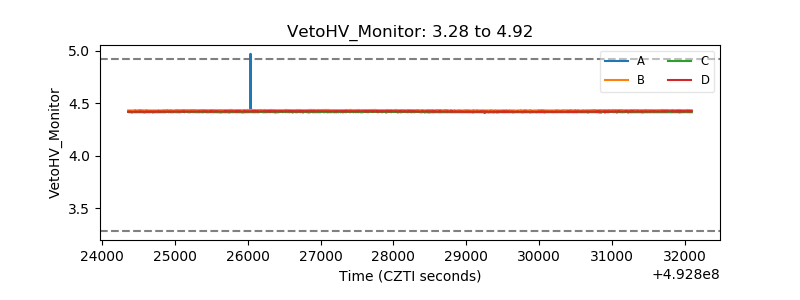 |
| Veto LLD | 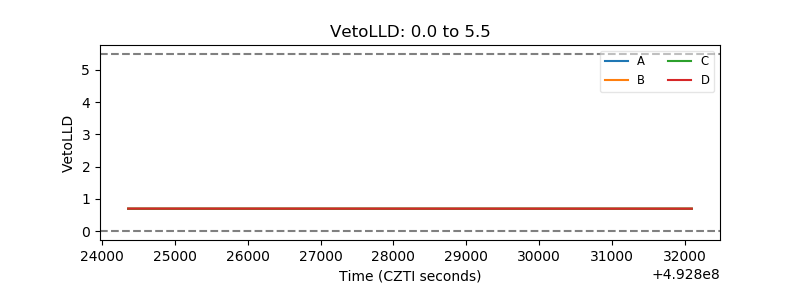 |
| Alpha Counter | 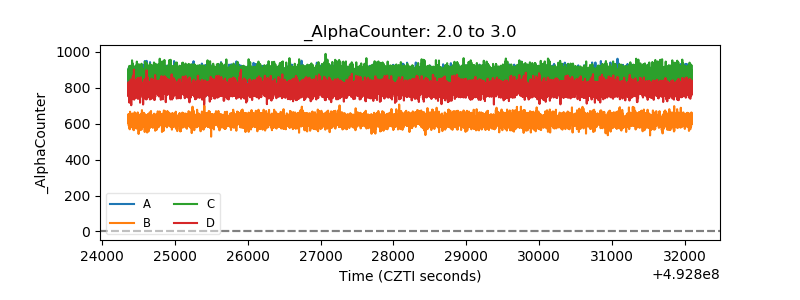 |
| _CPM_Rate | 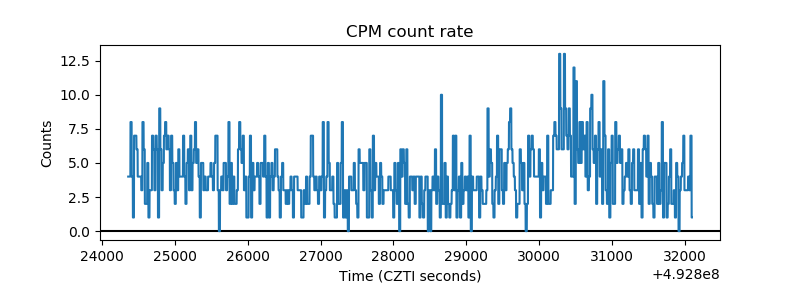 |
| CZT Counter | 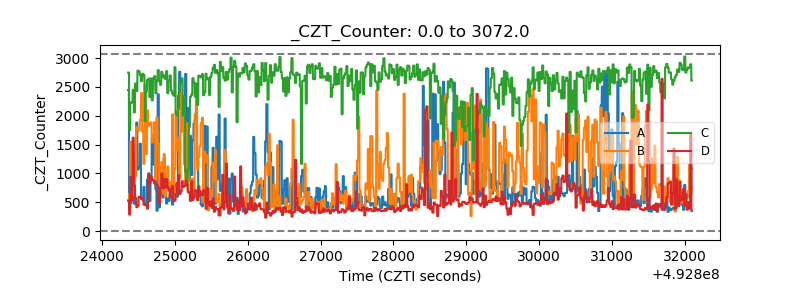 |
| +2.5 Volts monitor |  |
| +5 Volts monitor | 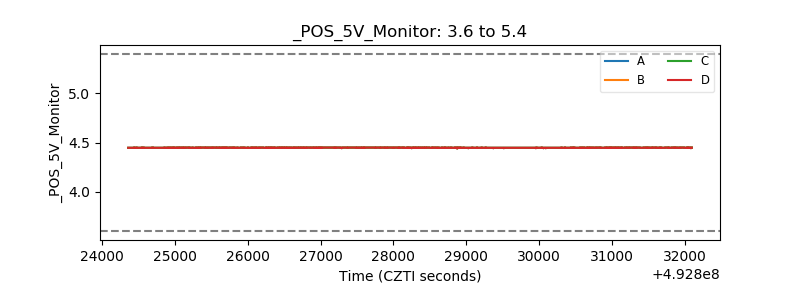 |
| _ROLL_ROT | 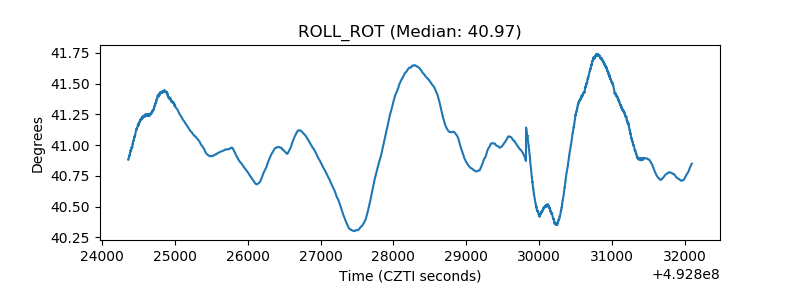 |
| _Roll_DEC | 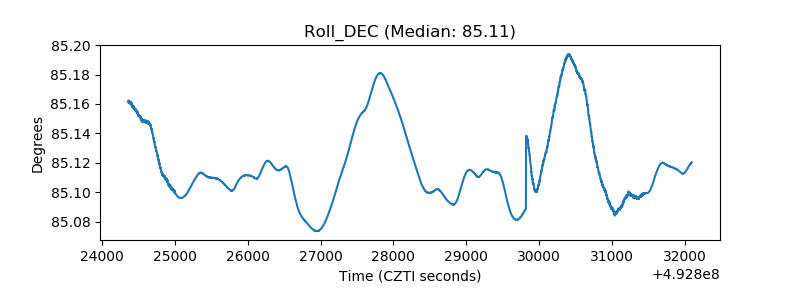 |
| _Roll_RA | 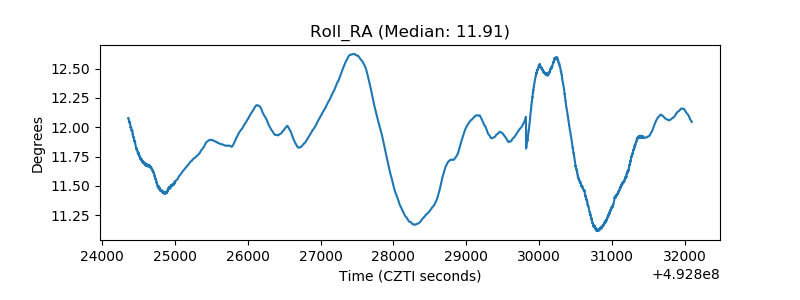 |
| Veto Counter | 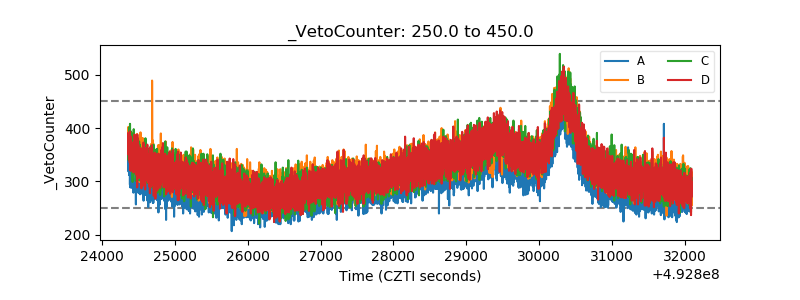 |