| Param | Original file | Final file |
|---|---|---|
| Filename | modeM0/AS1C09_011T09_9000006494_53437cztM0_level2.fits | modeM0/AS1C09_011T09_9000006494_53437cztM0_level2_quad_clean.evt |
| Size (bytes) | 375,606,720 | 33,111,360 |
| Size | 358.2 MB | 31.6 MB |
| Events in quadrant A | 2,483,226 | 259,625 |
| Events in quadrant B | 2,677,120 | 265,843 |
| Events in quadrant C | 6,824,159 | 37,436 |
| Events in quadrant D | 1,702,656 | 241,552 |
| Mode SS | |||
|---|---|---|---|
| Quadrant | BADHDUFLAG | Total packets | Discarded packets |
| A | 0 | 56 | 0 |
| B | 0 | 56 | 0 |
| C | 0 | 56 | 0 |
| D | 0 | 56 | 0 |
| Mode M0 | |||
|---|---|---|---|
| Quadrant | BADHDUFLAG | Total packets | Discarded packets |
| A | 0 | 9278 | 0 |
| B | 0 | 9903 | 0 |
| C | 0 | 22169 | 16 |
| D | 0 | 7009 | 0 |
| Quadrant | Total seconds | Saturated seconds | Saturation percentage |
|---|---|---|---|
| A | 2769 | 193 | 6.970025% |
| B | 2770 | 364 | 13.140794% |
| C | 2768 | 2415 | 87.247110% |
| D | 2770 | 63 | 2.274368% |
Noise dominated data is calculated using 1-second bins in cleaned event files. If a bin has >2000 counts, and if more than 50% of those come from <1% of pixels, then it is considered to be noise-dominated and hence unusable.
| Quadrant | # 1 sec bins | Bins with >0 counts | Bins with >2000 counts | High rate bins dominated by noise | Noise dominated (total time) | Noise dominated (detector-on time) | Marked lightcurve |
|---|---|---|---|---|---|---|---|
| A | 2769 | 2769 | 156 | 156 | 5.63% | 5.63% | 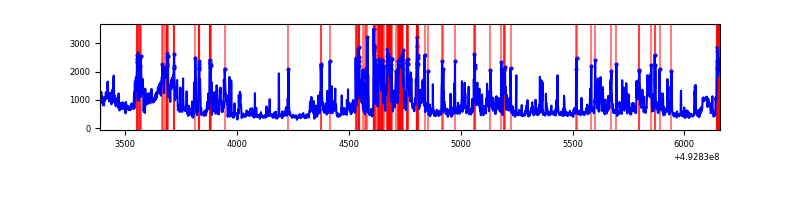 |
| B | 2770 | 2770 | 157 | 157 | 5.67% | 5.67% | 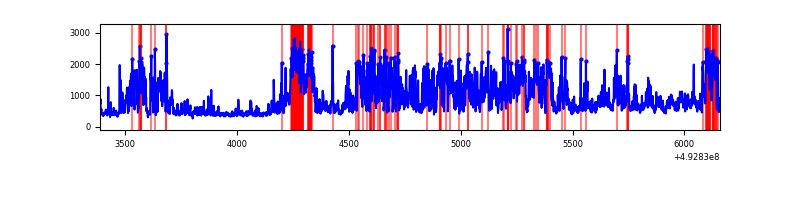 |
| C | 2770 | 2769 | 2347 | 2347 | 84.73% | 84.76% | 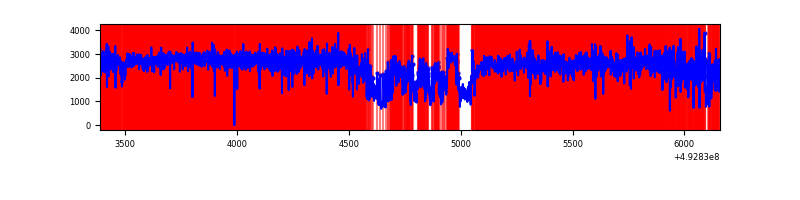 |
| D | 2770 | 2770 | 61 | 61 | 2.20% | 2.20% | 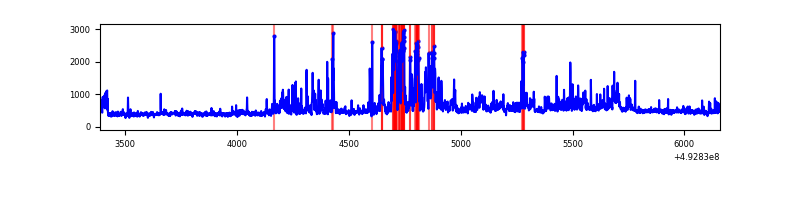 |
Top three noisy pixels from each quadrant. If the there are fewer than three noisy pixels in the level2.evt file, extra rows are filled as -1
| Pixel properties | Quadrant properties | ||||||
|---|---|---|---|---|---|---|---|
| Quadrant | DetID | PixID | Counts | Sigma | Mean | Median | Sigma |
| A | 15 | 174 | 433399 | 5740.23 | 295 | 287 | 75.5 |
| A | 3 | 63 | 411798 | 5453.94 | 295 | 287 | 75.5 |
| A | 3 | 78 | 154517 | 2044.08 | 295 | 287 | 75.5 |
| B | 4 | 171 | 851058 | 13524.57 | 287 | 278 | 62.9 |
| B | 4 | 206 | 271870 | 4317.41 | 287 | 278 | 62.9 |
| B | 5 | 185 | 172439 | 2736.79 | 287 | 278 | 62.9 |
| C | 7 | 64 | 3079716 | 84704.3 | 126 | 125 | 36.4 |
| C | 1 | 241 | 1993900 | 54838.88 | 126 | 125 | 36.4 |
| C | 15 | 224 | 587603 | 16158.61 | 126 | 125 | 36.4 |
| D | 2 | 249 | 169793 | 2003.58 | 294 | 281 | 84.6 |
| D | 0 | 18 | 101784 | 1199.74 | 294 | 281 | 84.6 |
| D | 13 | 153 | 85279 | 1004.65 | 294 | 281 | 84.6 |
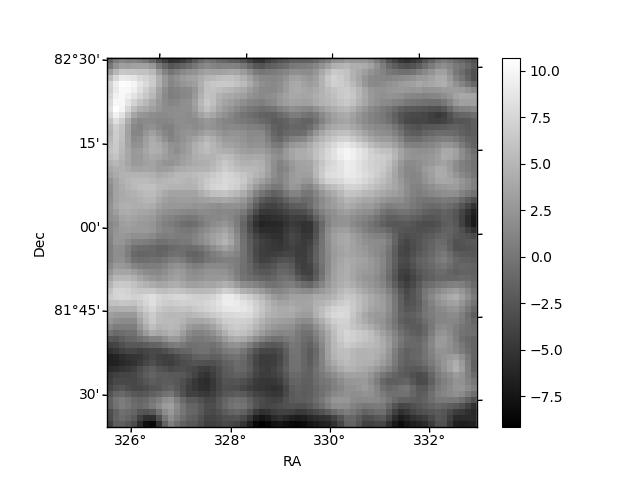
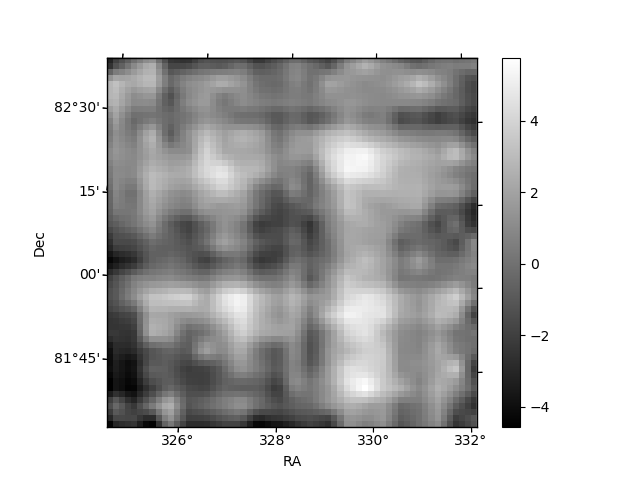
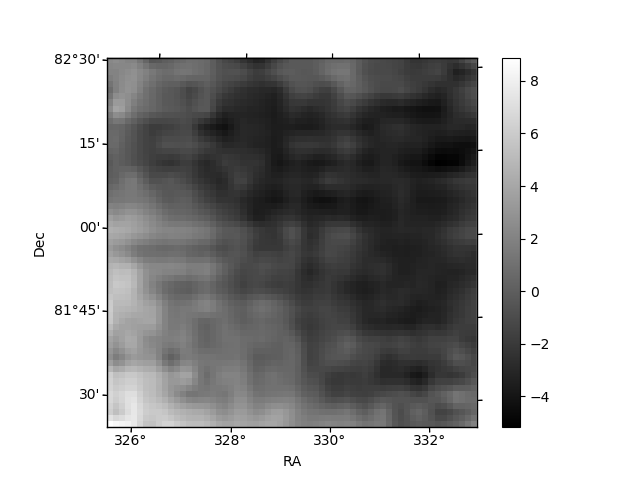
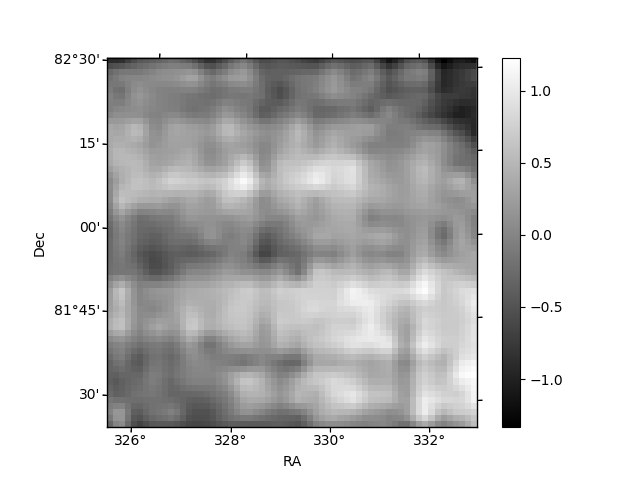
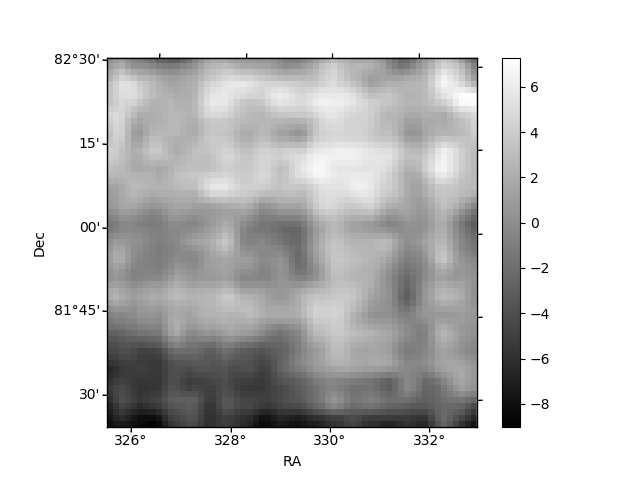
Histogram calculated using DETX and DETY for each event in the final _common_clean file
| Quadrant A | 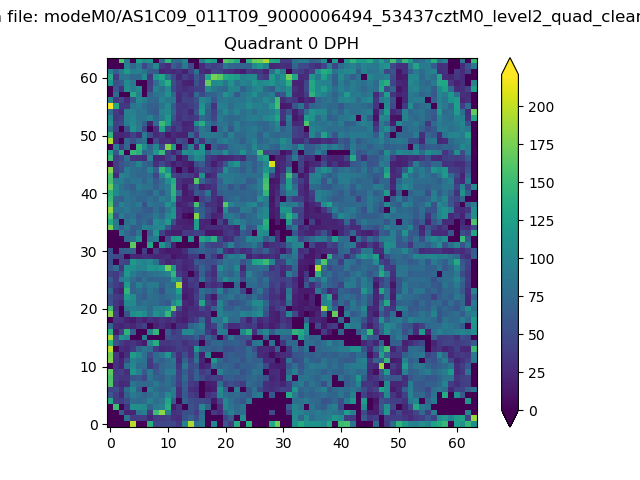 |
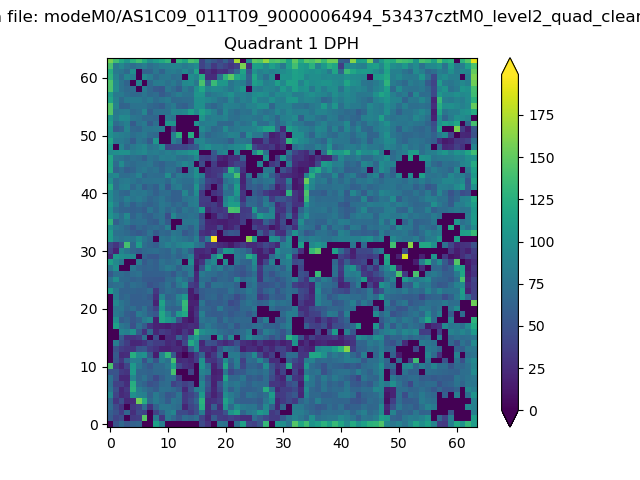 |
Quadrant B |
|---|---|---|---|
| Quadrant D | 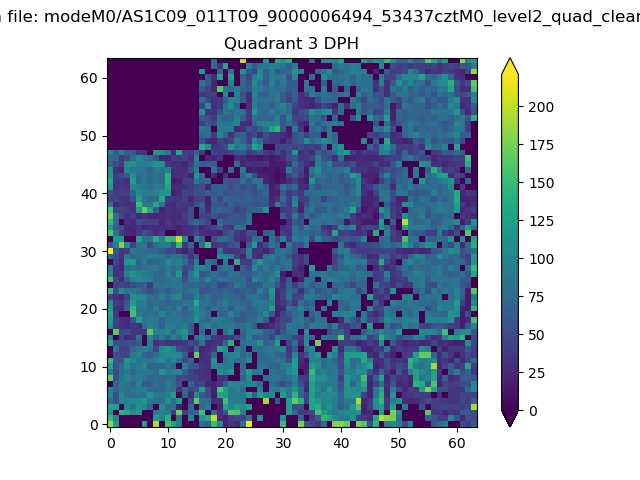 |
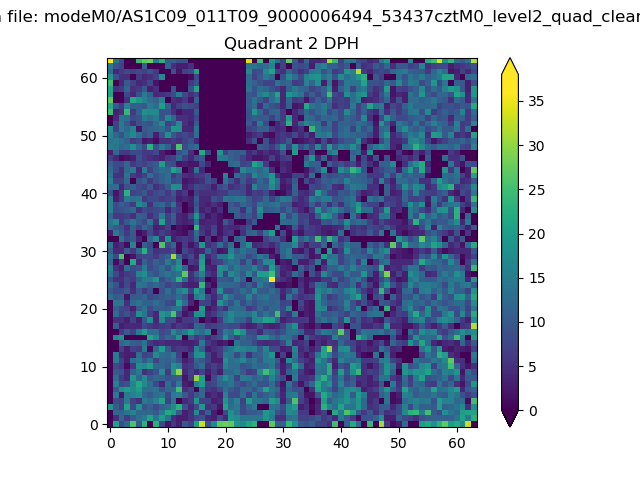 |
Quadrant C |
| Plot type | Count rate plots | Images |
|---|---|---|
| Comparison with Poisson distribution Blue bars denote a histogram of data divided into 1 sec bins. Red curve is a Poisson curve with rate = median count rate of data. |
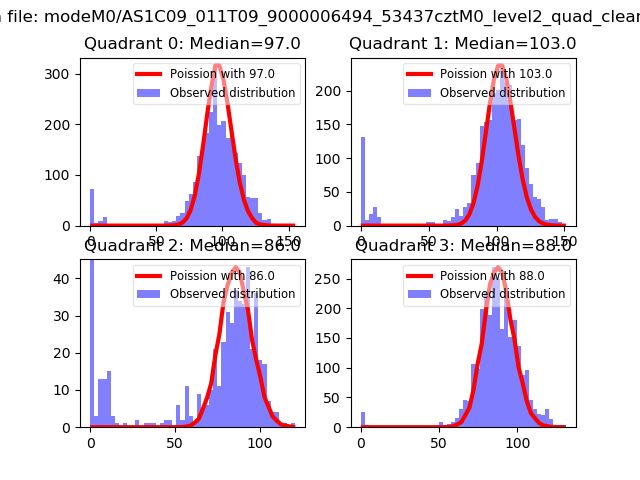 |
 |
| Quadrant-wise count rates Data is divided into 100 sec bins |
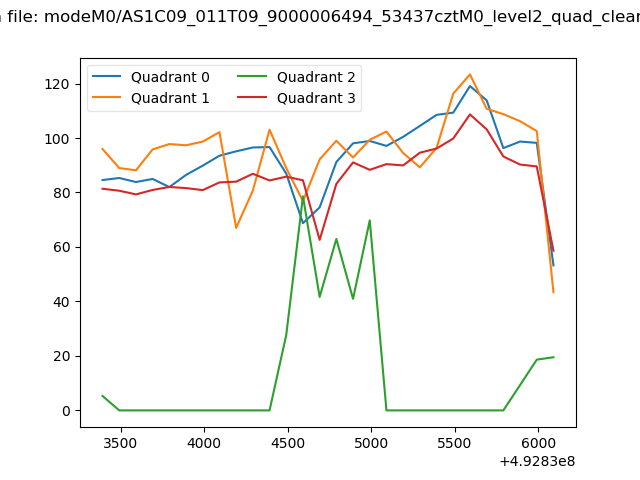 |
|
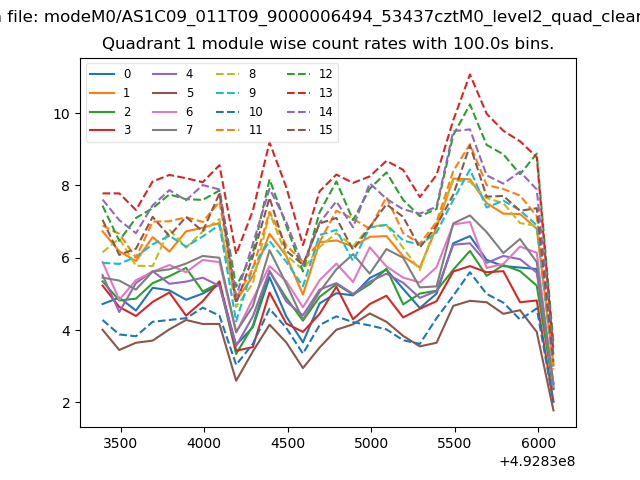
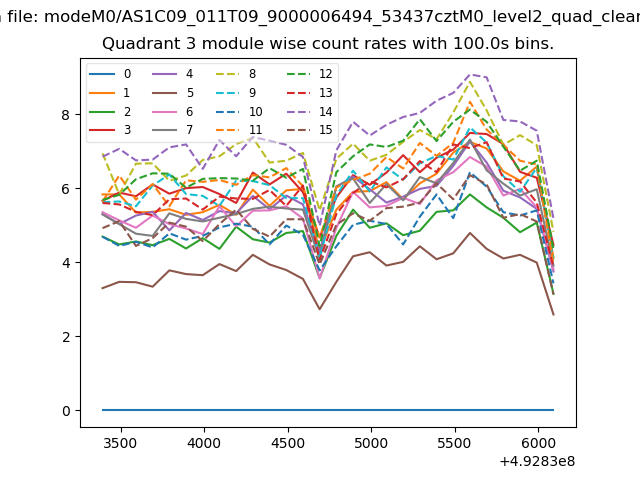
| Module-wise count rates for Quadrant A Data is divided into 100 sec bins |
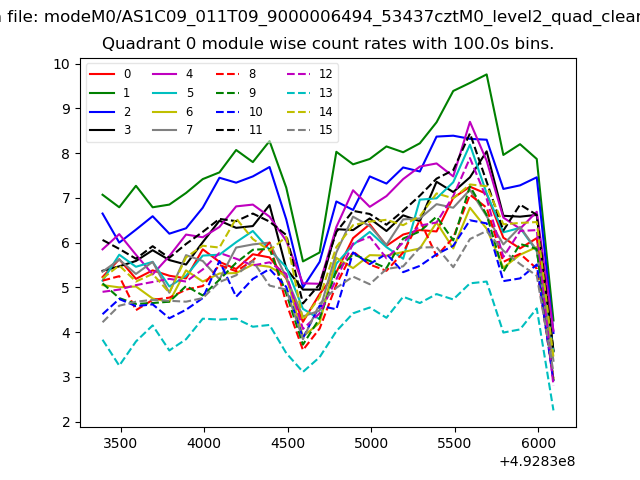 |
 |
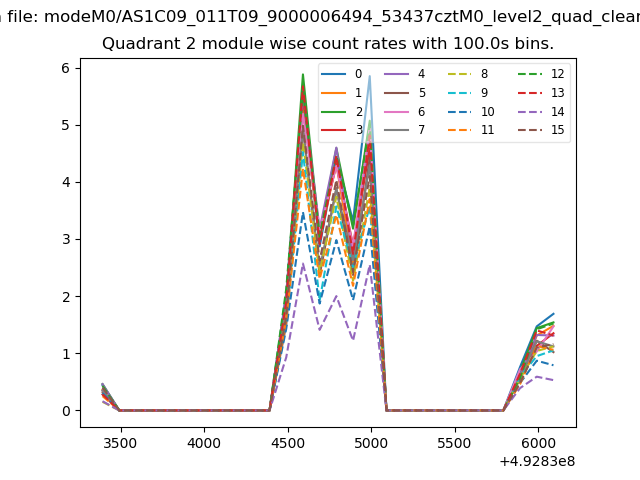
| Module-wise count rates for Quadrant B Data is divided into 100 sec bins |
 |
 |
| Module-wise count rates for Quadrant C Data is divided into 100 sec bins |
 |
 |
| Module-wise count rates for Quadrant D Data is divided into 100 sec bins |
 |
 |
| Parameter | Plot |
|---|---|
| CZT HV Monitor |  |
| D_VDD | 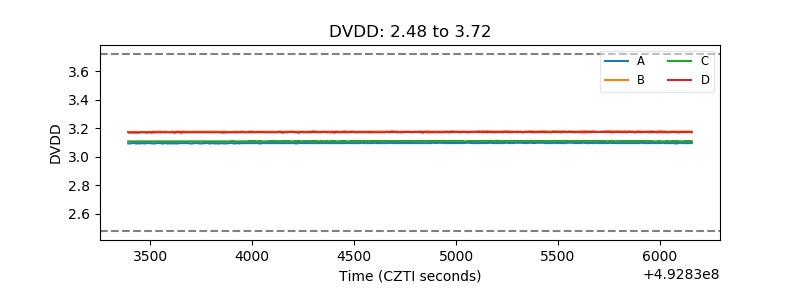 |
| Temperature 1 | 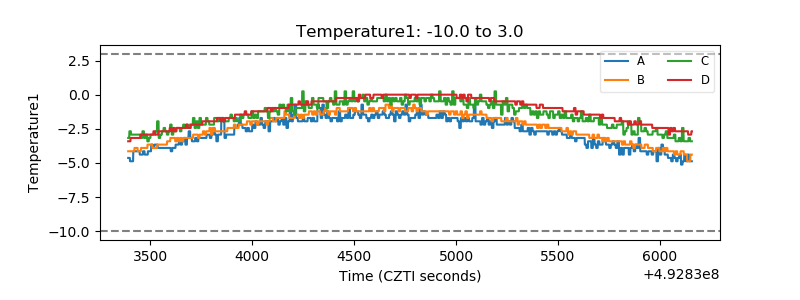 |
| Veto HV Monitor | 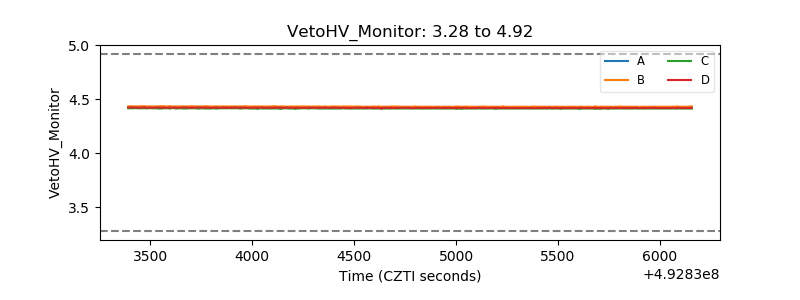 |
| Veto LLD | 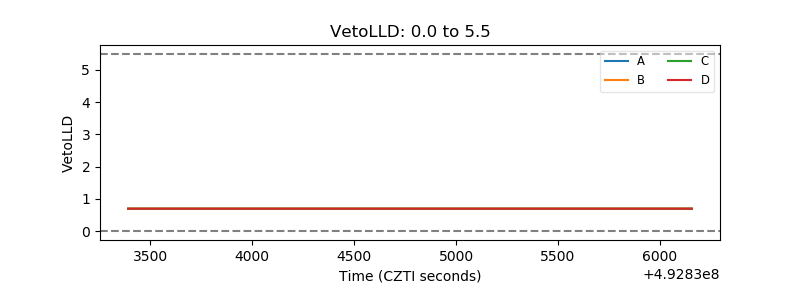 |
| Alpha Counter | 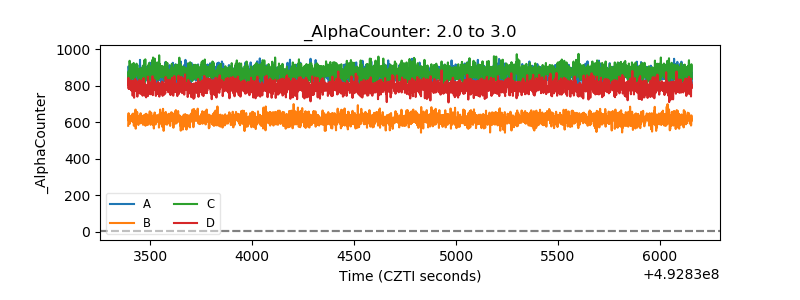 |
| _CPM_Rate | 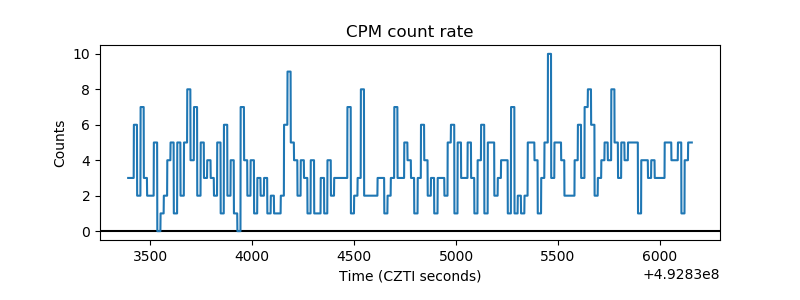 |
| CZT Counter | 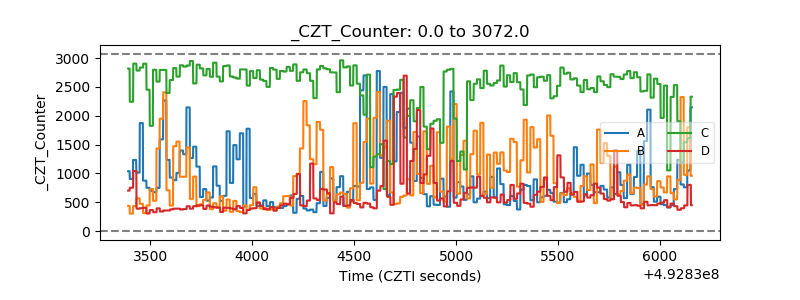 |
| +2.5 Volts monitor |  |
| +5 Volts monitor | 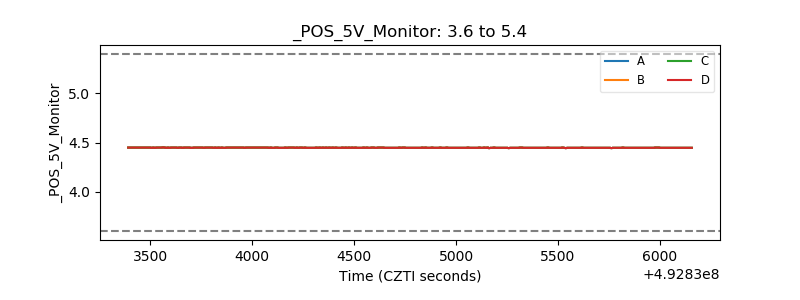 |
| _ROLL_ROT | 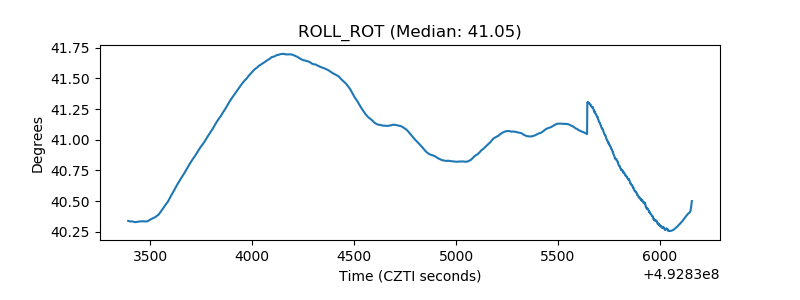 |
| _Roll_DEC | 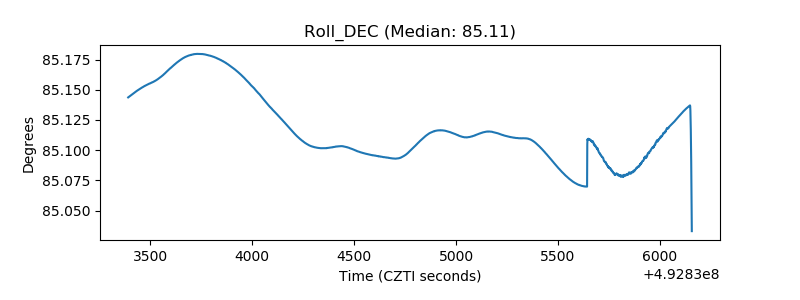 |
| _Roll_RA | 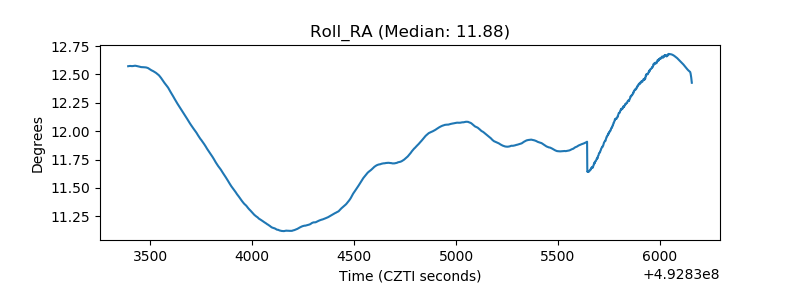 |
| Veto Counter | 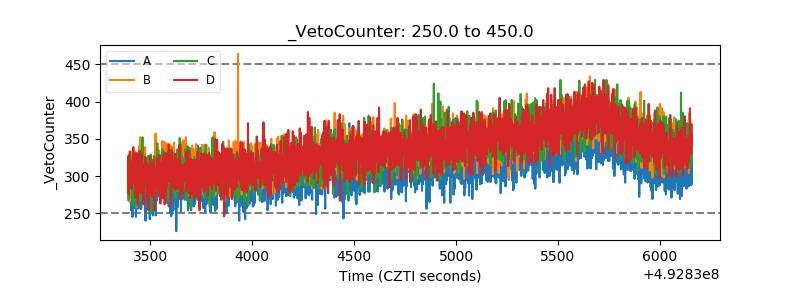 |