| Param | Original file | Final file |
|---|---|---|
| Filename | modeM0/AS1A14_002T06_9000006496cztM0_level2.fits | modeM0/AS1A14_002T06_9000006496cztM0_level2_quad_clean.evt |
| Size (bytes) | 1,896,289,920 | 608,273,280 |
| Size | 1.8 GB | 580.1 MB |
| Events in quadrant A | 11,133,164 | 546,234 |
| Events in quadrant B | 11,645,584 | 675,699 |
| Events in quadrant C | 7,658,822 | 114,011 |
| Events in quadrant D | 10,380,658 | 550,737 |
| Mode M9 | |||
|---|---|---|---|
| Quadrant | BADHDUFLAG | Total packets | Discarded packets |
| A | 0 | 297 | 0 |
| B | 0 | 297 | 0 |
| C | 0 | 297 | 0 |
| D | 0 | 297 | 0 |
| Mode SS | |||
|---|---|---|---|
| Quadrant | BADHDUFLAG | Total packets | Discarded packets |
| A | 0 | 4894 | 0 |
| B | 0 | 4894 | 0 |
| C | 0 | 4894 | 0 |
| D | 0 | 4894 | 0 |
| Mode M0 | |||
|---|---|---|---|
| Quadrant | BADHDUFLAG | Total packets | Discarded packets |
| A | 0 | 958823 | 0 |
| B | 0 | 609284 | 0 |
| C | 0 | 1488738 | 0 |
| D | 0 | 623127 | 0 |
| Quadrant | Total seconds | Saturated seconds | Saturation percentage |
|---|---|---|---|
| A | 241102 | 51325 | 21.287671% |
| B | 241100 | 9701 | 4.023642% |
| C | 241102 | 129445 | 53.688895% |
| D | 241100 | 9614 | 3.987557% |
Noise dominated data is calculated using 1-second bins in cleaned event files. If a bin has >2000 counts, and if more than 50% of those come from <1% of pixels, then it is considered to be noise-dominated and hence unusable.
| Quadrant | # 1 sec bins | Bins with >0 counts | Bins with >2000 counts | High rate bins dominated by noise | Noise dominated (total time) | Noise dominated (detector-on time) | Marked lightcurve |
|---|---|---|---|---|---|---|---|
| A | 288943 | 240263 | 0 | 0 | 0.00% | 0.00% | 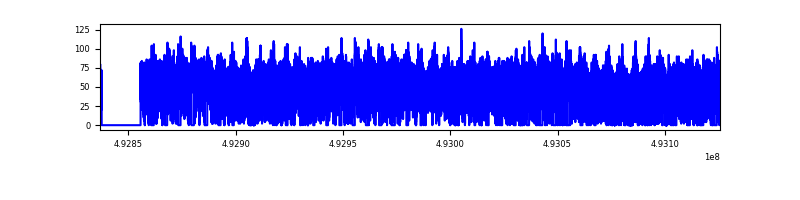 |
| B | 288943 | 241027 | 0 | 0 | 0.00% | 0.00% | 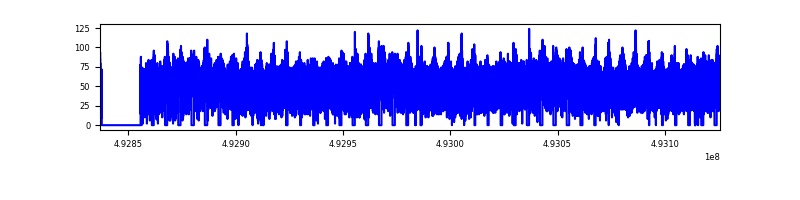 |
| C | 288942 | 235077 | 0 | 0 | 0.00% | 0.00% | 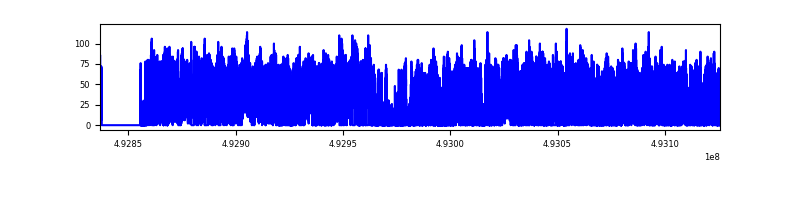 |
| D | 288942 | 240869 | 0 | 0 | 0.00% | 0.00% | 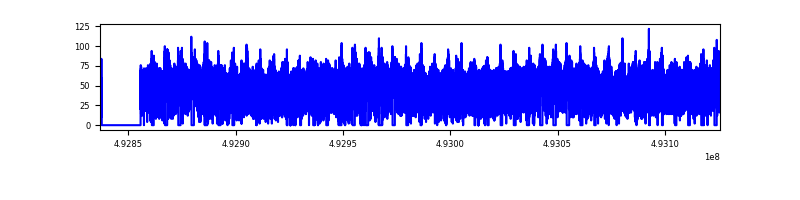 |
Top three noisy pixels from each quadrant. If the there are fewer than three noisy pixels in the level2.evt file, extra rows are filled as -1
| Pixel properties | Quadrant properties | ||||||
|---|---|---|---|---|---|---|---|
| Quadrant | DetID | PixID | Counts | Sigma | Mean | Median | Sigma |
| A | 14 | 188 | 12389 | 9.92 | 2931 | 2697 | 977.5 |
| A | 9 | 255 | 11607 | 9.12 | 2931 | 2697 | 977.5 |
| A | 14 | 204 | 9835 | 7.3 | 2931 | 2697 | 977.5 |
| B | 2 | 9 | 13243 | 14.27 | 3084 | 2913 | 724.0 |
| B | 2 | 8 | 12078 | 12.66 | 3084 | 2913 | 724.0 |
| B | 3 | 25 | 9409 | 8.97 | 3084 | 2913 | 724.0 |
| C | 15 | 175 | 6219 | 6.21 | 2055 | 1867 | 701.2 |
| C | 3 | 203 | 5960 | 5.84 | 2055 | 1867 | 701.2 |
| C | 2 | 31 | 5958 | 5.83 | 2055 | 1867 | 701.2 |
| D | 6 | 218 | 12758 | 10.26 | 2970 | 2649 | 985.1 |
| D | 15 | 11 | 10034 | 7.5 | 2970 | 2649 | 985.1 |
| D | 8 | 12 | 9249 | 6.7 | 2970 | 2649 | 985.1 |
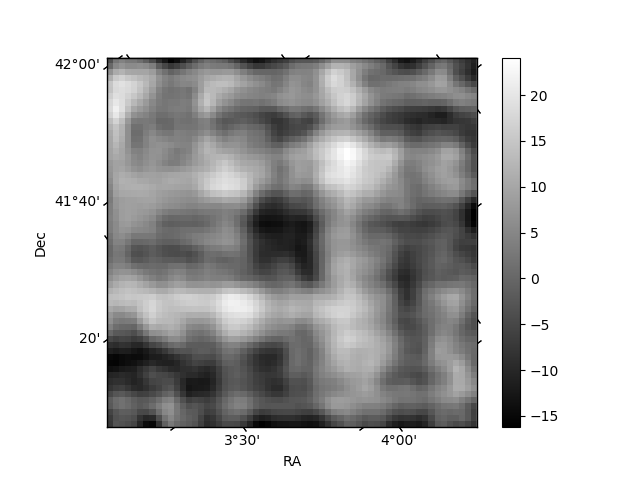
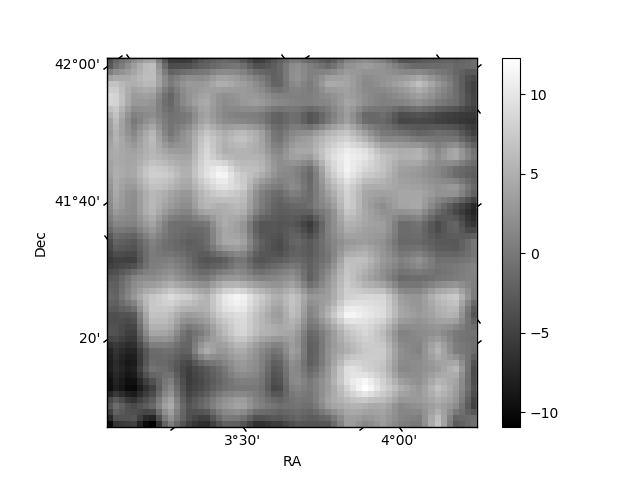
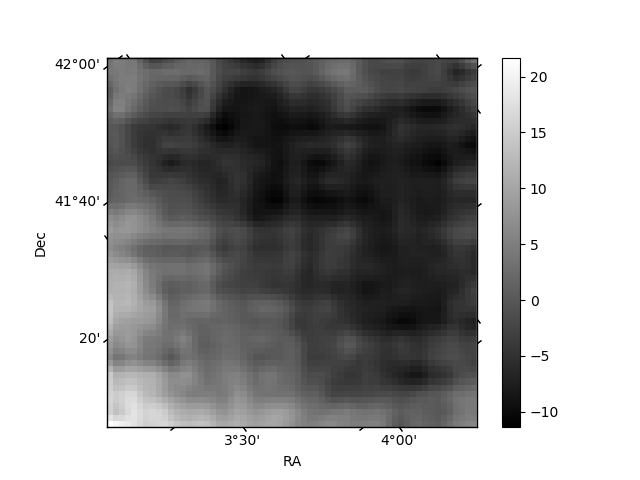
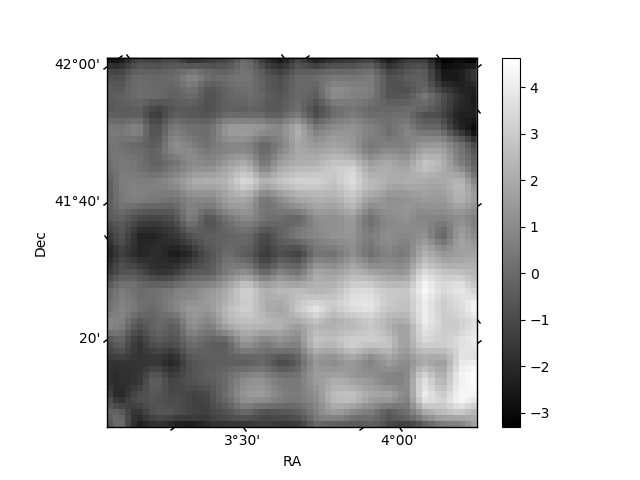
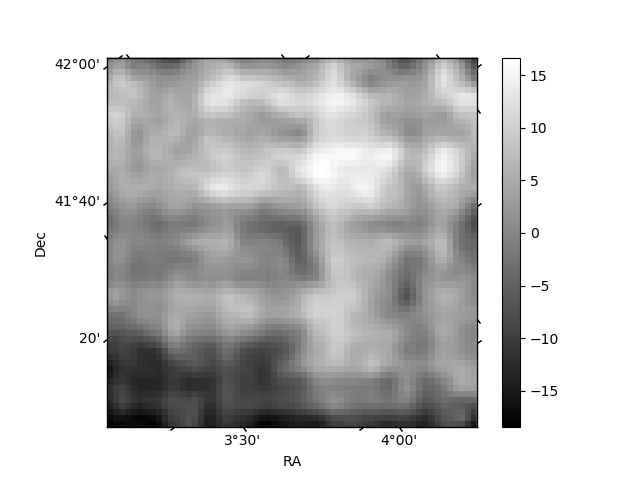
Histogram calculated using DETX and DETY for each event in the final _common_clean file
| Quadrant A | 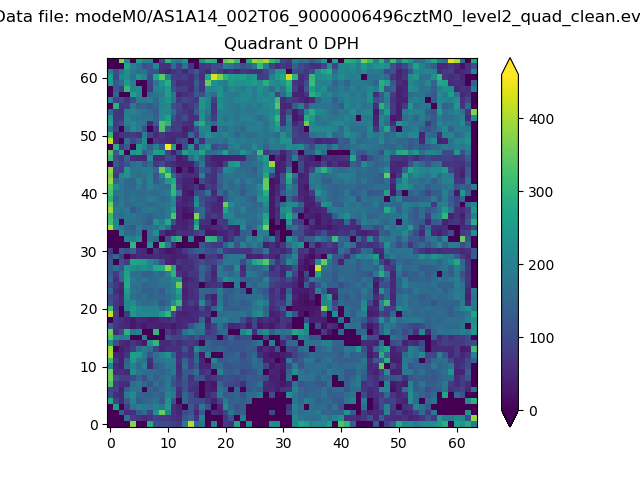 |
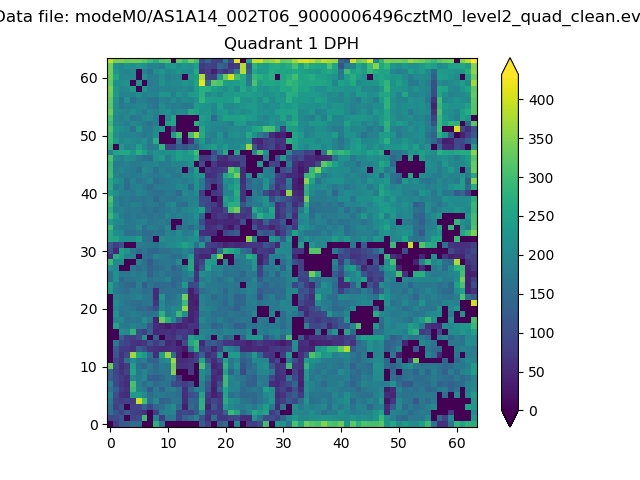 |
Quadrant B |
|---|---|---|---|
| Quadrant D | 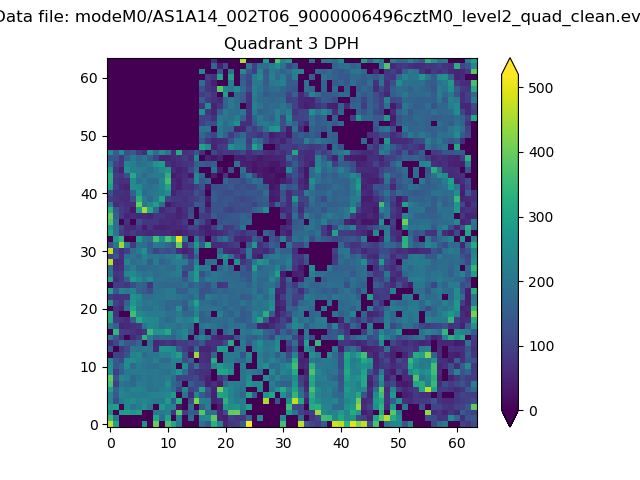 |
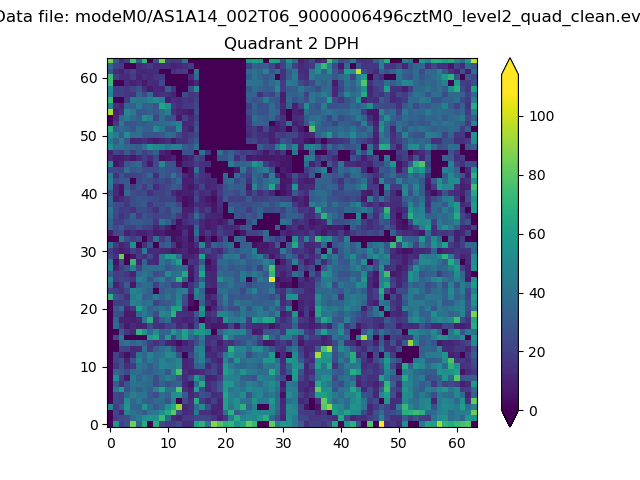 |
Quadrant C |
| Plot type | Count rate plots | Images |
|---|---|---|
| Comparison with Poisson distribution Blue bars denote a histogram of data divided into 1 sec bins. Red curve is a Poisson curve with rate = median count rate of data. |
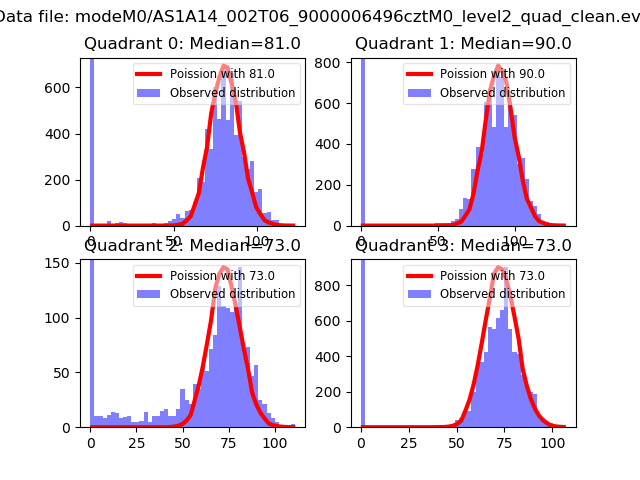 |
 |
| Quadrant-wise count rates Data is divided into 100 sec bins |
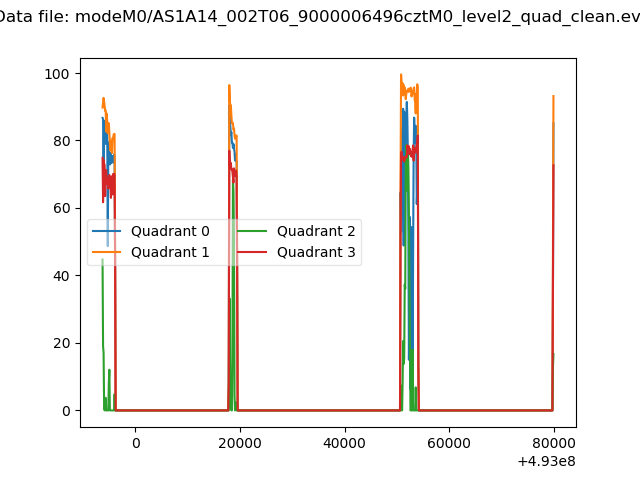 |
|
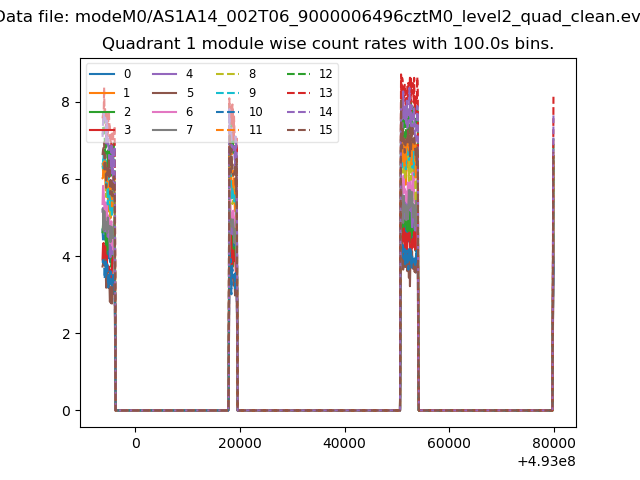
| Module-wise count rates for Quadrant A Data is divided into 100 sec bins |
 |
 |
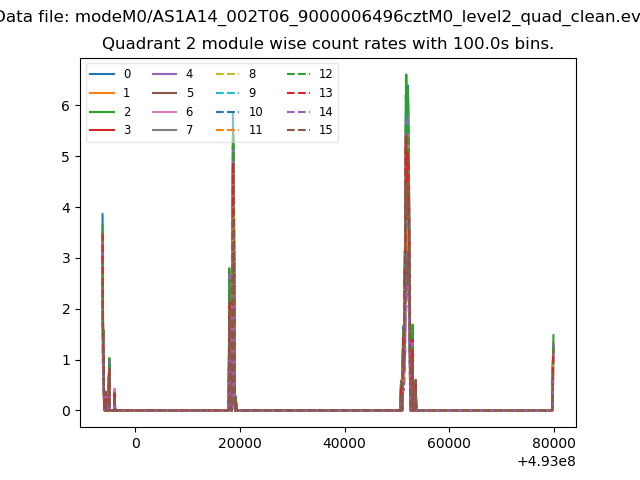
| Module-wise count rates for Quadrant B Data is divided into 100 sec bins |
 |
 |
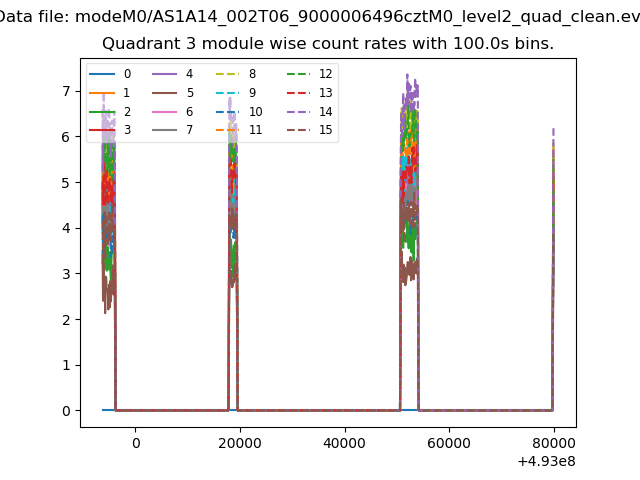
| Module-wise count rates for Quadrant C Data is divided into 100 sec bins |
 |
 |
| Module-wise count rates for Quadrant D Data is divided into 100 sec bins |
 |
 |
| Parameter | Plot |
|---|---|
| CZT HV Monitor | 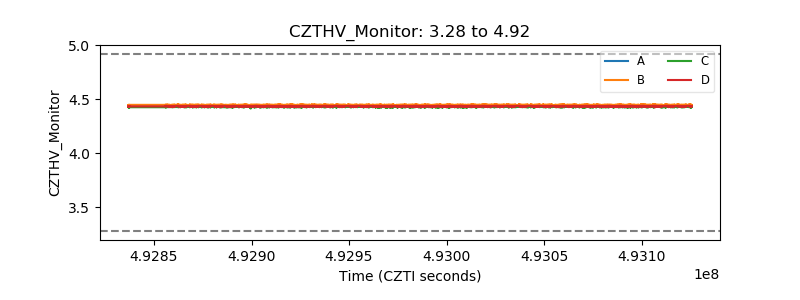 |
| D_VDD | 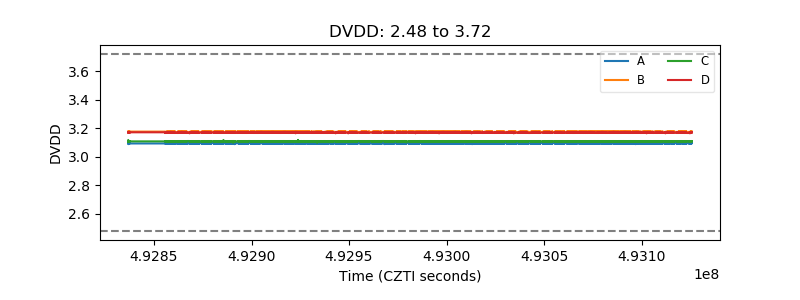 |
| Temperature 1 | 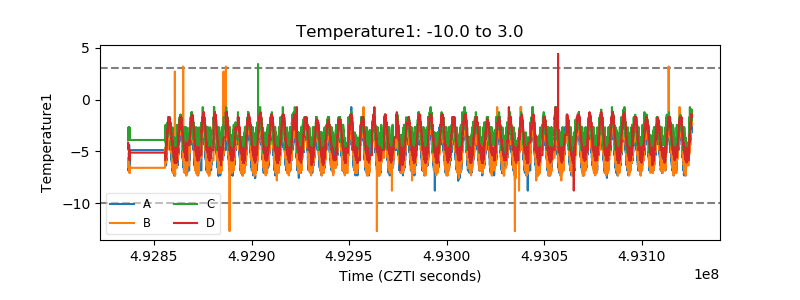 |
| Veto HV Monitor | 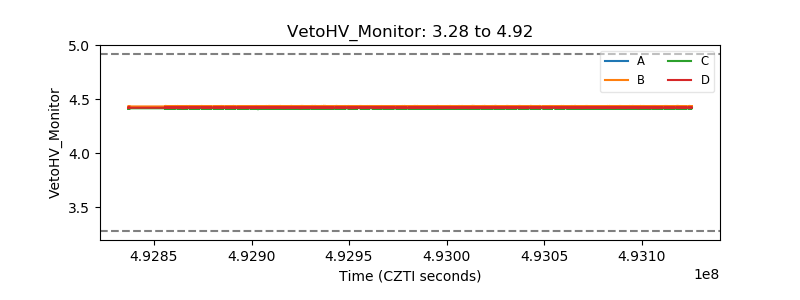 |
| Veto LLD | 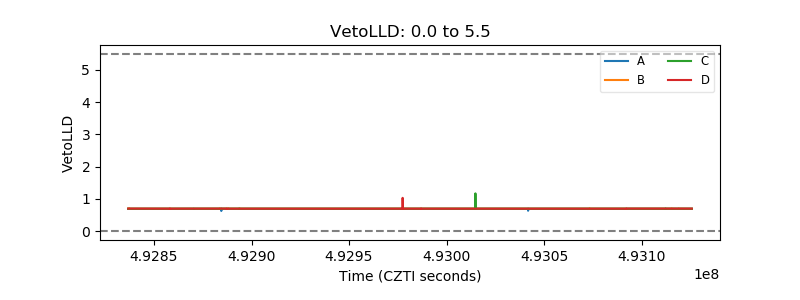 |
| Alpha Counter | 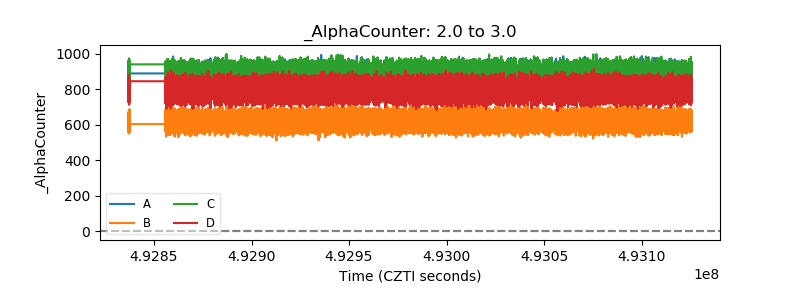 |
| _CPM_Rate | 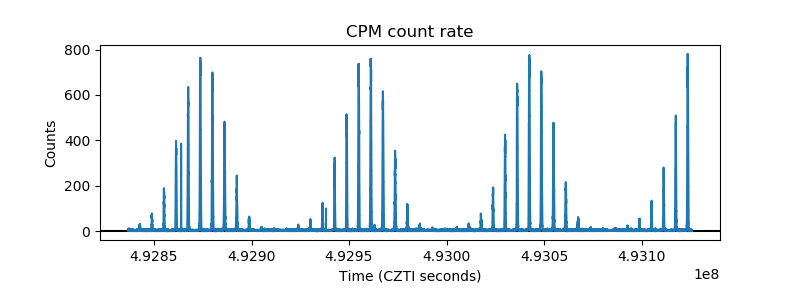 |
| CZT Counter | 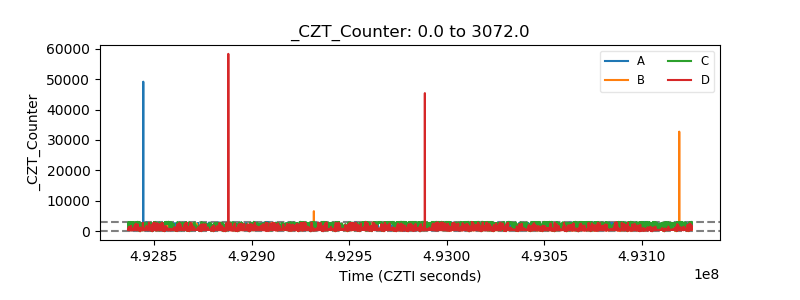 |
| +2.5 Volts monitor | 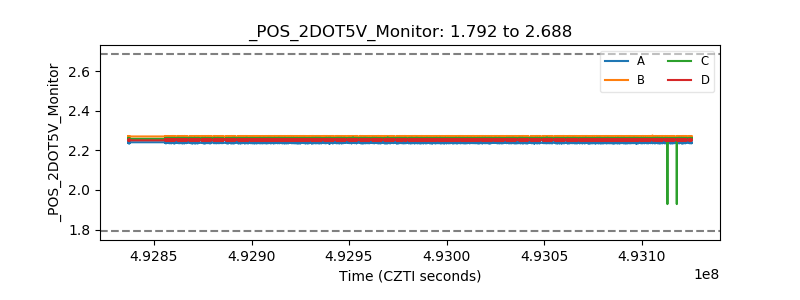 |
| +5 Volts monitor | 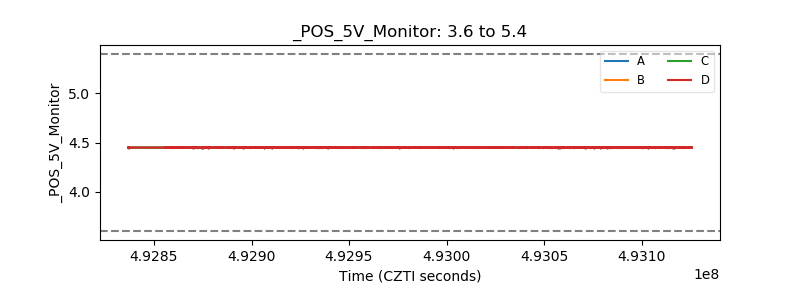 |
| _ROLL_ROT | 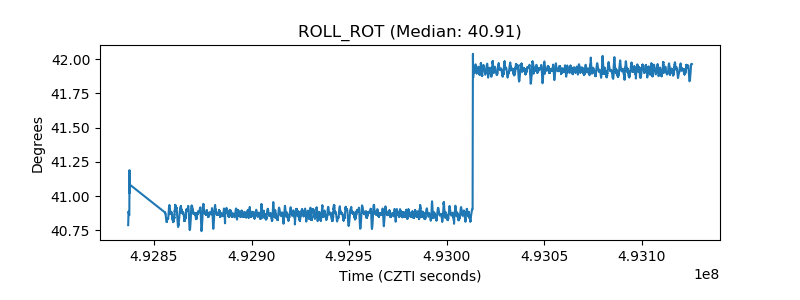 |
| _Roll_DEC | 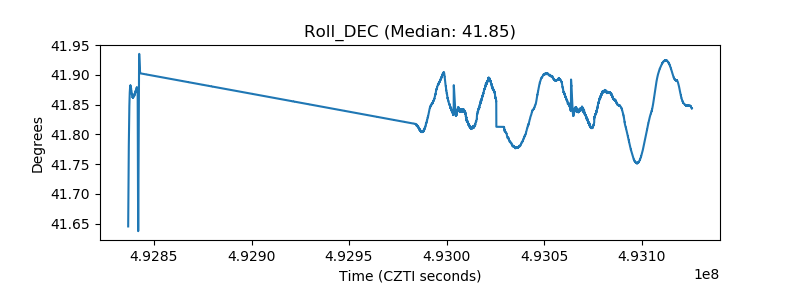 |
| _Roll_RA |  |
| Veto Counter | 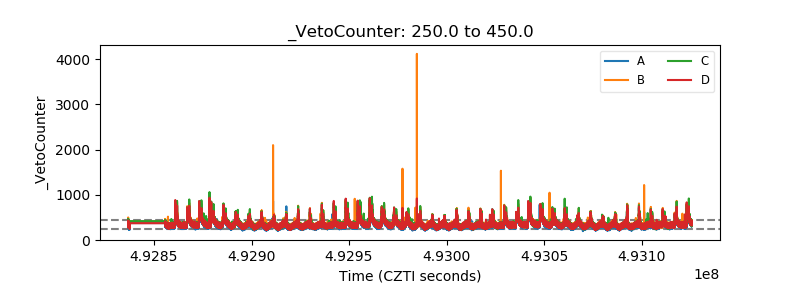 |