| Param | Original file | Final file |
|---|---|---|
| Filename | modeM0/AS1A14_002T06_9000006496_53435cztM0_level2.fits | modeM0/AS1A14_002T06_9000006496_53435cztM0_level2_quad_clean.evt |
| Size (bytes) | 1,081,500,480 | 134,452,800 |
| Size | 1.0 GB | 128.2 MB |
| Events in quadrant A | 9,380,581 | 883,922 |
| Events in quadrant B | 7,452,118 | 1,030,473 |
| Events in quadrant C | 16,263,700 | 568,492 |
| Events in quadrant D | 6,123,047 | 858,312 |
| Mode M9 | |||
|---|---|---|---|
| Quadrant | BADHDUFLAG | Total packets | Discarded packets |
| A | 0 | 3 | 0 |
| B | 0 | 3 | 0 |
| C | 0 | 3 | 0 |
| D | 0 | 3 | 0 |
| Mode SS | |||
|---|---|---|---|
| Quadrant | BADHDUFLAG | Total packets | Discarded packets |
| A | 0 | 212 | 0 |
| B | 0 | 212 | 0 |
| C | 0 | 212 | 0 |
| D | 0 | 212 | 0 |
| Mode M0 | |||
|---|---|---|---|
| Quadrant | BADHDUFLAG | Total packets | Discarded packets |
| A | 0 | 35293 | 1 |
| B | 0 | 29391 | 1 |
| C | 0 | 55578 | 1 |
| D | 0 | 25826 | 1 |
| Quadrant | Total seconds | Saturated seconds | Saturation percentage |
|---|---|---|---|
| A | 10527 | 1302 | 12.368196% |
| B | 10527 | 546 | 5.186663% |
| C | 10527 | 4277 | 40.628859% |
| D | 10527 | 300 | 2.849815% |
Noise dominated data is calculated using 1-second bins in cleaned event files. If a bin has >2000 counts, and if more than 50% of those come from <1% of pixels, then it is considered to be noise-dominated and hence unusable.
| Quadrant | # 1 sec bins | Bins with >0 counts | Bins with >2000 counts | High rate bins dominated by noise | Noise dominated (total time) | Noise dominated (detector-on time) | Marked lightcurve |
|---|---|---|---|---|---|---|---|
| A | 10877 | 10528 | 1093 | 1093 | 10.05% | 10.38% | 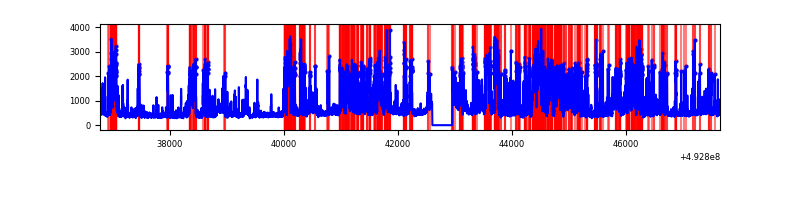 |
| B | 10877 | 10528 | 285 | 285 | 2.62% | 2.71% | 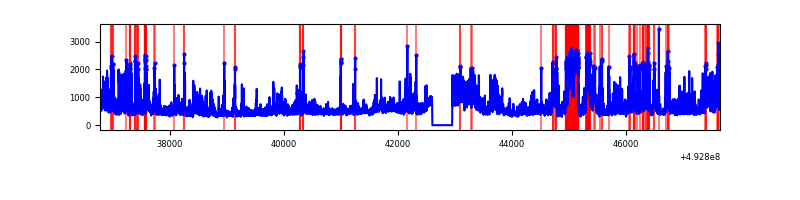 |
| C | 10877 | 10528 | 4083 | 4083 | 37.54% | 38.78% | 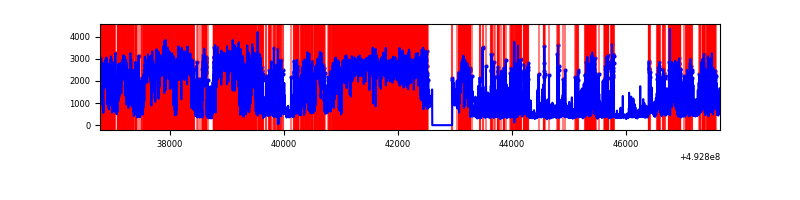 |
| D | 10877 | 10528 | 229 | 229 | 2.11% | 2.18% | 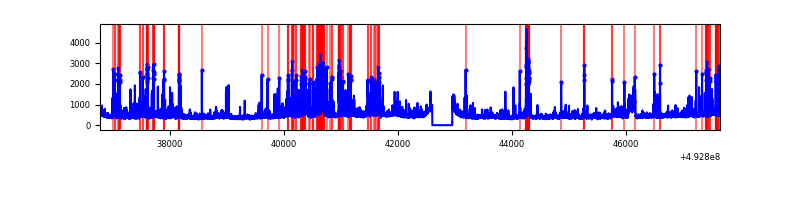 |
Top three noisy pixels from each quadrant. If the there are fewer than three noisy pixels in the level2.evt file, extra rows are filled as -1
| Pixel properties | Quadrant properties | ||||||
|---|---|---|---|---|---|---|---|
| Quadrant | DetID | PixID | Counts | Sigma | Mean | Median | Sigma |
| A | 15 | 174 | 3594882 | 13744.68 | 1063 | 1038 | 261.5 |
| A | 3 | 63 | 845671 | 3230.3 | 1063 | 1038 | 261.5 |
| A | 0 | 8 | 262162 | 998.67 | 1063 | 1038 | 261.5 |
| B | 10 | 254 | 1029477 | 4365.06 | 1095 | 1058 | 235.6 |
| B | 4 | 171 | 753713 | 3194.6 | 1095 | 1058 | 235.6 |
| B | 4 | 206 | 398731 | 1687.9 | 1095 | 1058 | 235.6 |
| C | 1 | 241 | 8726050 | 38267.83 | 831 | 824 | 228.0 |
| C | 15 | 224 | 2561102 | 11229.08 | 831 | 824 | 228.0 |
| C | 9 | 38 | 711271 | 3115.94 | 831 | 824 | 228.0 |
| D | 2 | 252 | 499684 | 1645.33 | 1067 | 1020 | 303.1 |
| D | 2 | 120 | 353413 | 1162.71 | 1067 | 1020 | 303.1 |
| D | 2 | 153 | 166785 | 546.94 | 1067 | 1020 | 303.1 |
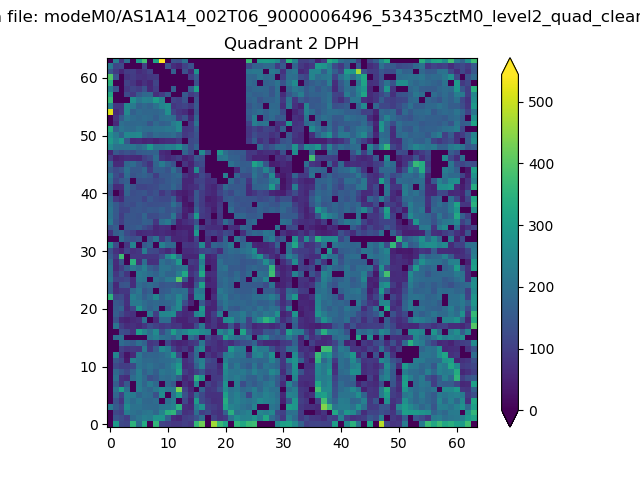
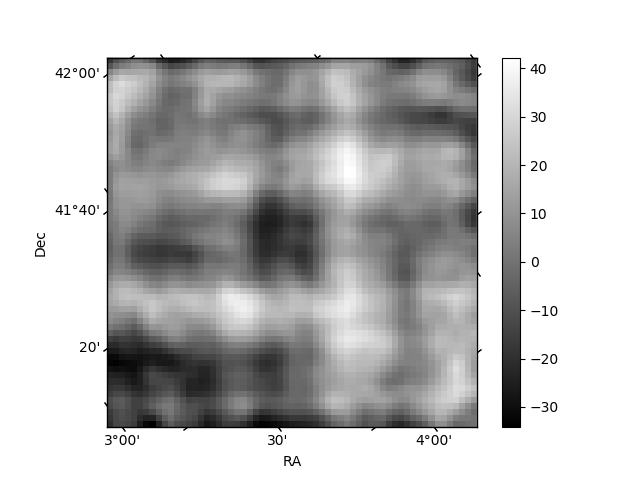
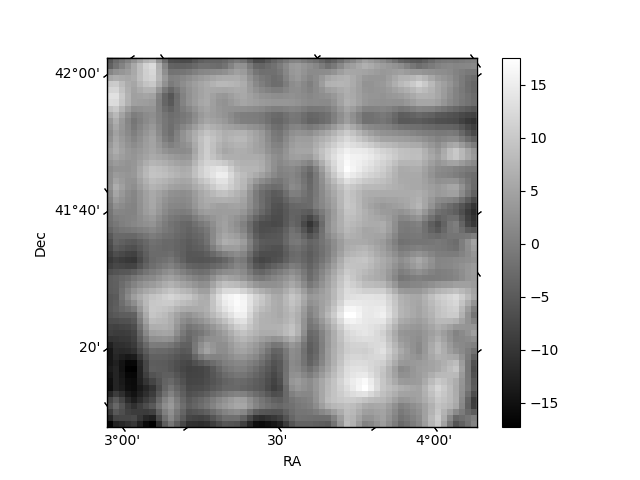
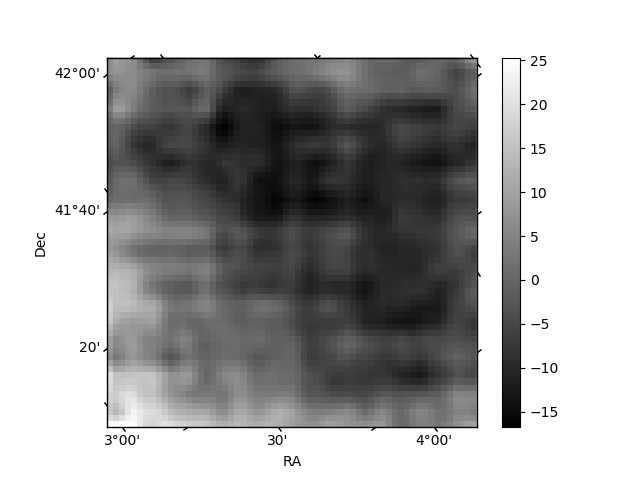
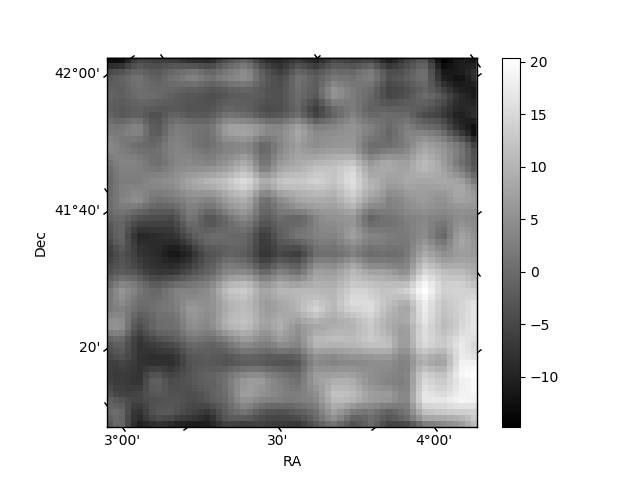
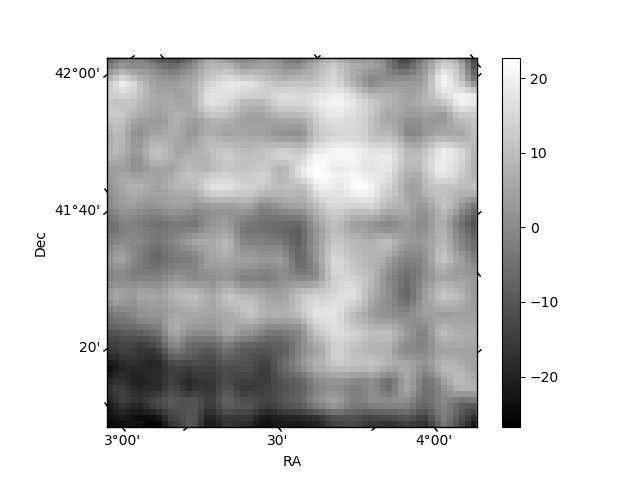
Histogram calculated using DETX and DETY for each event in the final _common_clean file
| Quadrant A | 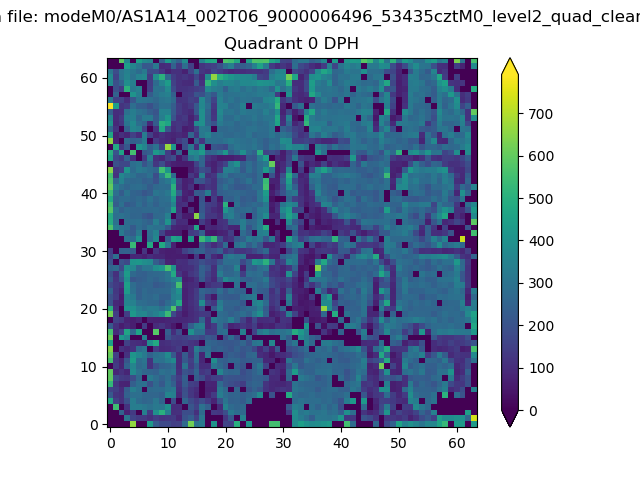 |
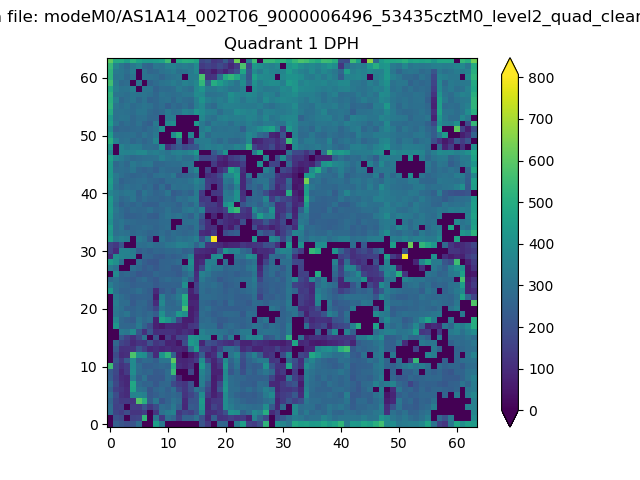 |
Quadrant B |
|---|---|---|---|
| Quadrant D | 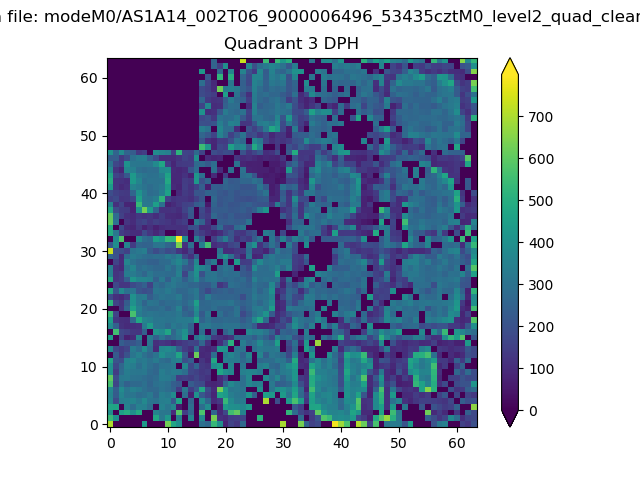 |
 |
Quadrant C |
| Plot type | Count rate plots | Images |
|---|---|---|
| Comparison with Poisson distribution Blue bars denote a histogram of data divided into 1 sec bins. Red curve is a Poisson curve with rate = median count rate of data. |
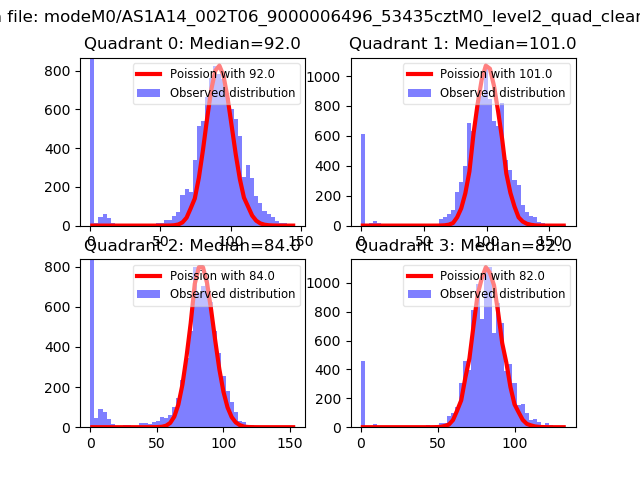 |
 |
| Quadrant-wise count rates Data is divided into 100 sec bins |
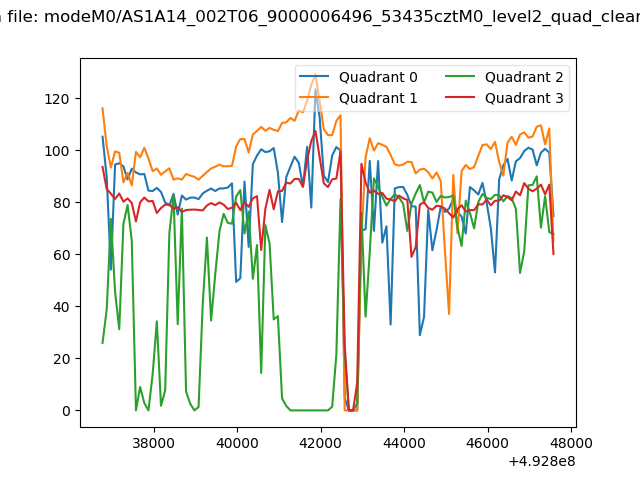 |
|
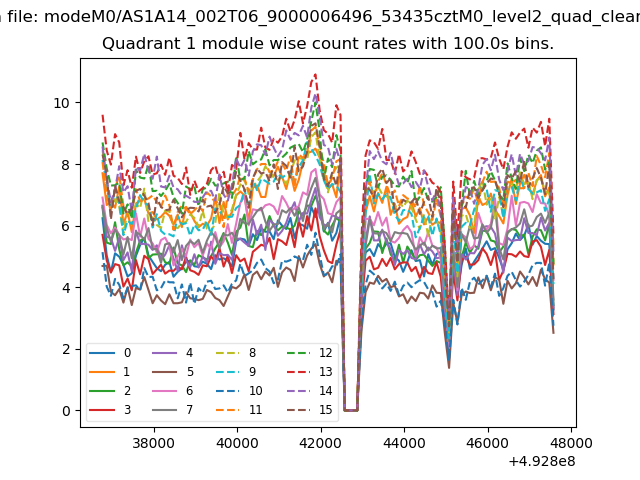
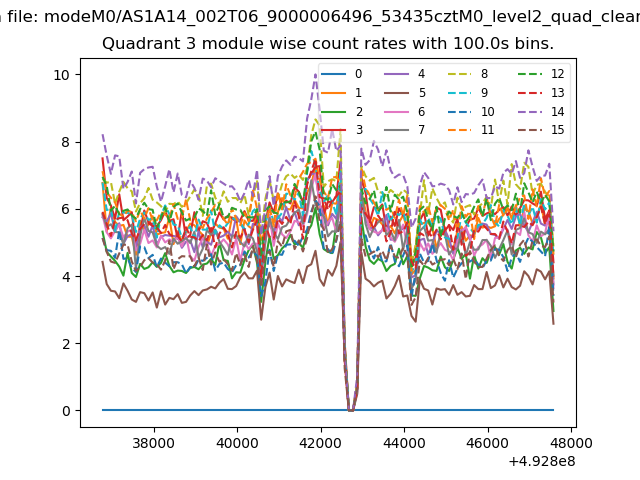
| Module-wise count rates for Quadrant A Data is divided into 100 sec bins |
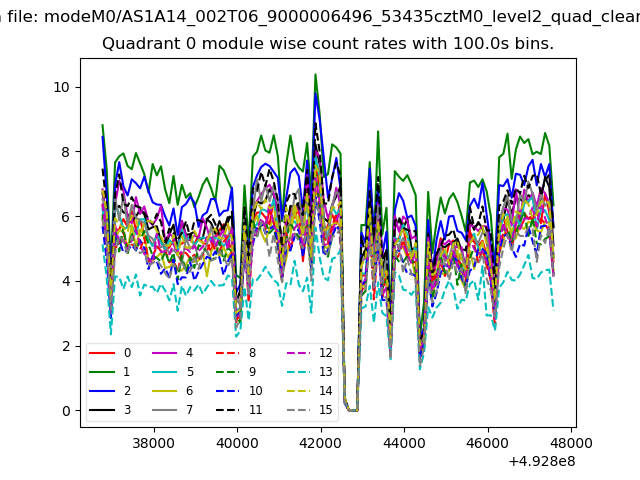 |
 |
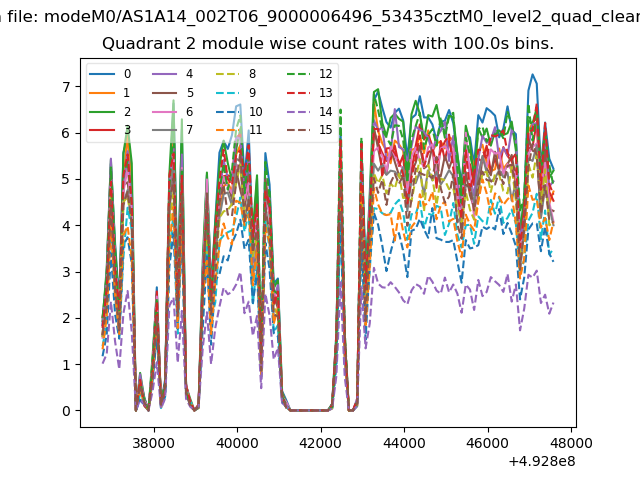
| Module-wise count rates for Quadrant B Data is divided into 100 sec bins |
 |
 |
| Module-wise count rates for Quadrant C Data is divided into 100 sec bins |
 |
 |
| Module-wise count rates for Quadrant D Data is divided into 100 sec bins |
 |
 |
| Parameter | Plot |
|---|---|
| CZT HV Monitor | 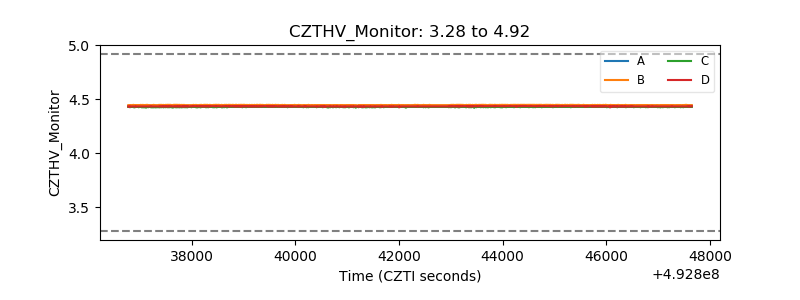 |
| D_VDD | 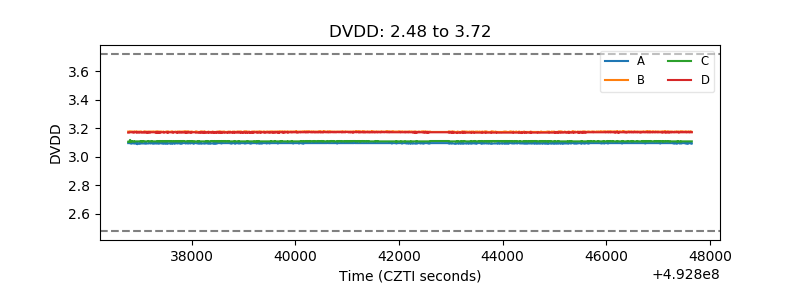 |
| Temperature 1 | 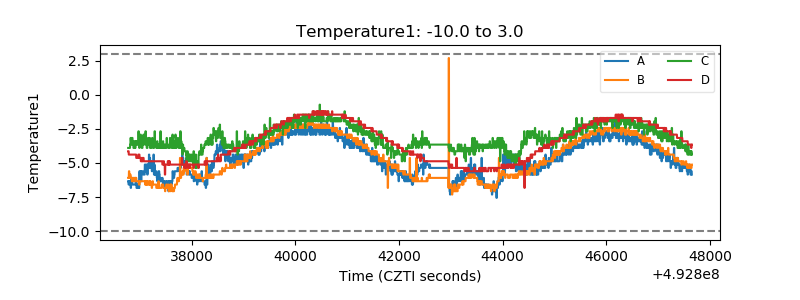 |
| Veto HV Monitor | 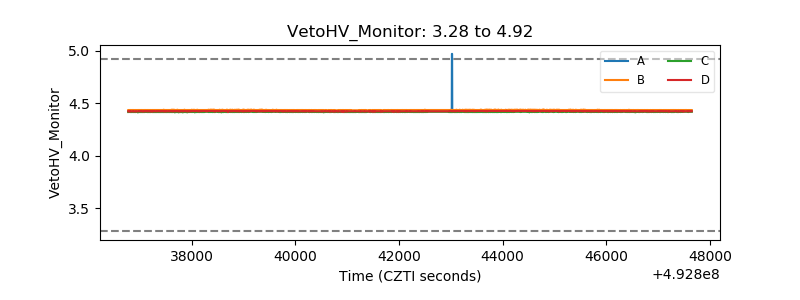 |
| Veto LLD | 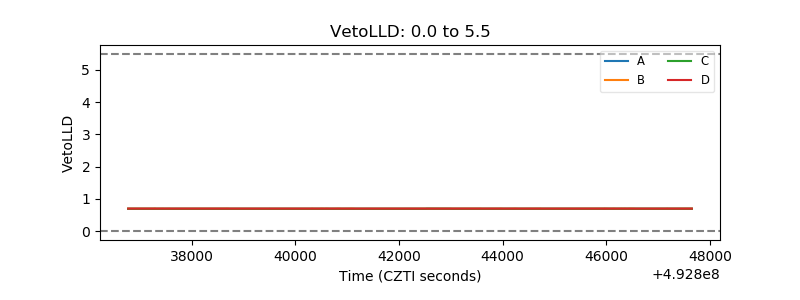 |
| Alpha Counter | 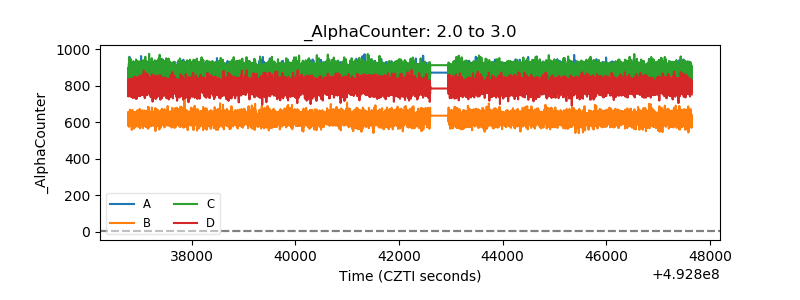 |
| _CPM_Rate | 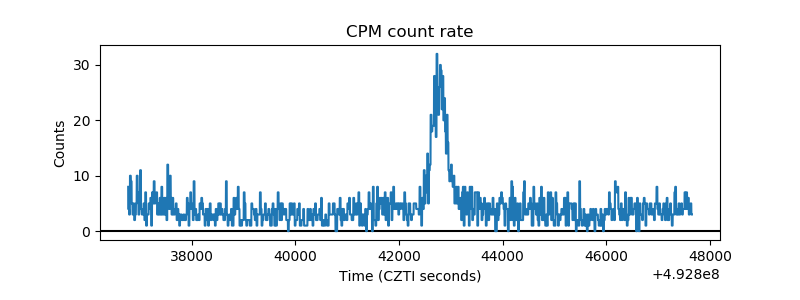 |
| CZT Counter | 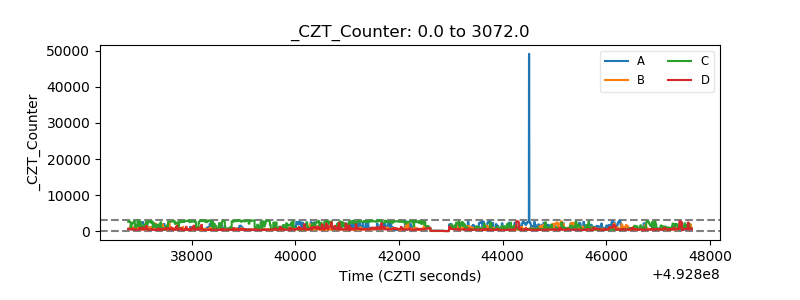 |
| +2.5 Volts monitor |  |
| +5 Volts monitor | 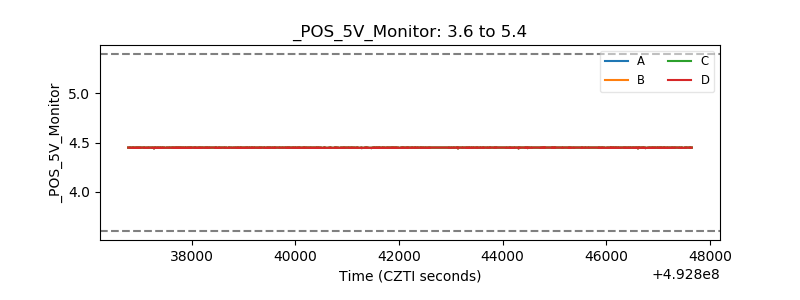 |
| _ROLL_ROT | 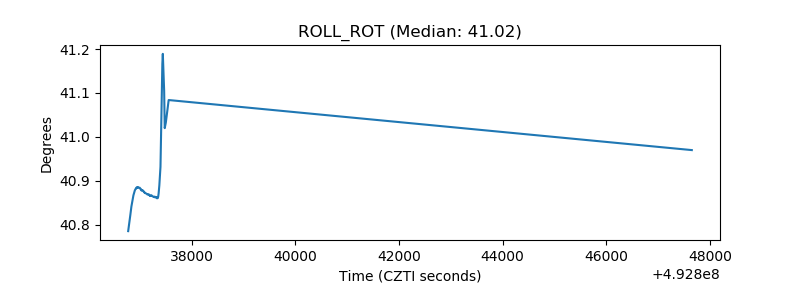 |
| _Roll_DEC | 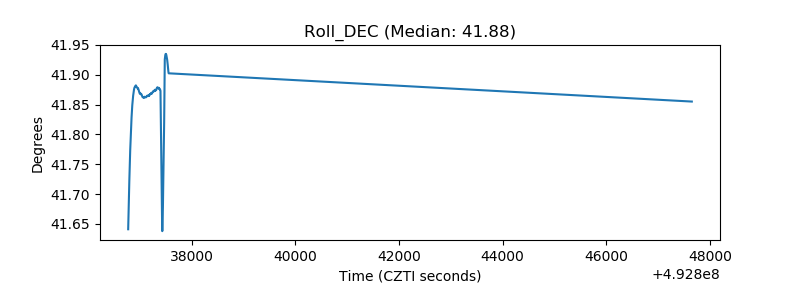 |
| _Roll_RA | 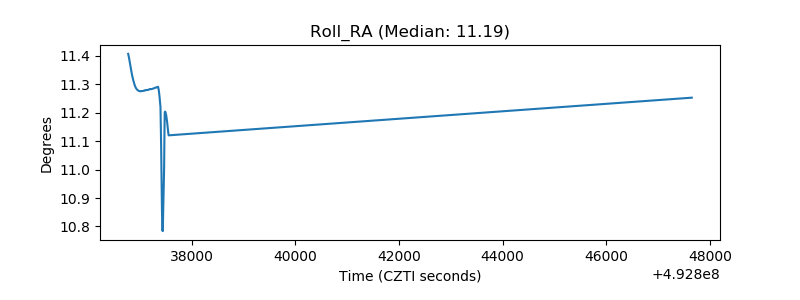 |
| Veto Counter | 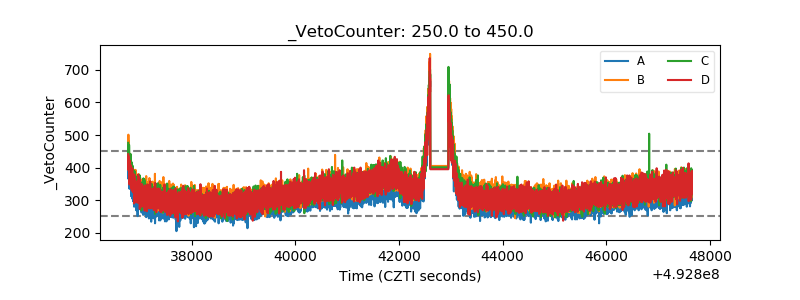 |