| Param | Original file | Final file |
|---|---|---|
| Filename | modeM0/AS1A14_002T06_9000006496_53437cztM0_level2.fits | modeM0/AS1A14_002T06_9000006496_53437cztM0_level2_quad_clean.evt |
| Size (bytes) | 849,985,920 | 98,352,000 |
| Size | 810.6 MB | 93.8 MB |
| Events in quadrant A | 6,578,789 | 675,916 |
| Events in quadrant B | 6,003,313 | 763,781 |
| Events in quadrant C | 13,841,392 | 360,119 |
| Events in quadrant D | 4,455,239 | 652,252 |
| Mode M9 | |||
|---|---|---|---|
| Quadrant | BADHDUFLAG | Total packets | Discarded packets |
| A | 0 | 9 | 0 |
| B | 0 | 9 | 0 |
| C | 0 | 9 | 0 |
| D | 0 | 9 | 0 |
| Mode SS | |||
|---|---|---|---|
| Quadrant | BADHDUFLAG | Total packets | Discarded packets |
| A | 0 | 154 | 0 |
| B | 0 | 154 | 0 |
| C | 0 | 154 | 0 |
| D | 0 | 154 | 0 |
| Mode M0 | |||
|---|---|---|---|
| Quadrant | BADHDUFLAG | Total packets | Discarded packets |
| A | 0 | 24739 | 2 |
| B | 0 | 22961 | 3 |
| C | 0 | 46058 | 1 |
| D | 0 | 18555 | 5 |
| Quadrant | Total seconds | Saturated seconds | Saturation percentage |
|---|---|---|---|
| A | 7556 | 903 | 11.950768% |
| B | 7555 | 609 | 8.060887% |
| C | 7555 | 4001 | 52.958306% |
| D | 7554 | 222 | 2.938840% |
Noise dominated data is calculated using 1-second bins in cleaned event files. If a bin has >2000 counts, and if more than 50% of those come from <1% of pixels, then it is considered to be noise-dominated and hence unusable.
| Quadrant | # 1 sec bins | Bins with >0 counts | Bins with >2000 counts | High rate bins dominated by noise | Noise dominated (total time) | Noise dominated (detector-on time) | Marked lightcurve |
|---|---|---|---|---|---|---|---|
| A | 26597 | 7558 | 670 | 670 | 2.52% | 8.86% | 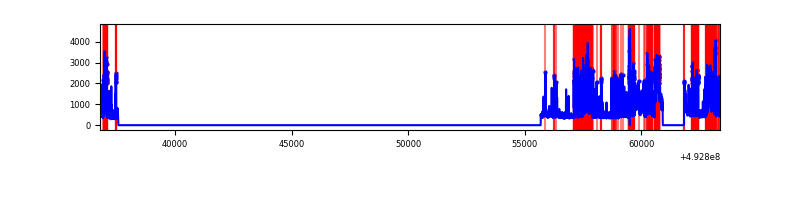 |
| B | 26596 | 7557 | 277 | 277 | 1.04% | 3.67% | 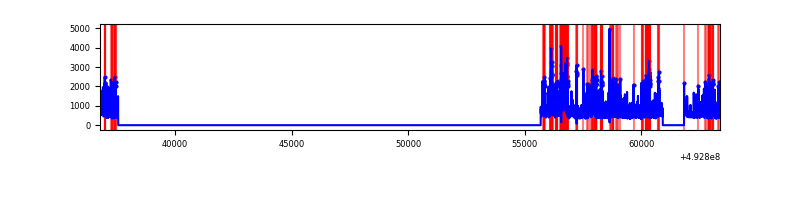 |
| C | 26596 | 7557 | 3782 | 3782 | 14.22% | 50.05% | 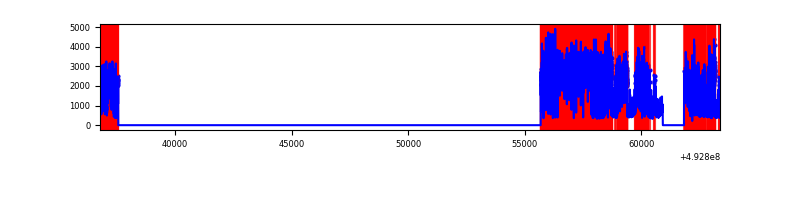 |
| D | 26596 | 7556 | 150 | 150 | 0.56% | 1.99% | 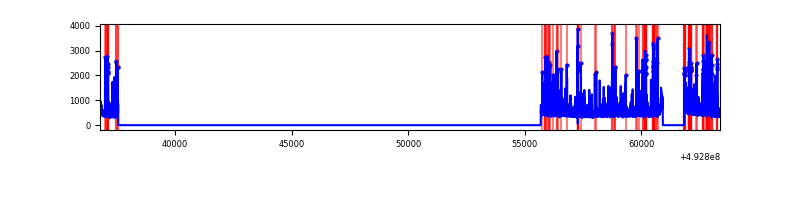 |
Top three noisy pixels from each quadrant. If the there are fewer than three noisy pixels in the level2.evt file, extra rows are filled as -1
| Pixel properties | Quadrant properties | ||||||
|---|---|---|---|---|---|---|---|
| Quadrant | DetID | PixID | Counts | Sigma | Mean | Median | Sigma |
| A | 15 | 174 | 1954894 | 9835.86 | 795 | 777 | 198.7 |
| A | 3 | 63 | 947950 | 4767.5 | 795 | 777 | 198.7 |
| A | 4 | 249 | 223631 | 1121.71 | 795 | 777 | 198.7 |
| B | 4 | 206 | 804121 | 4665.78 | 805 | 778 | 172.2 |
| B | 4 | 171 | 545816 | 3165.55 | 805 | 778 | 172.2 |
| B | 10 | 254 | 478387 | 2773.93 | 805 | 778 | 172.2 |
| C | 1 | 241 | 7709677 | 52191.56 | 539 | 536 | 147.7 |
| C | 15 | 224 | 2628585 | 17792.12 | 539 | 536 | 147.7 |
| C | 15 | 178 | 677573 | 4583.6 | 539 | 536 | 147.7 |
| D | 13 | 153 | 329514 | 1421.98 | 802 | 765 | 231.2 |
| D | 15 | 171 | 204488 | 881.19 | 802 | 765 | 231.2 |
| D | 2 | 120 | 160051 | 688.98 | 802 | 765 | 231.2 |
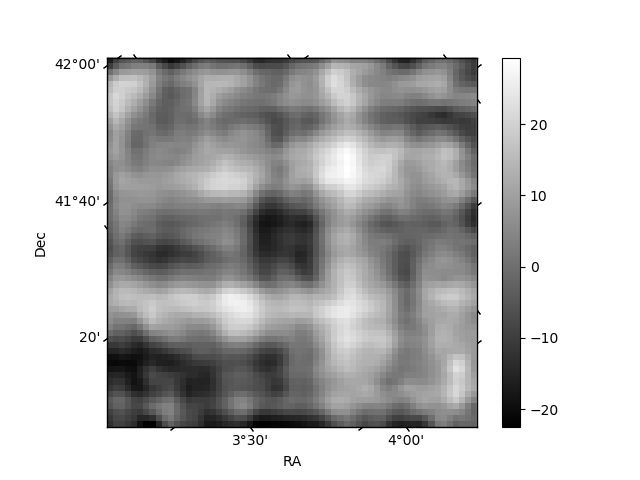
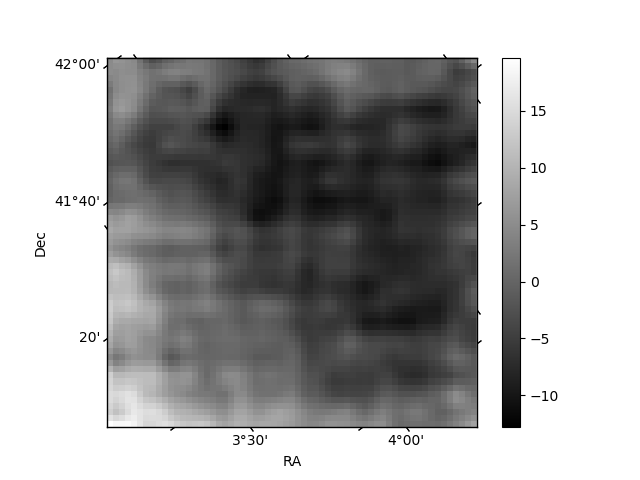
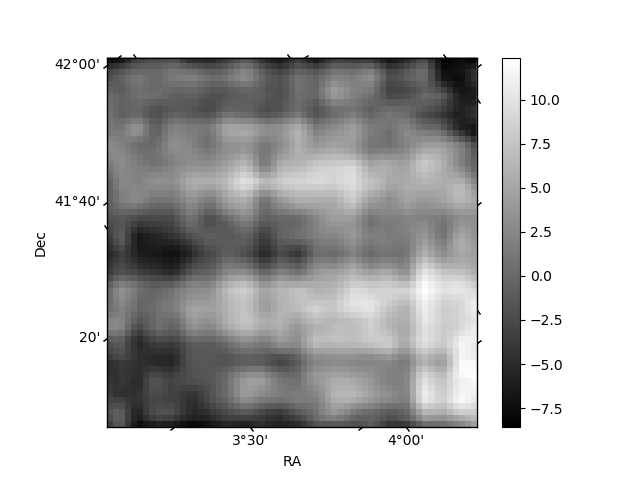
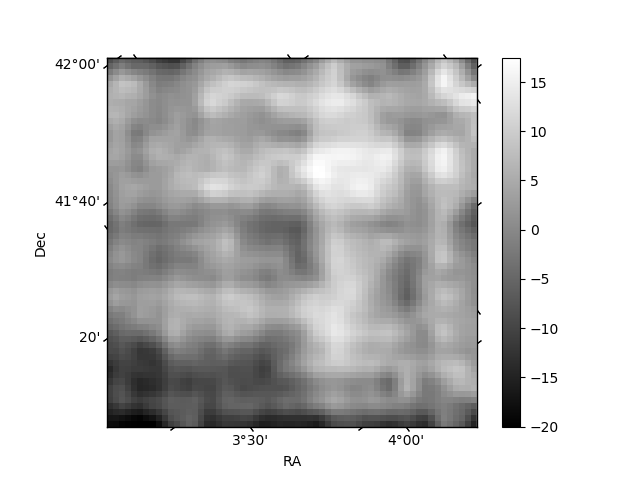
Histogram calculated using DETX and DETY for each event in the final _common_clean file
| Quadrant A | 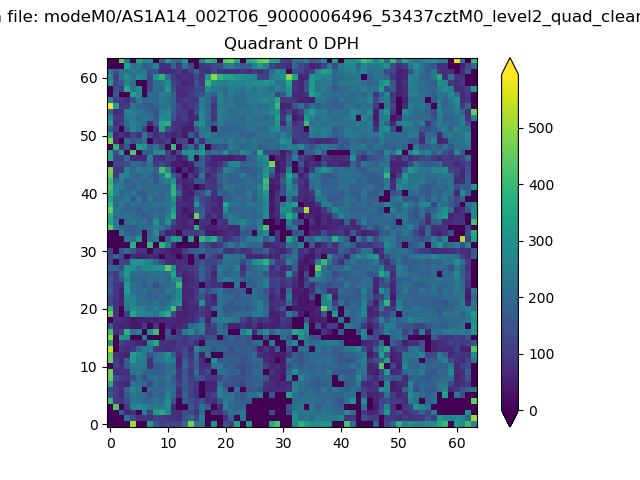 |
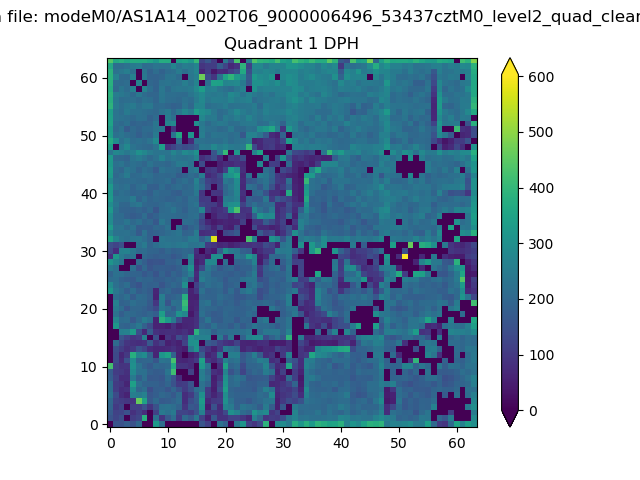 |
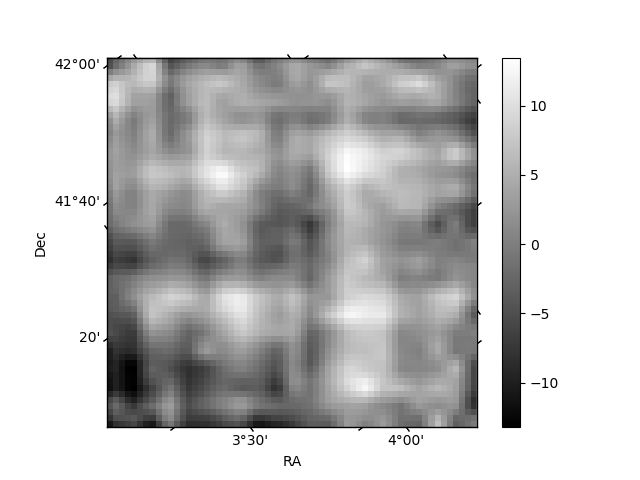
Quadrant B |
|---|---|---|---|
| Quadrant D | 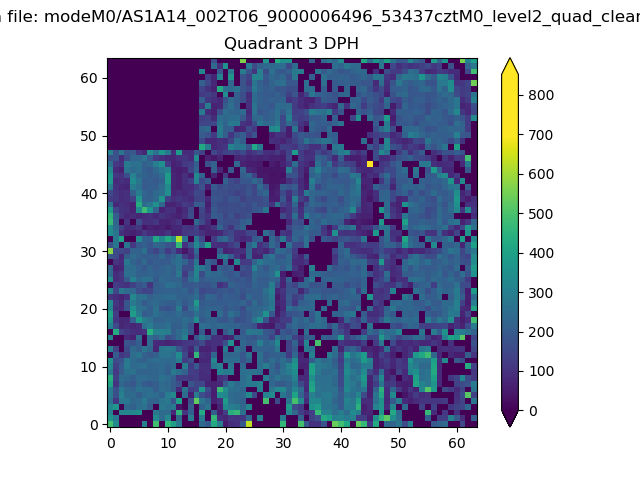 |
 |
Quadrant C |
| Plot type | Count rate plots | Images |
|---|---|---|
| Comparison with Poisson distribution Blue bars denote a histogram of data divided into 1 sec bins. Red curve is a Poisson curve with rate = median count rate of data. |
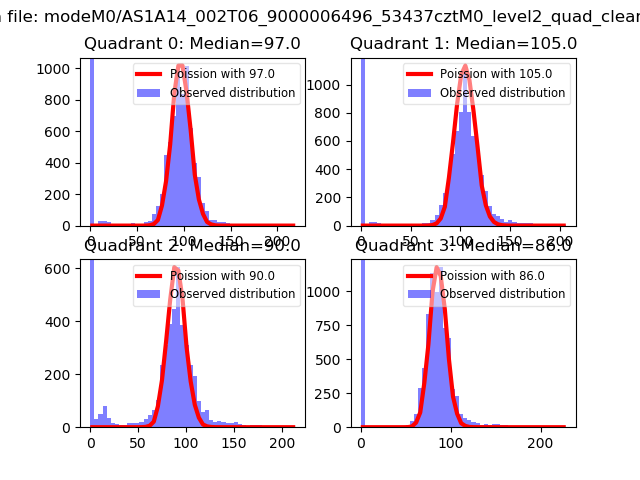 |
 |
| Quadrant-wise count rates Data is divided into 100 sec bins |
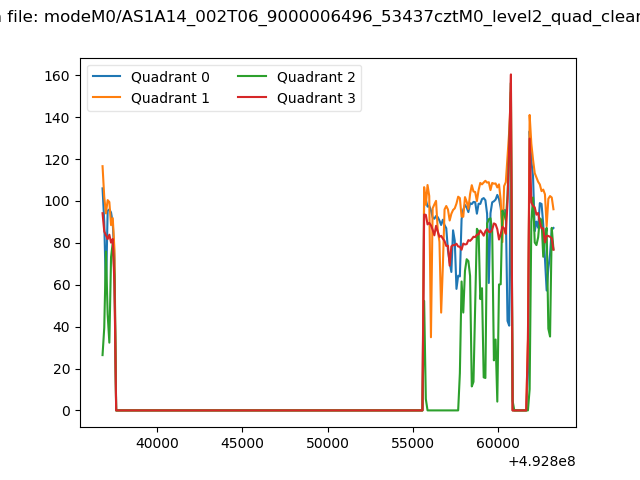 |
|
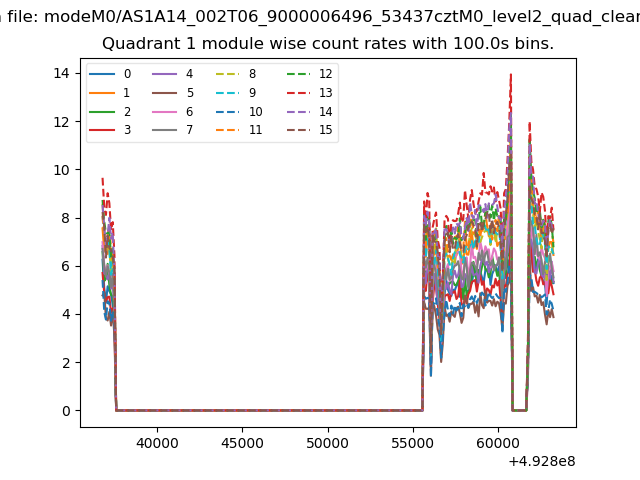
| Module-wise count rates for Quadrant A Data is divided into 100 sec bins |
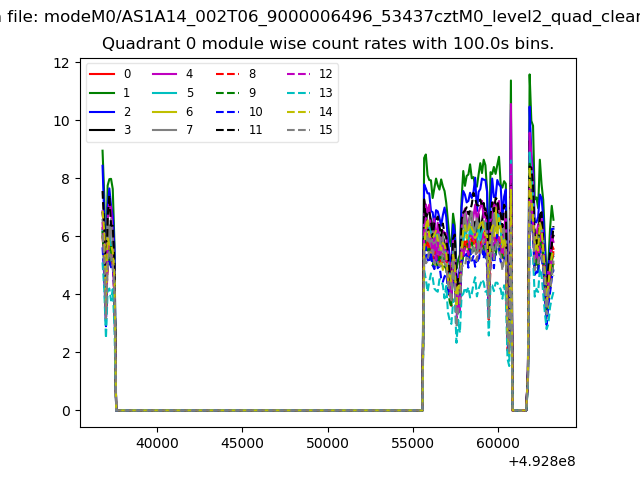 |
 |
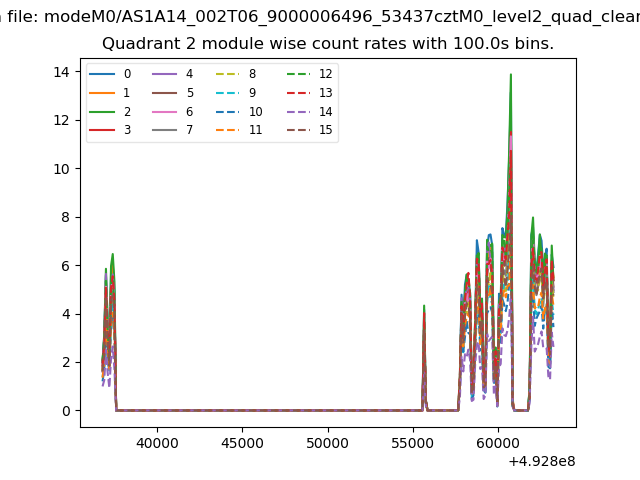
| Module-wise count rates for Quadrant B Data is divided into 100 sec bins |
 |
 |
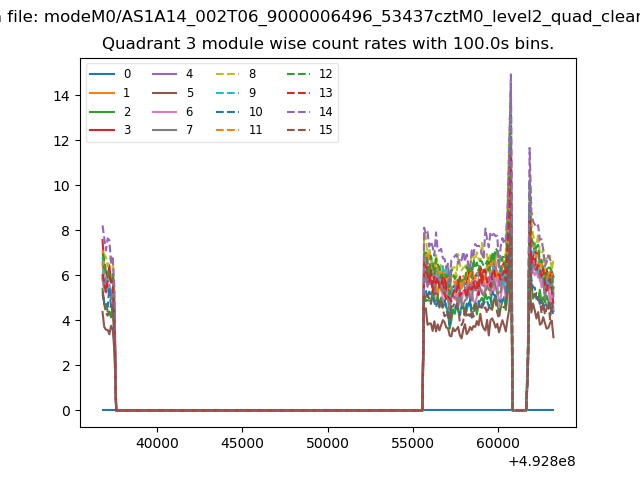
| Module-wise count rates for Quadrant C Data is divided into 100 sec bins |
 |
 |
| Module-wise count rates for Quadrant D Data is divided into 100 sec bins |
 |
 |
| Parameter | Plot |
|---|---|
| CZT HV Monitor | 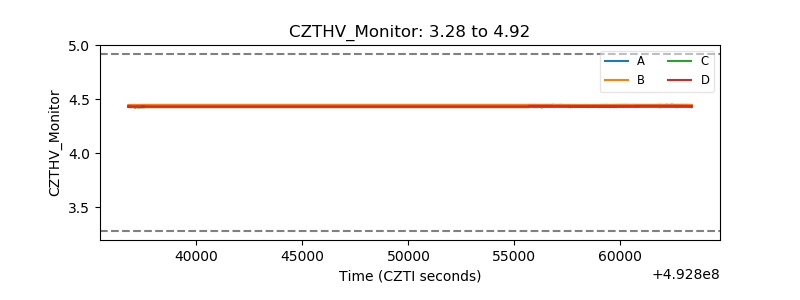 |
| D_VDD | 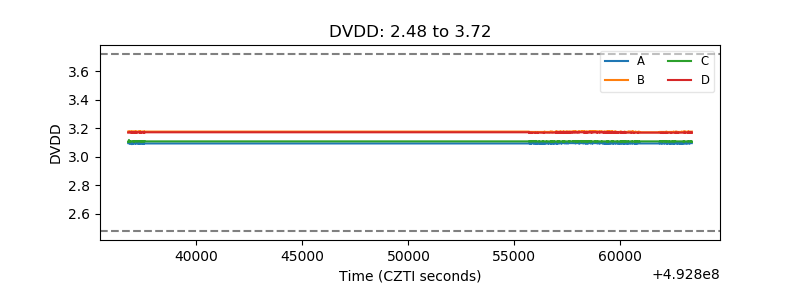 |
| Temperature 1 | 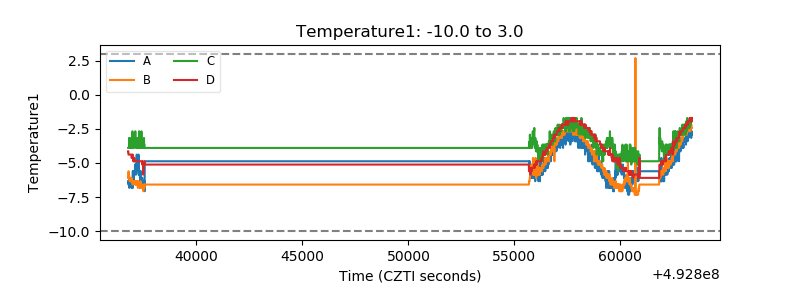 |
| Veto HV Monitor | 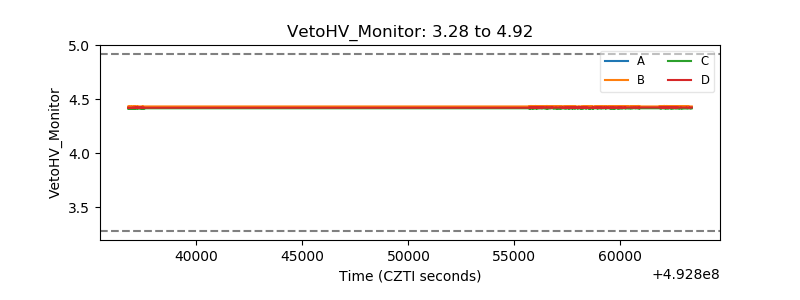 |
| Veto LLD | 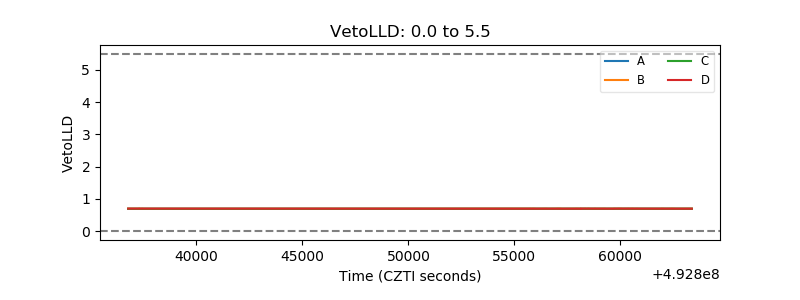 |
| Alpha Counter | 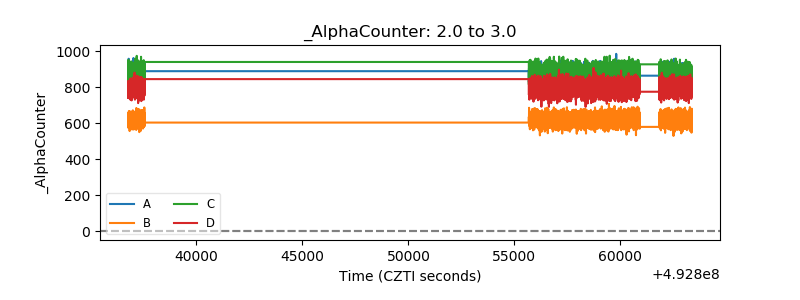 |
| _CPM_Rate | 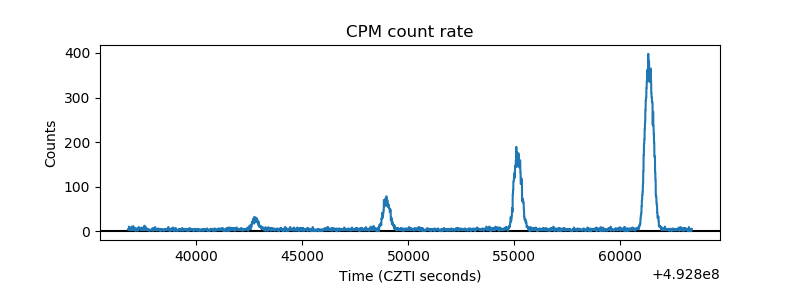 |
| CZT Counter | 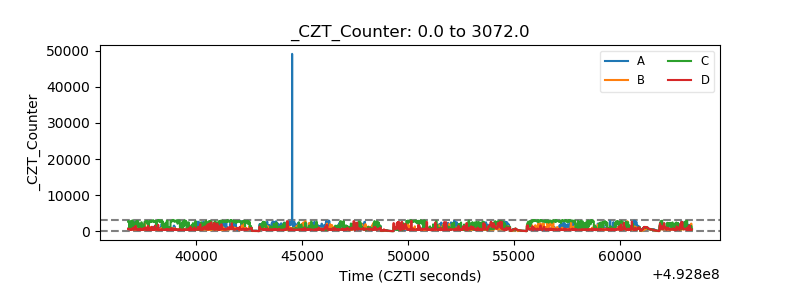 |
| +2.5 Volts monitor |  |
| +5 Volts monitor |  |
| _ROLL_ROT | 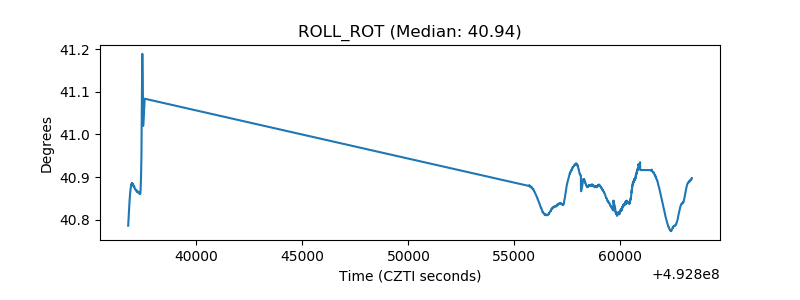 |
| _Roll_DEC | 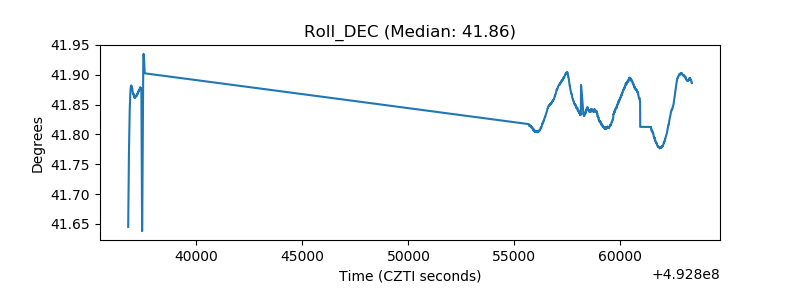 |
| _Roll_RA | 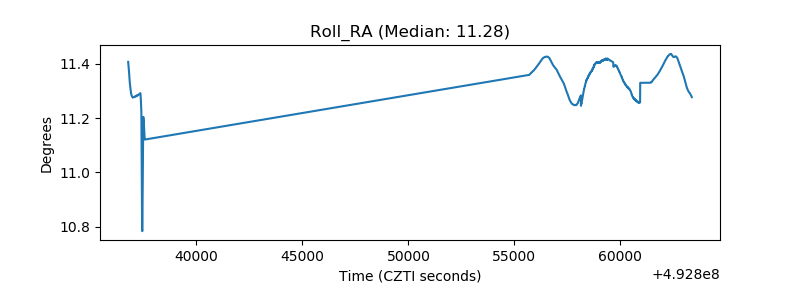 |
| Veto Counter | 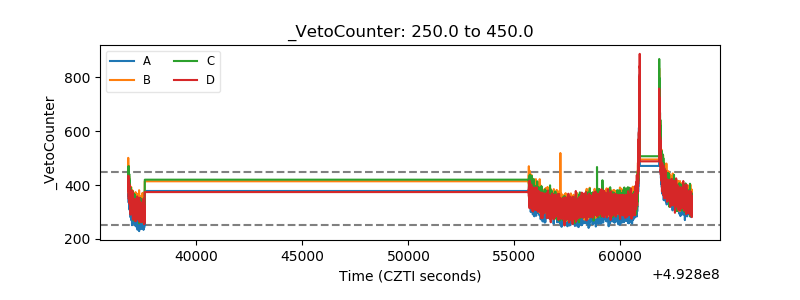 |