| Param | Original file | Final file |
|---|---|---|
| Filename | modeM0/AS1A14_002T06_9000006496_53439cztM0_level2.fits | modeM0/AS1A14_002T06_9000006496_53439cztM0_level2_quad_clean.evt |
| Size (bytes) | 695,136,960 | 93,723,840 |
| Size | 662.9 MB | 89.4 MB |
| Events in quadrant A | 6,605,904 | 577,348 |
| Events in quadrant B | 5,989,773 | 696,827 |
| Events in quadrant C | 8,126,648 | 502,825 |
| Events in quadrant D | 4,485,949 | 589,453 |
| Mode M9 | |||
|---|---|---|---|
| Quadrant | BADHDUFLAG | Total packets | Discarded packets |
| A | 0 | 13 | 0 |
| B | 0 | 14 | 0 |
| C | 0 | 14 | 0 |
| D | 0 | 14 | 0 |
| Mode SS | |||
|---|---|---|---|
| Quadrant | BADHDUFLAG | Total packets | Discarded packets |
| A | 0 | 138 | 0 |
| B | 0 | 138 | 0 |
| C | 0 | 138 | 0 |
| D | 0 | 138 | 0 |
| Mode M0 | |||
|---|---|---|---|
| Quadrant | BADHDUFLAG | Total packets | Discarded packets |
| A | 0 | 24209 | 2 |
| B | 0 | 22344 | 2 |
| C | 0 | 28764 | 2 |
| D | 0 | 17848 | 2 |
| Quadrant | Total seconds | Saturated seconds | Saturation percentage |
|---|---|---|---|
| A | 6758 | 1246 | 18.437408% |
| B | 6757 | 649 | 9.604854% |
| C | 6757 | 1597 | 23.634749% |
| D | 6757 | 259 | 3.833062% |
Noise dominated data is calculated using 1-second bins in cleaned event files. If a bin has >2000 counts, and if more than 50% of those come from <1% of pixels, then it is considered to be noise-dominated and hence unusable.
| Quadrant | # 1 sec bins | Bins with >0 counts | Bins with >2000 counts | High rate bins dominated by noise | Noise dominated (total time) | Noise dominated (detector-on time) | Marked lightcurve |
|---|---|---|---|---|---|---|---|
| A | 7808 | 6759 | 1056 | 1056 | 13.52% | 15.62% | 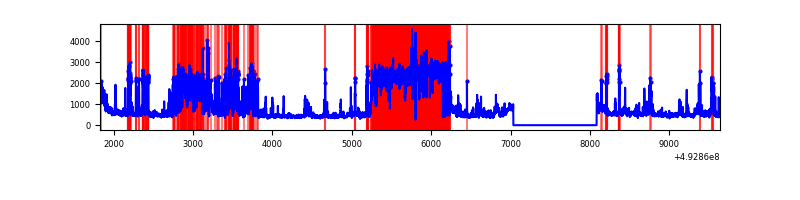 |
| B | 7807 | 6758 | 328 | 328 | 4.20% | 4.85% | 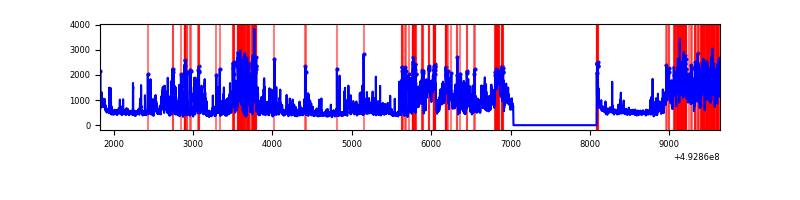 |
| C | 7807 | 6758 | 1367 | 1367 | 17.51% | 20.23% | 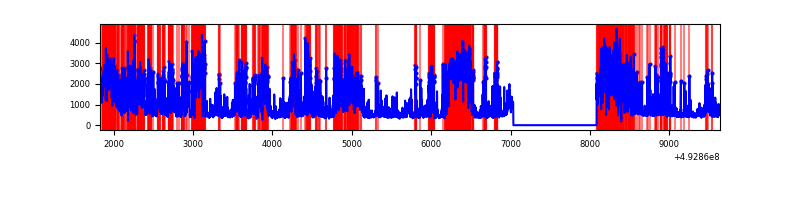 |
| D | 7807 | 6758 | 175 | 175 | 2.24% | 2.59% | 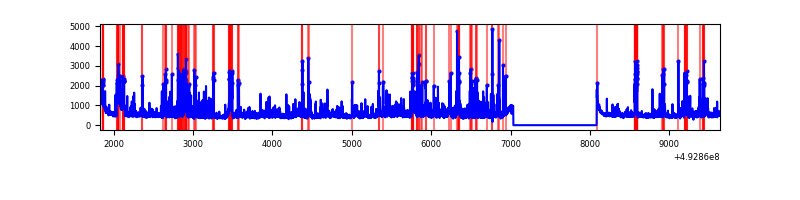 |
Top three noisy pixels from each quadrant. If the there are fewer than three noisy pixels in the level2.evt file, extra rows are filled as -1
| Pixel properties | Quadrant properties | ||||||
|---|---|---|---|---|---|---|---|
| Quadrant | DetID | PixID | Counts | Sigma | Mean | Median | Sigma |
| A | 3 | 63 | 2094012 | 11576.93 | 727 | 709 | 180.8 |
| A | 15 | 174 | 1254284 | 6932.85 | 727 | 709 | 180.8 |
| A | 4 | 249 | 173677 | 956.59 | 727 | 709 | 180.8 |
| B | 10 | 254 | 872259 | 5463.96 | 741 | 716 | 159.5 |
| B | 4 | 171 | 838258 | 5250.8 | 741 | 716 | 159.5 |
| B | 4 | 206 | 422240 | 2642.66 | 741 | 716 | 159.5 |
| C | 1 | 241 | 1999657 | 11235.73 | 652 | 646 | 177.9 |
| C | 15 | 224 | 1604864 | 9016.74 | 652 | 646 | 177.9 |
| C | 12 | 252 | 692291 | 3887.49 | 652 | 646 | 177.9 |
| D | 13 | 153 | 377513 | 1792.37 | 741 | 710 | 210.2 |
| D | 15 | 171 | 274720 | 1303.41 | 741 | 710 | 210.2 |
| D | 0 | 18 | 256863 | 1218.47 | 741 | 710 | 210.2 |
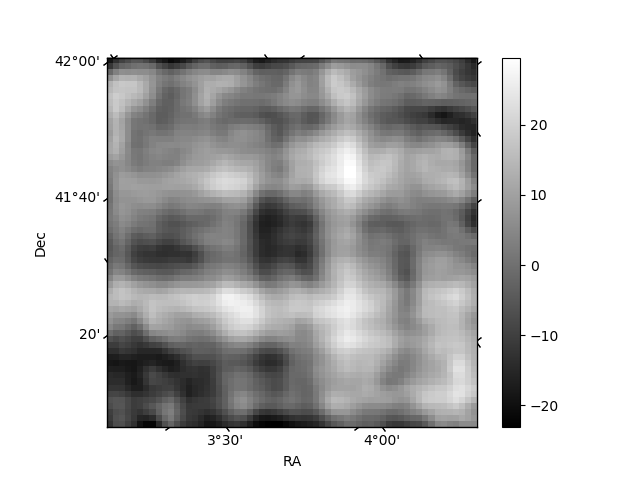
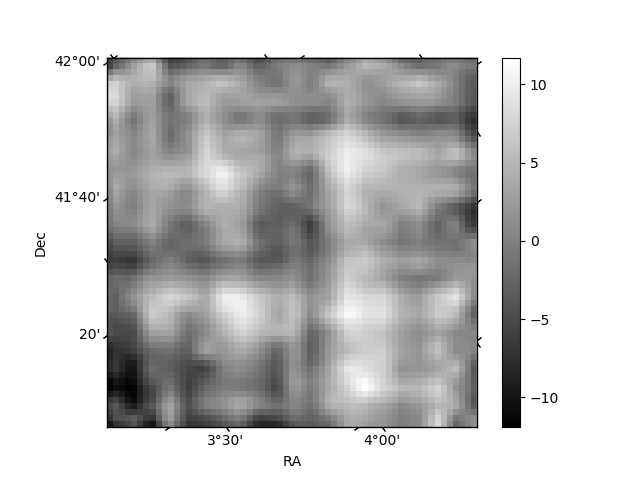
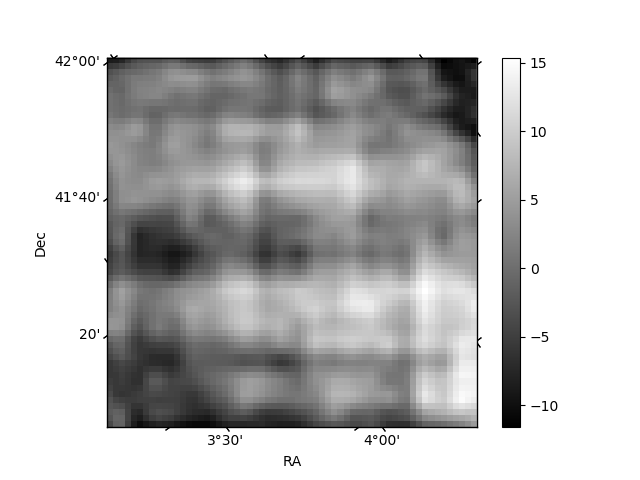
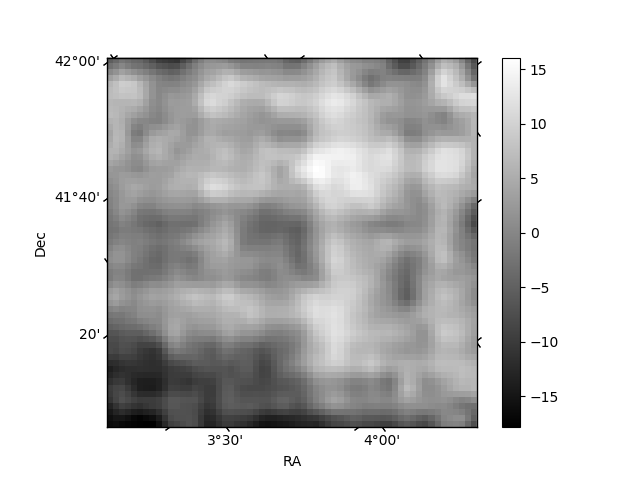
Histogram calculated using DETX and DETY for each event in the final _common_clean file
| Quadrant A | 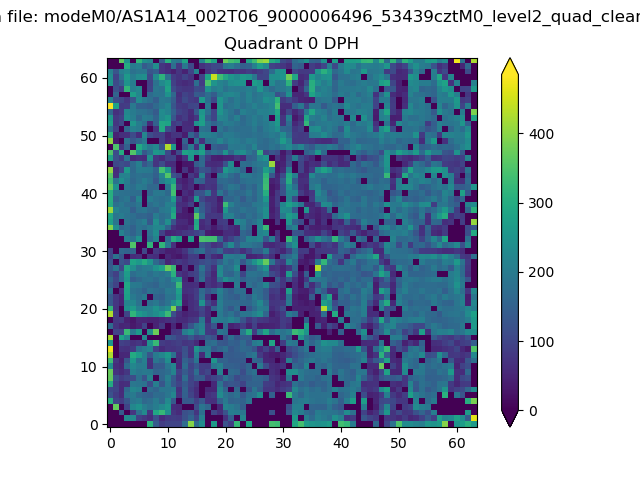 |
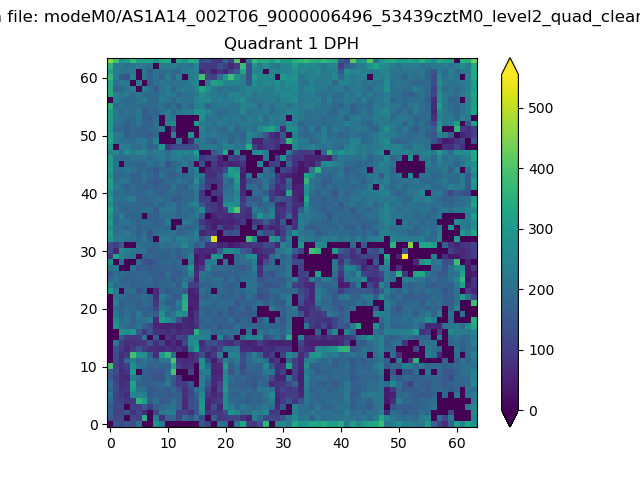 |
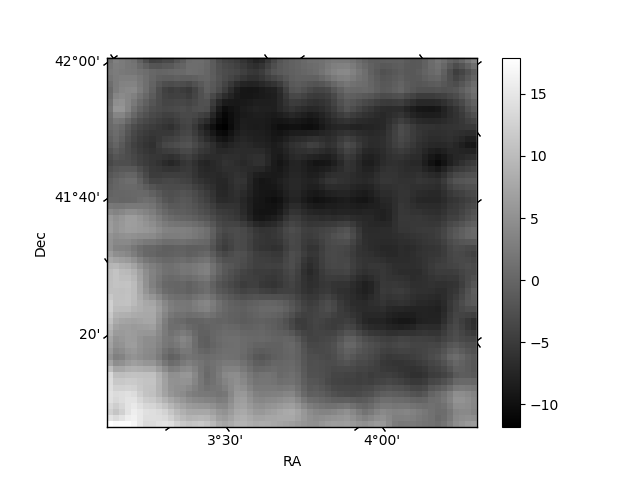
Quadrant B |
|---|---|---|---|
| Quadrant D | 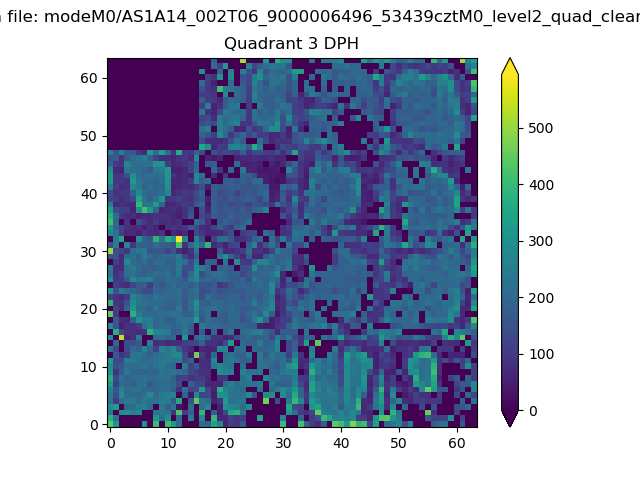 |
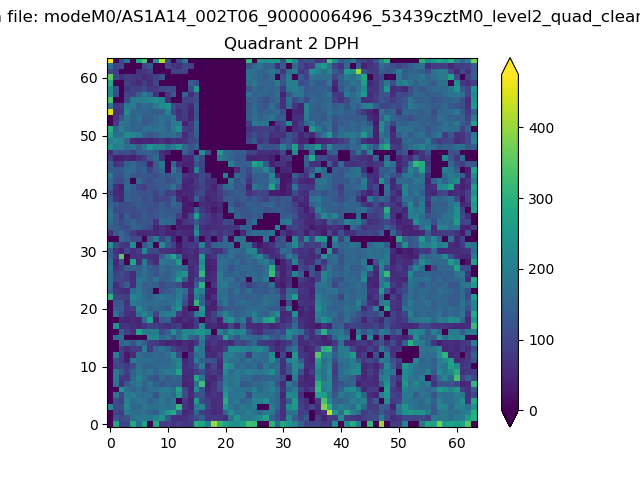 |
Quadrant C |
| Plot type | Count rate plots | Images |
|---|---|---|
| Comparison with Poisson distribution Blue bars denote a histogram of data divided into 1 sec bins. Red curve is a Poisson curve with rate = median count rate of data. |
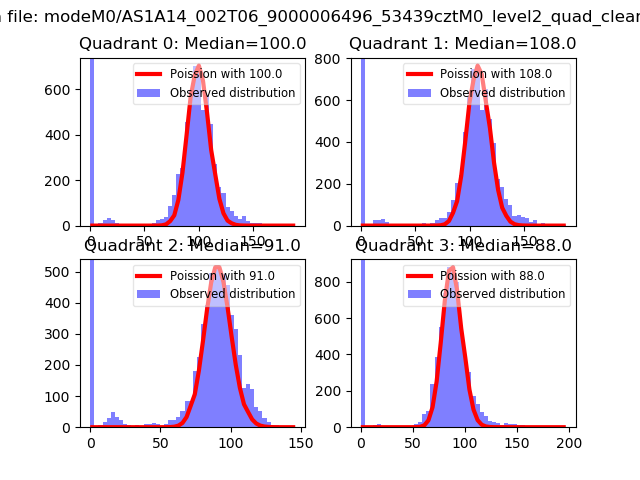 |
 |
| Quadrant-wise count rates Data is divided into 100 sec bins |
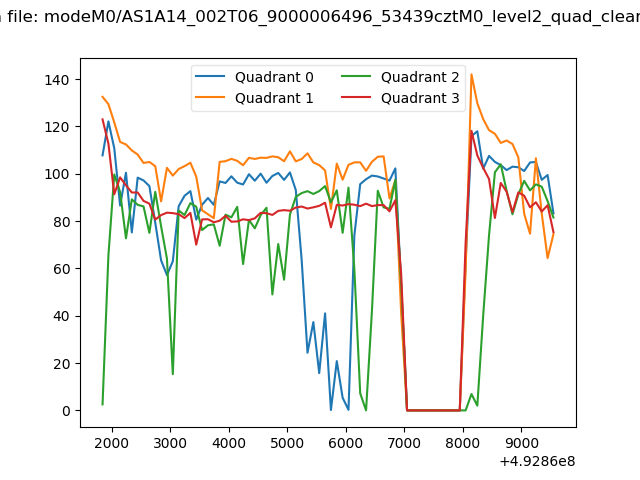 |
|
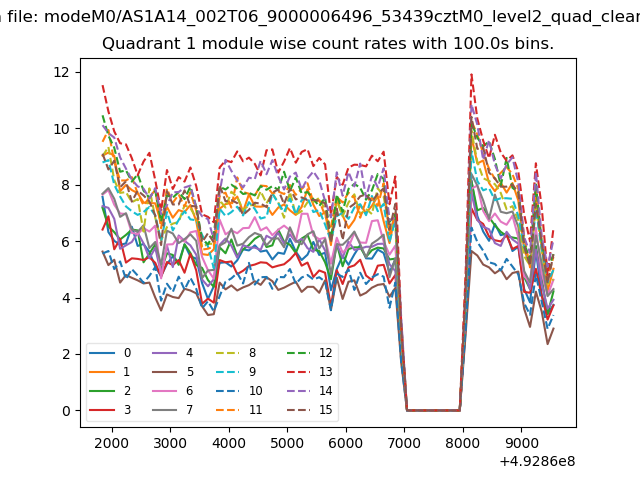
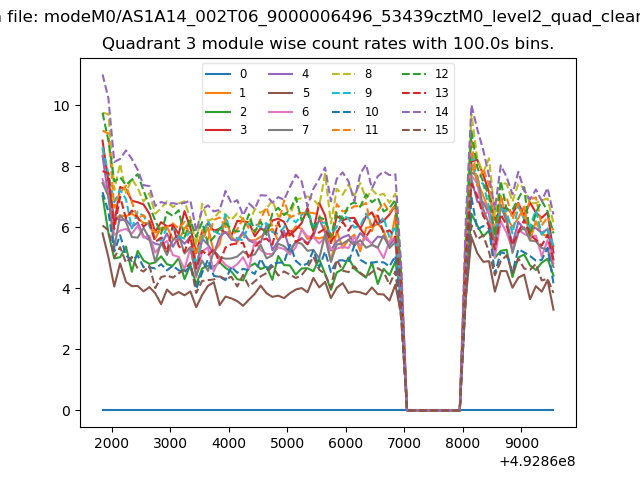
| Module-wise count rates for Quadrant A Data is divided into 100 sec bins |
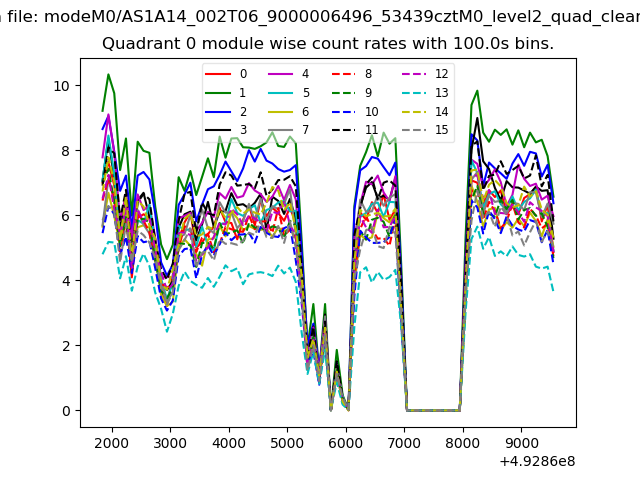 |
 |
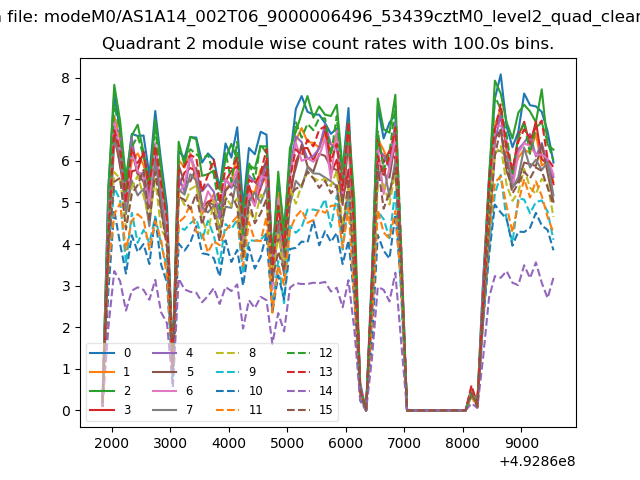
| Module-wise count rates for Quadrant B Data is divided into 100 sec bins |
 |
 |
| Module-wise count rates for Quadrant C Data is divided into 100 sec bins |
 |
 |
| Module-wise count rates for Quadrant D Data is divided into 100 sec bins |
 |
 |
| Parameter | Plot |
|---|---|
| CZT HV Monitor |  |
| D_VDD | 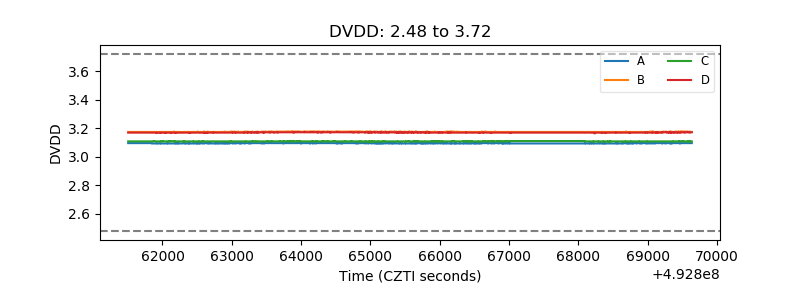 |
| Temperature 1 | 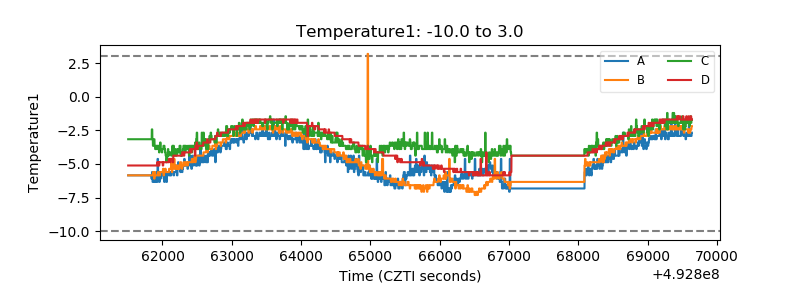 |
| Veto HV Monitor | 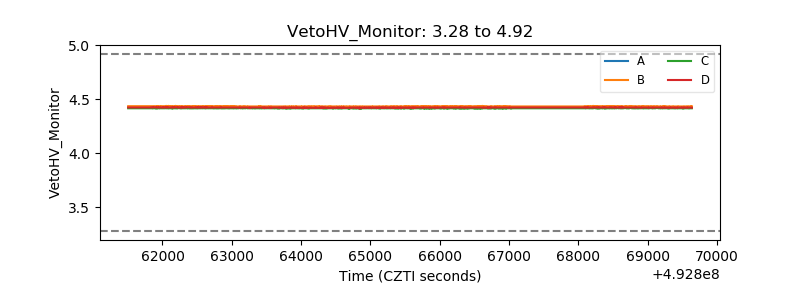 |
| Veto LLD | 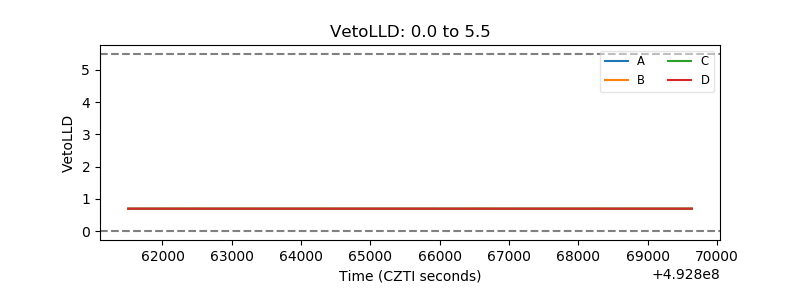 |
| Alpha Counter | 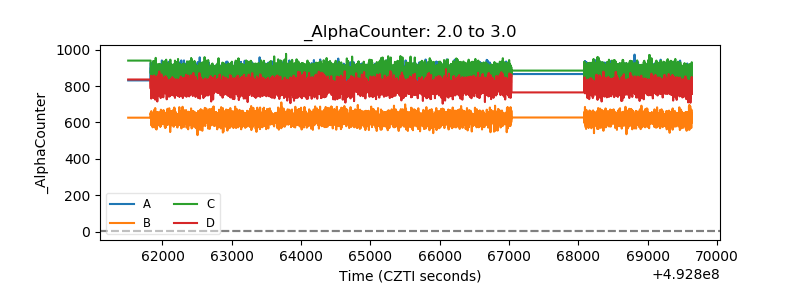 |
| _CPM_Rate | 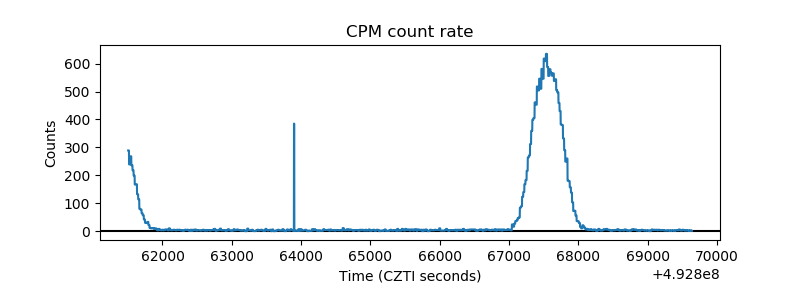 |
| CZT Counter | 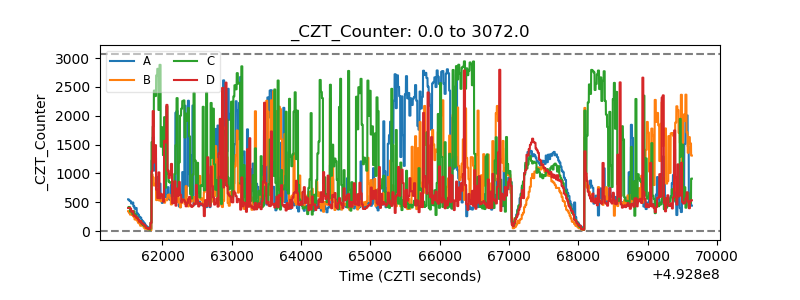 |
| +2.5 Volts monitor |  |
| +5 Volts monitor |  |
| _ROLL_ROT | 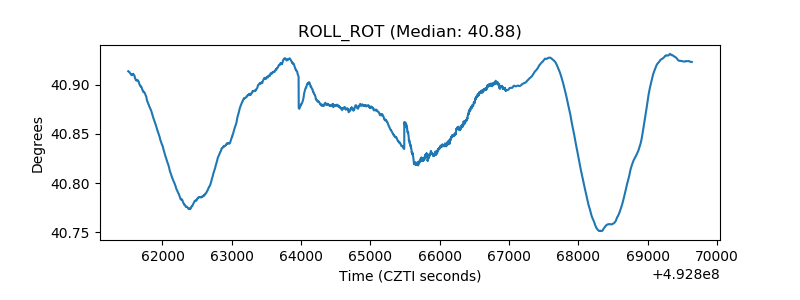 |
| _Roll_DEC | 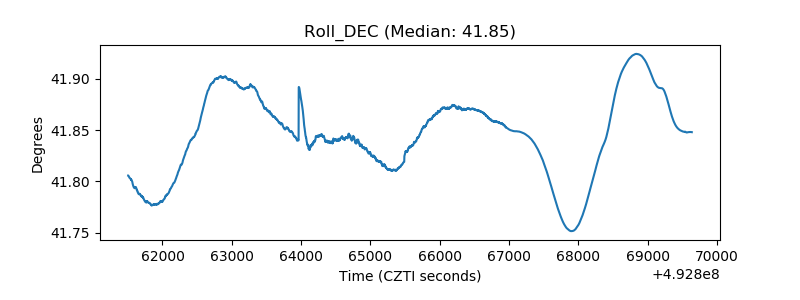 |
| _Roll_RA | 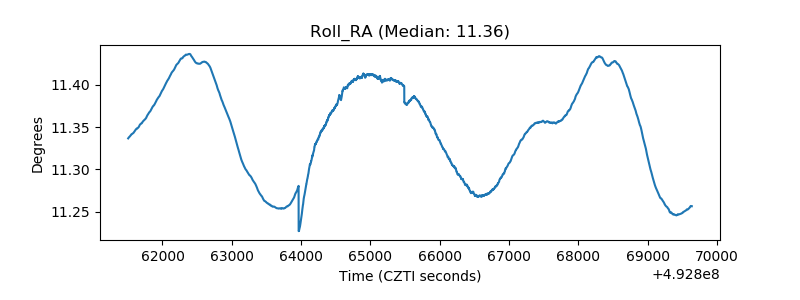 |
| Veto Counter | 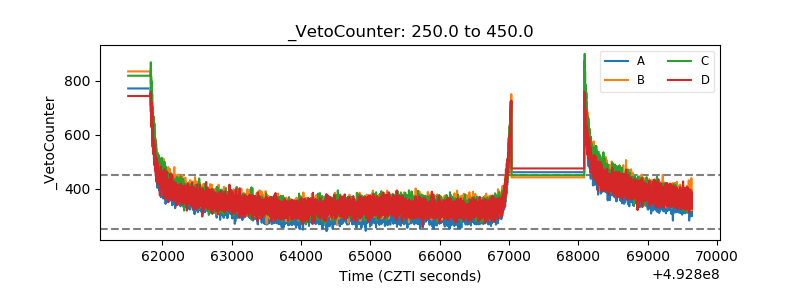 |