| Param | Original file | Final file |
|---|---|---|
| Filename | modeM0/AS1A14_002T06_9000006496_53441cztM0_level2.fits | modeM0/AS1A14_002T06_9000006496_53441cztM0_level2_quad_clean.evt |
| Size (bytes) | 691,770,240 | 91,834,560 |
| Size | 659.7 MB | 87.6 MB |
| Events in quadrant A | 5,846,553 | 633,158 |
| Events in quadrant B | 4,628,152 | 711,191 |
| Events in quadrant C | 11,094,760 | 386,785 |
| Events in quadrant D | 3,534,419 | 597,049 |
| Mode M9 | |||
|---|---|---|---|
| Quadrant | BADHDUFLAG | Total packets | Discarded packets |
| A | 0 | 18 | 0 |
| B | 0 | 19 | 0 |
| C | 0 | 19 | 0 |
| D | 0 | 19 | 0 |
| Mode SS | |||
|---|---|---|---|
| Quadrant | BADHDUFLAG | Total packets | Discarded packets |
| A | 0 | 130 | 0 |
| B | 0 | 130 | 0 |
| C | 0 | 130 | 0 |
| D | 0 | 130 | 0 |
| Mode M0 | |||
|---|---|---|---|
| Quadrant | BADHDUFLAG | Total packets | Discarded packets |
| A | 0 | 21749 | 2 |
| B | 0 | 18094 | 2 |
| C | 0 | 37424 | 2 |
| D | 0 | 14779 | 2 |
| Quadrant | Total seconds | Saturated seconds | Saturation percentage |
|---|---|---|---|
| A | 6493 | 734 | 11.304482% |
| B | 6493 | 448 | 6.899738% |
| C | 6492 | 2881 | 44.377696% |
| D | 6492 | 143 | 2.202711% |
Noise dominated data is calculated using 1-second bins in cleaned event files. If a bin has >2000 counts, and if more than 50% of those come from <1% of pixels, then it is considered to be noise-dominated and hence unusable.
| Quadrant | # 1 sec bins | Bins with >0 counts | Bins with >2000 counts | High rate bins dominated by noise | Noise dominated (total time) | Noise dominated (detector-on time) | Marked lightcurve |
|---|---|---|---|---|---|---|---|
| A | 7658 | 6493 | 534 | 534 | 6.97% | 8.22% | 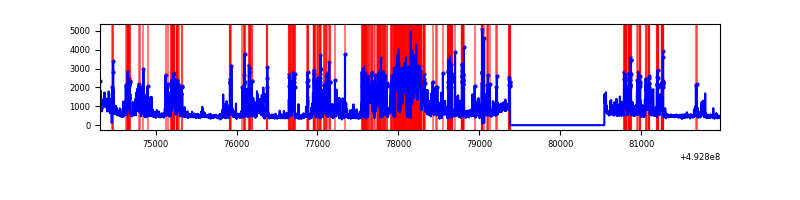 |
| B | 7658 | 6494 | 130 | 130 | 1.70% | 2.00% | 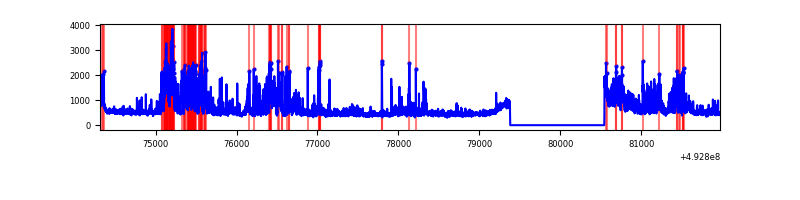 |
| C | 7657 | 6493 | 2621 | 2621 | 34.23% | 40.37% | 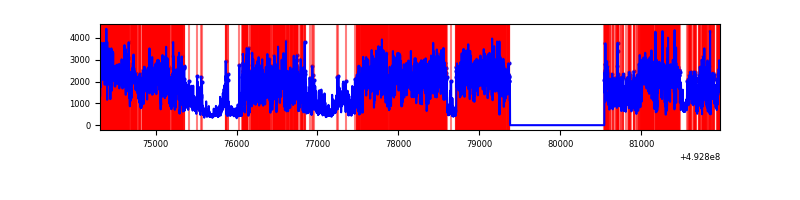 |
| D | 7657 | 6493 | 34 | 34 | 0.44% | 0.52% | 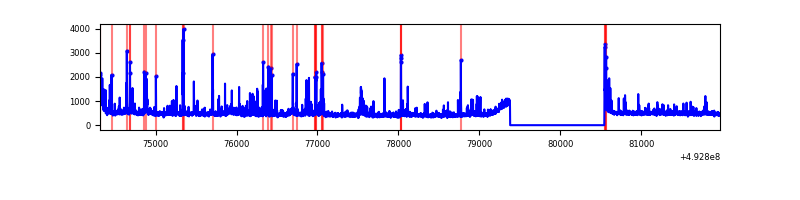 |
Top three noisy pixels from each quadrant. If the there are fewer than three noisy pixels in the level2.evt file, extra rows are filled as -1
| Pixel properties | Quadrant properties | ||||||
|---|---|---|---|---|---|---|---|
| Quadrant | DetID | PixID | Counts | Sigma | Mean | Median | Sigma |
| A | 15 | 174 | 2268700 | 12700.21 | 733 | 718 | 178.6 |
| A | 0 | 8 | 330902 | 1848.96 | 733 | 718 | 178.6 |
| A | 4 | 249 | 76233 | 422.87 | 733 | 718 | 178.6 |
| B | 4 | 171 | 825731 | 5291.61 | 739 | 714 | 155.9 |
| B | 5 | 185 | 189246 | 1209.23 | 739 | 714 | 155.9 |
| B | 5 | 172 | 172165 | 1099.68 | 739 | 714 | 155.9 |
| C | 9 | 38 | 5379970 | 33009.89 | 600 | 594 | 163.0 |
| C | 15 | 224 | 1306759 | 8015.12 | 600 | 594 | 163.0 |
| C | 1 | 241 | 765676 | 4694.83 | 600 | 594 | 163.0 |
| D | 1 | 0 | 127163 | 612.63 | 735 | 702 | 206.4 |
| D | 2 | 172 | 104102 | 500.91 | 735 | 702 | 206.4 |
| D | 10 | 172 | 86546 | 415.87 | 735 | 702 | 206.4 |
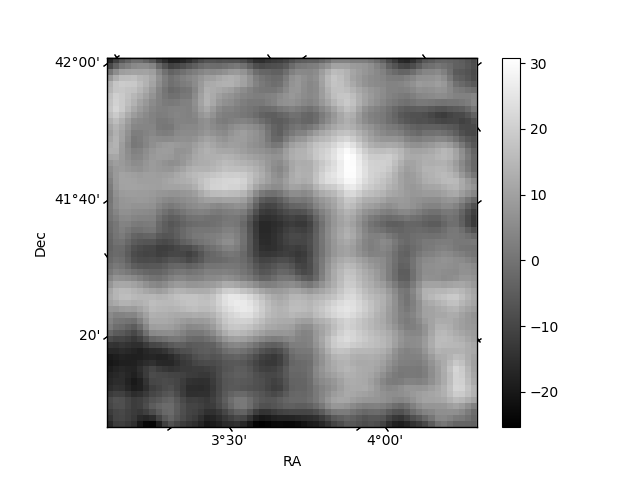
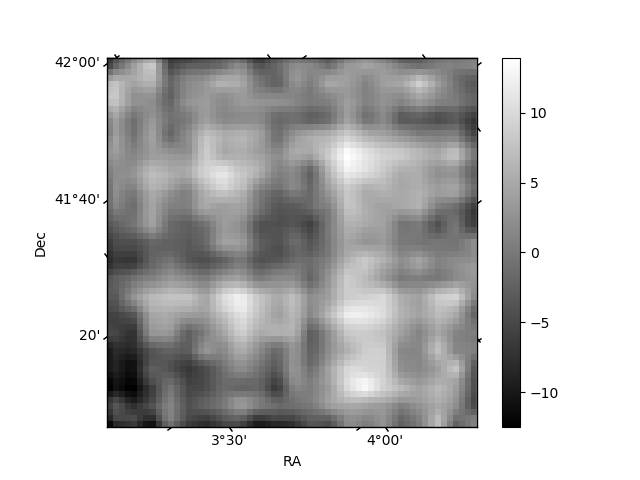
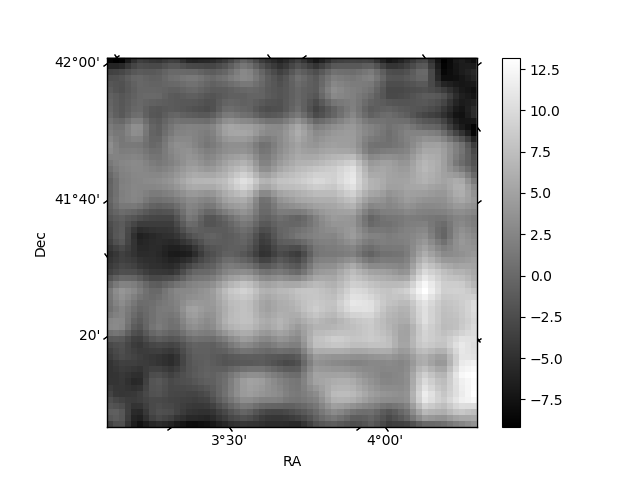
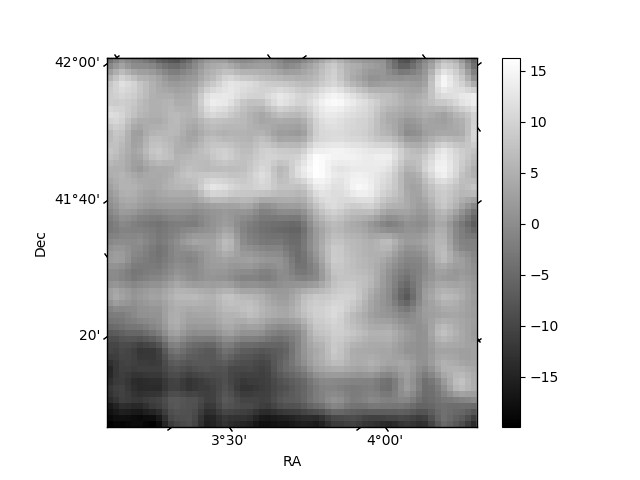
Histogram calculated using DETX and DETY for each event in the final _common_clean file
| Quadrant A | 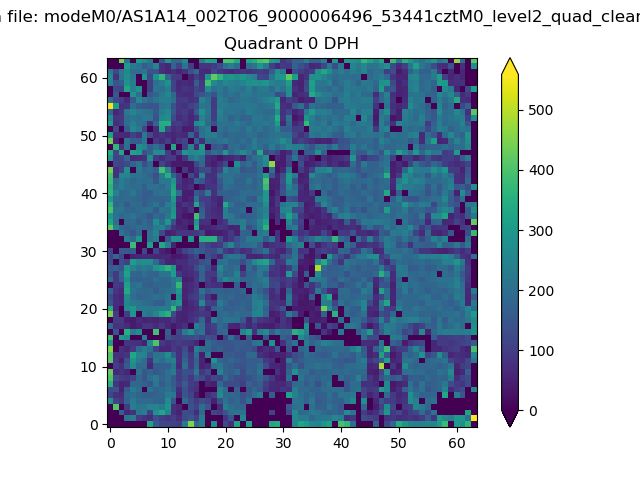 |
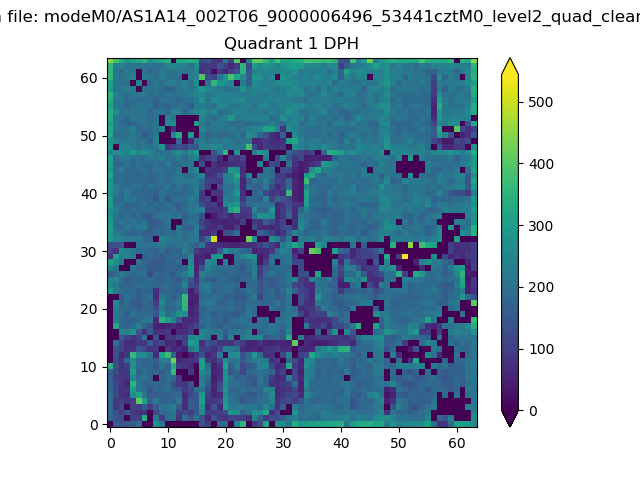 |
Quadrant B |
|---|---|---|---|
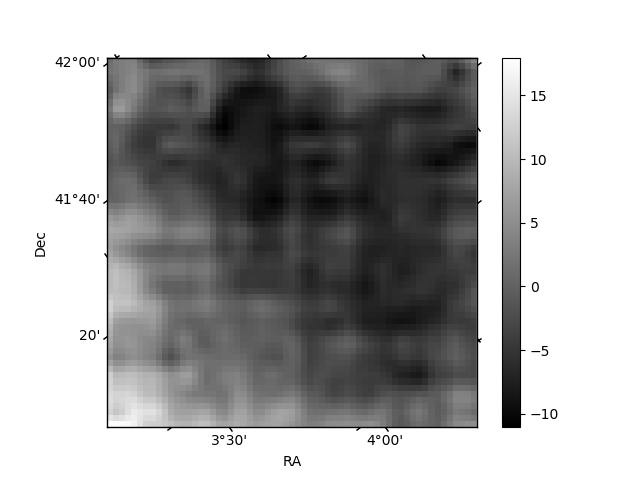
| Quadrant D | 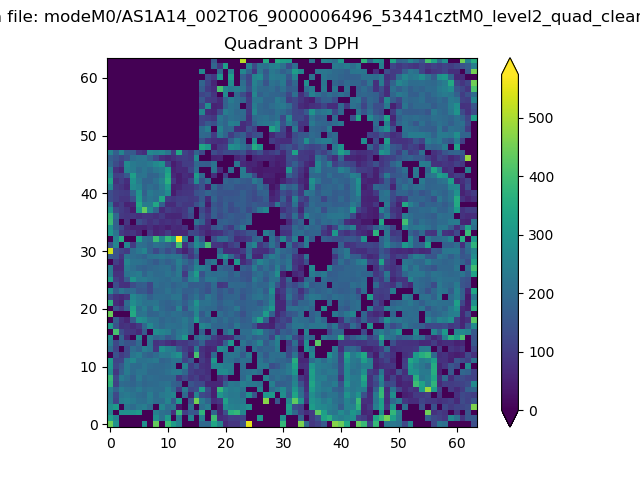 |
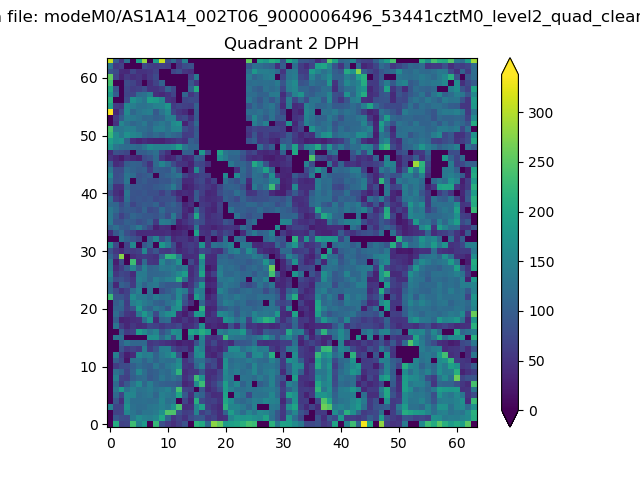 |
Quadrant C |
| Plot type | Count rate plots | Images |
|---|---|---|
| Comparison with Poisson distribution Blue bars denote a histogram of data divided into 1 sec bins. Red curve is a Poisson curve with rate = median count rate of data. |
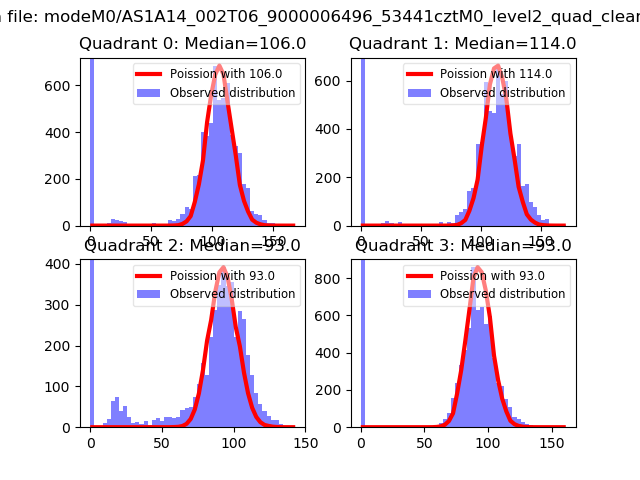 |
 |
| Quadrant-wise count rates Data is divided into 100 sec bins |
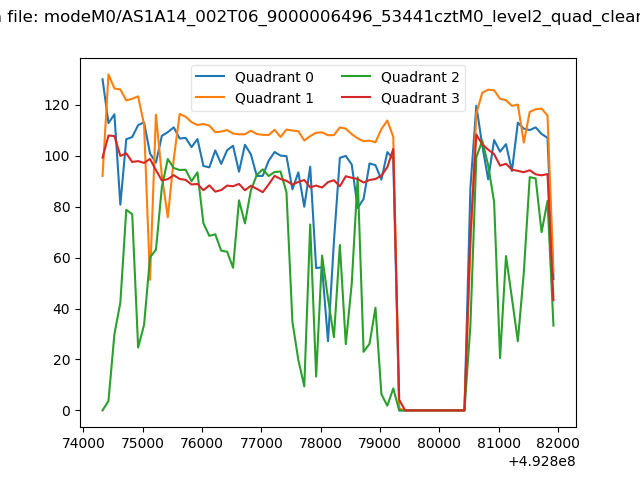 |
|
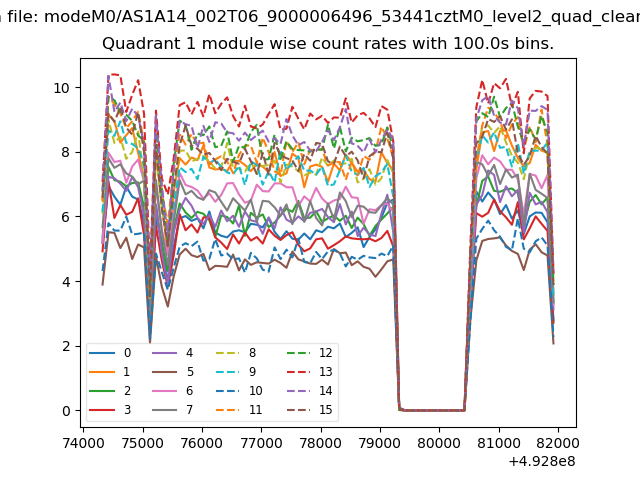
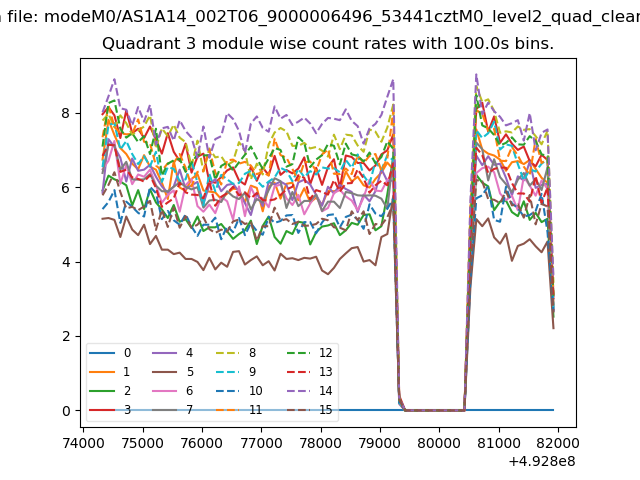
| Module-wise count rates for Quadrant A Data is divided into 100 sec bins |
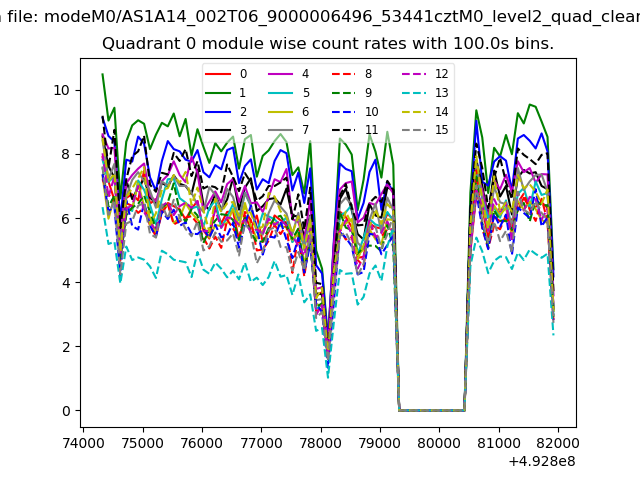 |
 |
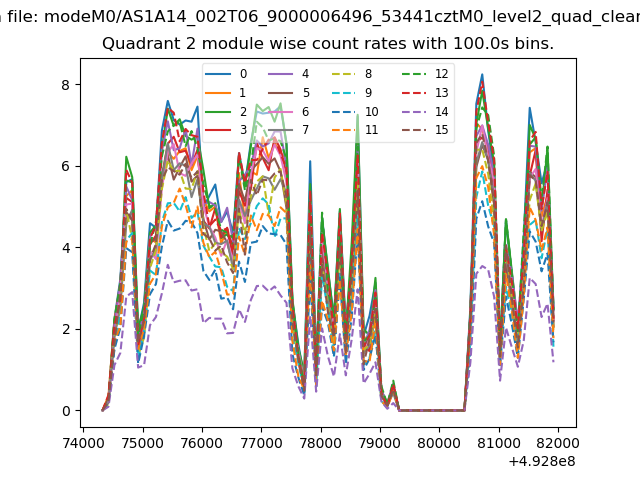
| Module-wise count rates for Quadrant B Data is divided into 100 sec bins |
 |
 |
| Module-wise count rates for Quadrant C Data is divided into 100 sec bins |
 |
 |
| Module-wise count rates for Quadrant D Data is divided into 100 sec bins |
 |
 |
| Parameter | Plot |
|---|---|
| CZT HV Monitor |  |
| D_VDD | 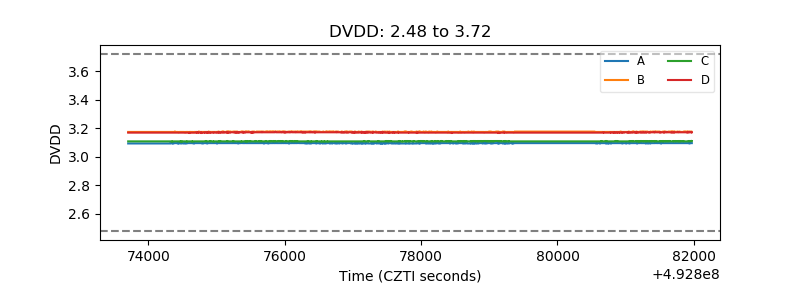 |
| Temperature 1 | 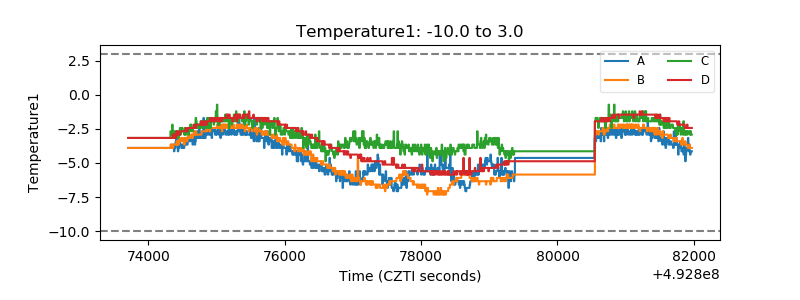 |
| Veto HV Monitor | 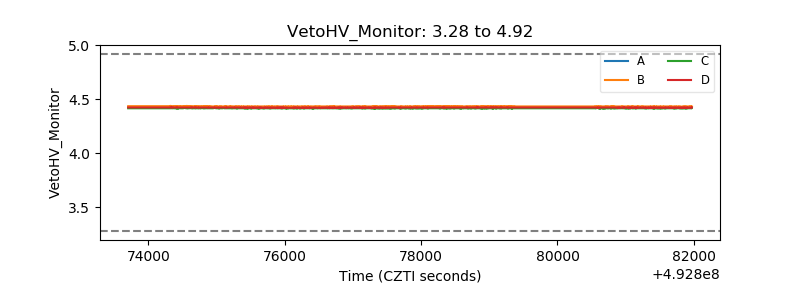 |
| Veto LLD | 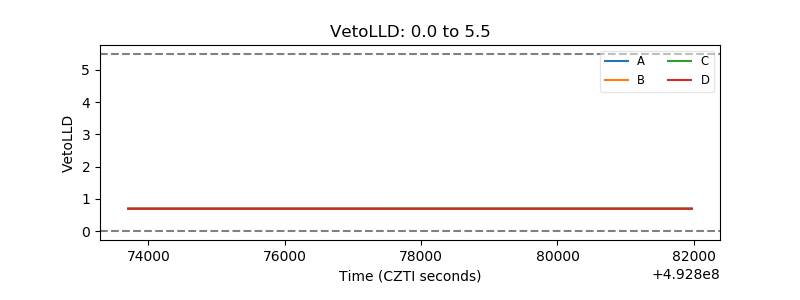 |
| Alpha Counter | 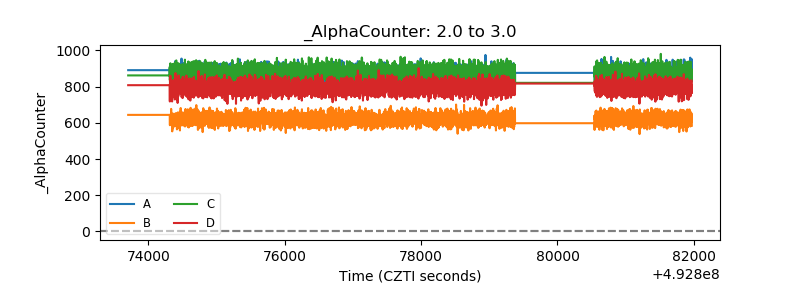 |
| _CPM_Rate | 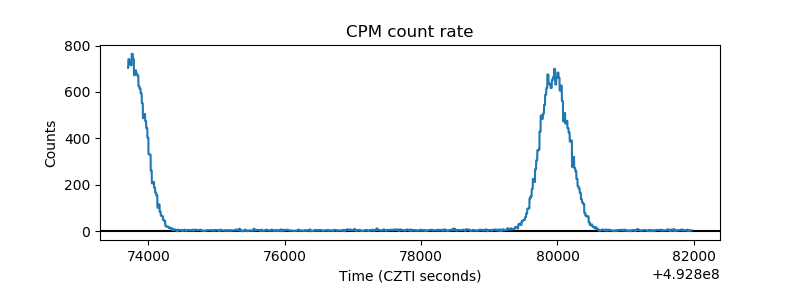 |
| CZT Counter | 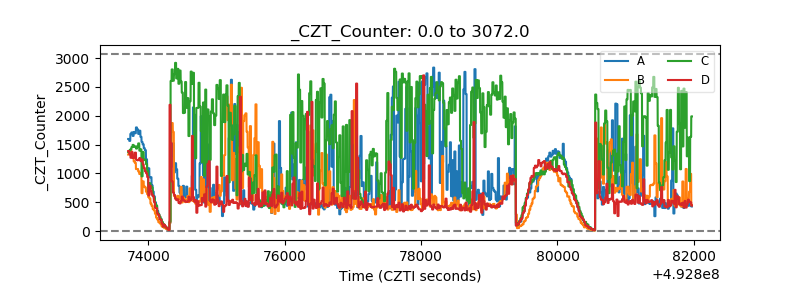 |
| +2.5 Volts monitor | 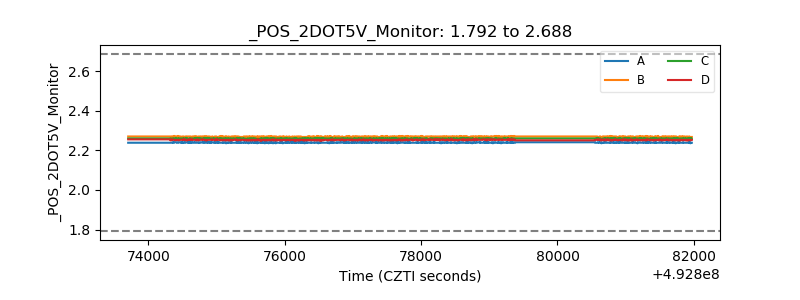 |
| +5 Volts monitor |  |
| _ROLL_ROT | 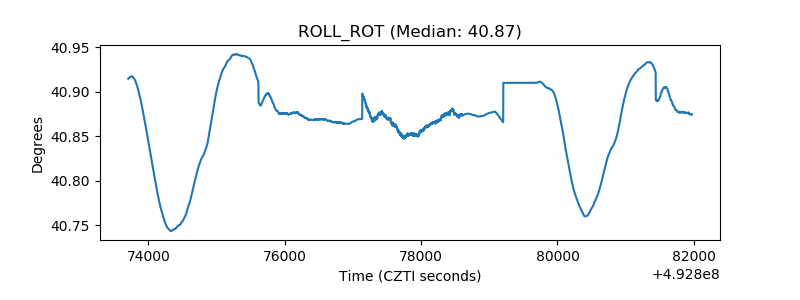 |
| _Roll_DEC | 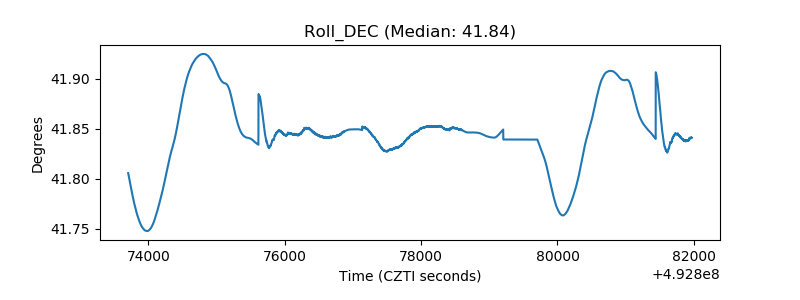 |
| _Roll_RA | 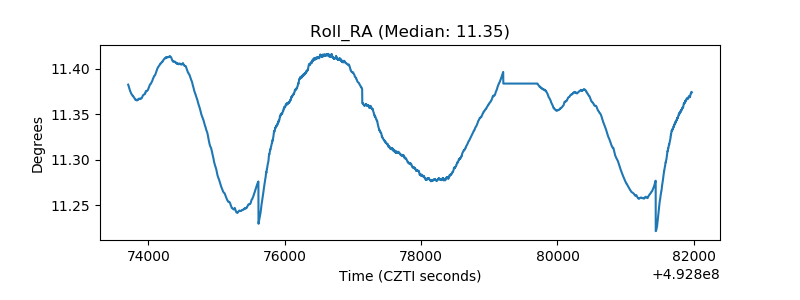 |
| Veto Counter | 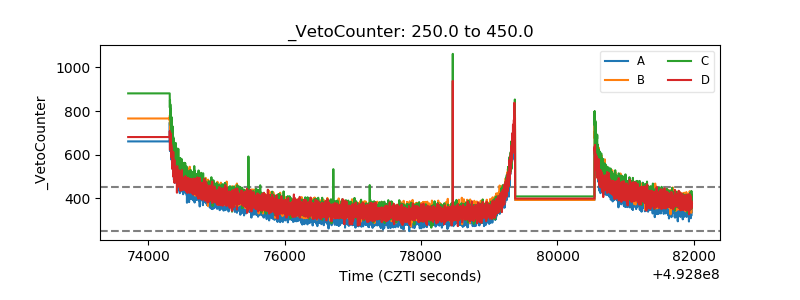 |