| Param | Original file | Final file |
|---|---|---|
| Filename | modeM0/AS1A14_002T06_9000006496_53442cztM0_level2.fits | modeM0/AS1A14_002T06_9000006496_53442cztM0_level2_quad_clean.evt |
| Size (bytes) | 611,447,040 | 94,294,080 |
| Size | 583.1 MB | 89.9 MB |
| Events in quadrant A | 4,277,398 | 642,004 |
| Events in quadrant B | 4,198,535 | 713,532 |
| Events in quadrant C | 9,606,378 | 470,963 |
| Events in quadrant D | 4,049,202 | 577,218 |
| Mode M9 | |||
|---|---|---|---|
| Quadrant | BADHDUFLAG | Total packets | Discarded packets |
| A | 0 | 19 | 0 |
| B | 0 | 20 | 0 |
| C | 0 | 20 | 0 |
| D | 0 | 20 | 0 |
| Mode SS | |||
|---|---|---|---|
| Quadrant | BADHDUFLAG | Total packets | Discarded packets |
| A | 0 | 132 | 0 |
| B | 0 | 132 | 0 |
| C | 0 | 132 | 0 |
| D | 0 | 132 | 0 |
| Mode M0 | |||
|---|---|---|---|
| Quadrant | BADHDUFLAG | Total packets | Discarded packets |
| A | 0 | 17228 | 2 |
| B | 0 | 17019 | 2 |
| C | 0 | 33072 | 2 |
| D | 0 | 16381 | 4 |
| Quadrant | Total seconds | Saturated seconds | Saturation percentage |
|---|---|---|---|
| A | 6477 | 434 | 6.700633% |
| B | 6477 | 319 | 4.925120% |
| C | 6477 | 1970 | 30.415316% |
| D | 6476 | 256 | 3.953057% |
Noise dominated data is calculated using 1-second bins in cleaned event files. If a bin has >2000 counts, and if more than 50% of those come from <1% of pixels, then it is considered to be noise-dominated and hence unusable.
| Quadrant | # 1 sec bins | Bins with >0 counts | Bins with >2000 counts | High rate bins dominated by noise | Noise dominated (total time) | Noise dominated (detector-on time) | Marked lightcurve |
|---|---|---|---|---|---|---|---|
| A | 7627 | 6479 | 230 | 230 | 3.02% | 3.55% | 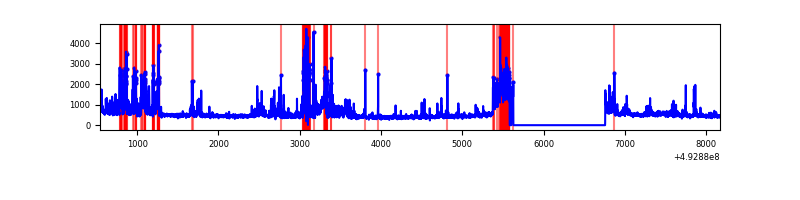 |
| B | 7627 | 6479 | 68 | 68 | 0.89% | 1.05% | 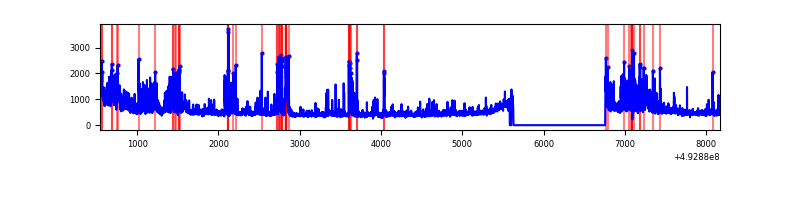 |
| C | 7627 | 6478 | 1525 | 1525 | 19.99% | 23.54% | 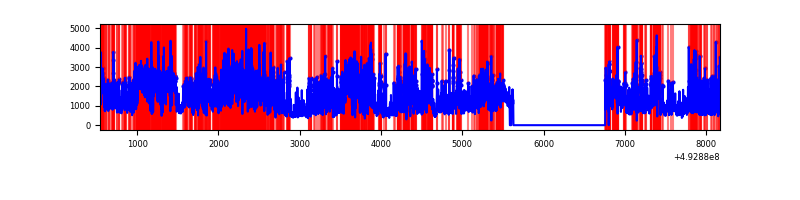 |
| D | 7626 | 6478 | 170 | 170 | 2.23% | 2.62% | 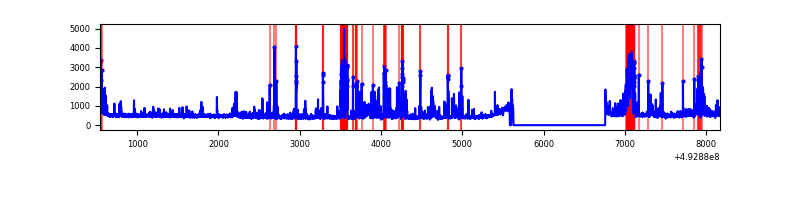 |
Top three noisy pixels from each quadrant. If the there are fewer than three noisy pixels in the level2.evt file, extra rows are filled as -1
| Pixel properties | Quadrant properties | ||||||
|---|---|---|---|---|---|---|---|
| Quadrant | DetID | PixID | Counts | Sigma | Mean | Median | Sigma |
| A | 15 | 174 | 1108568 | 6274.12 | 719 | 703 | 176.6 |
| A | 3 | 78 | 99925 | 561.92 | 719 | 703 | 176.6 |
| A | 4 | 249 | 70935 | 397.74 | 719 | 703 | 176.6 |
| B | 4 | 171 | 528092 | 3410.03 | 732 | 706 | 154.7 |
| B | 0 | 213 | 176994 | 1139.86 | 732 | 706 | 154.7 |
| B | 4 | 206 | 167888 | 1080.98 | 732 | 706 | 154.7 |
| C | 9 | 38 | 2680823 | 15241.95 | 642 | 636 | 175.8 |
| C | 15 | 224 | 2564147 | 14578.42 | 642 | 636 | 175.8 |
| C | 4 | 5 | 637488 | 3621.71 | 642 | 636 | 175.8 |
| D | 15 | 171 | 327819 | 1638.17 | 714 | 684 | 199.7 |
| D | 15 | 254 | 207897 | 1037.64 | 714 | 684 | 199.7 |
| D | 2 | 153 | 194556 | 970.84 | 714 | 684 | 199.7 |
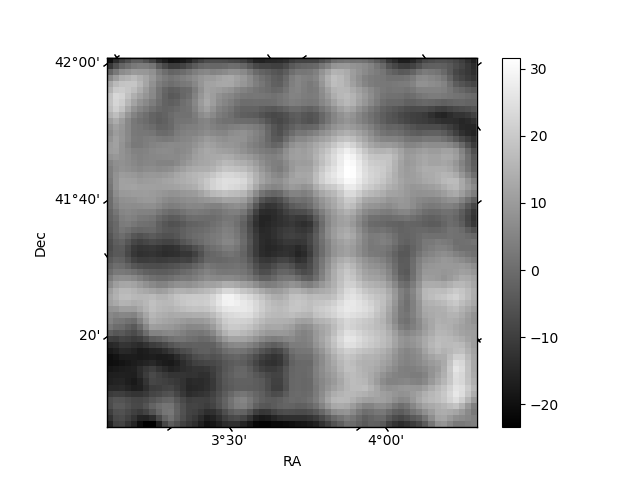
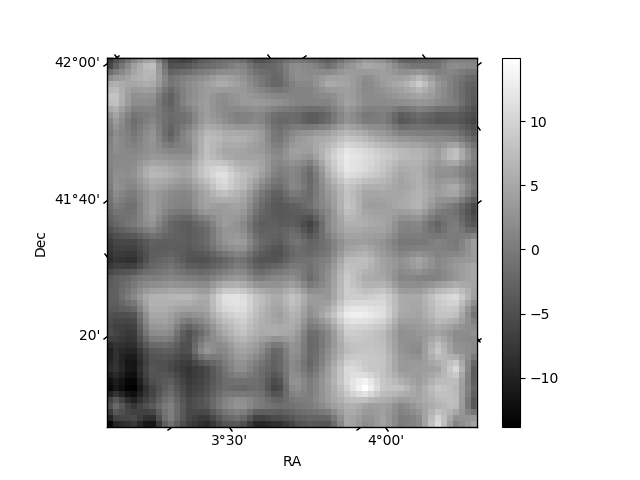
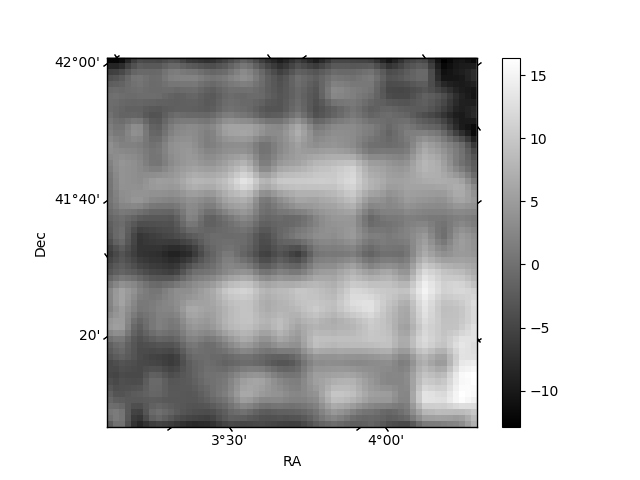
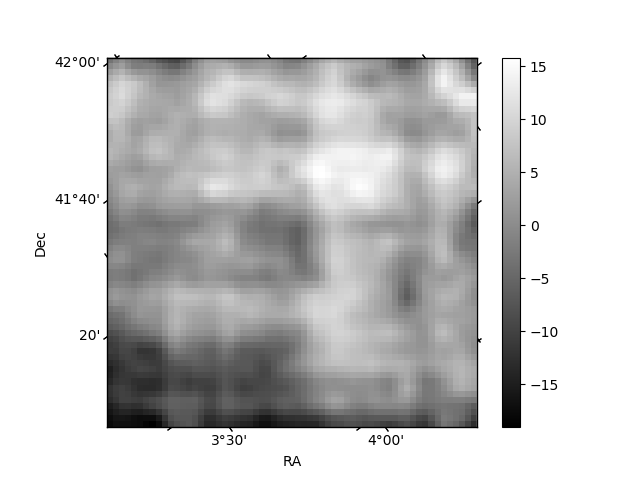
Histogram calculated using DETX and DETY for each event in the final _common_clean file
| Quadrant A | 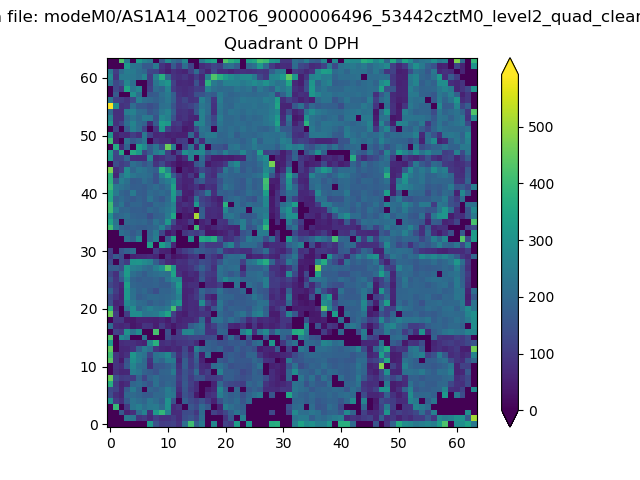 |
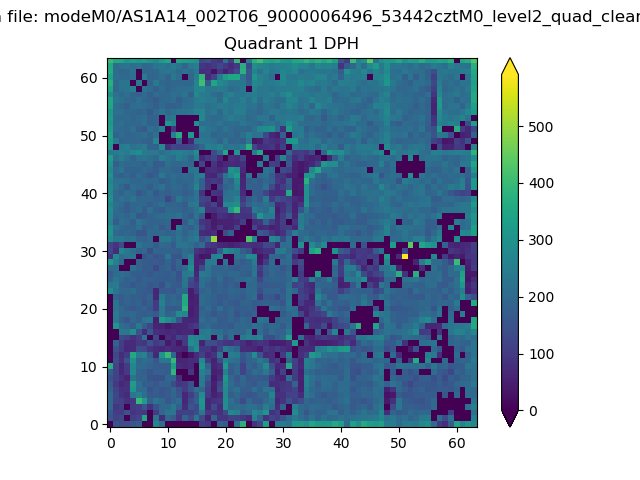 |
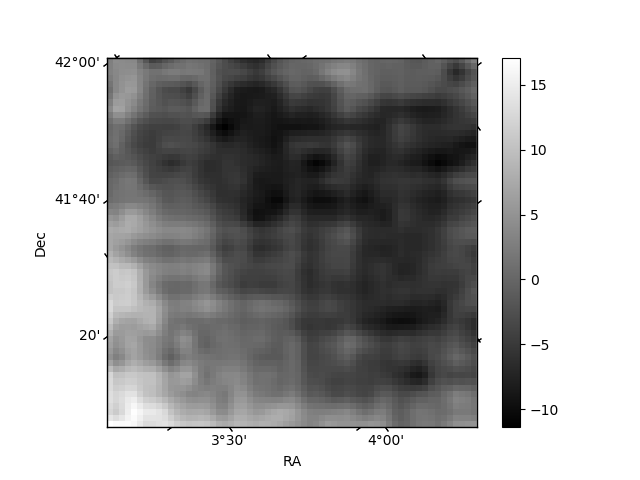
Quadrant B |
|---|---|---|---|
| Quadrant D | 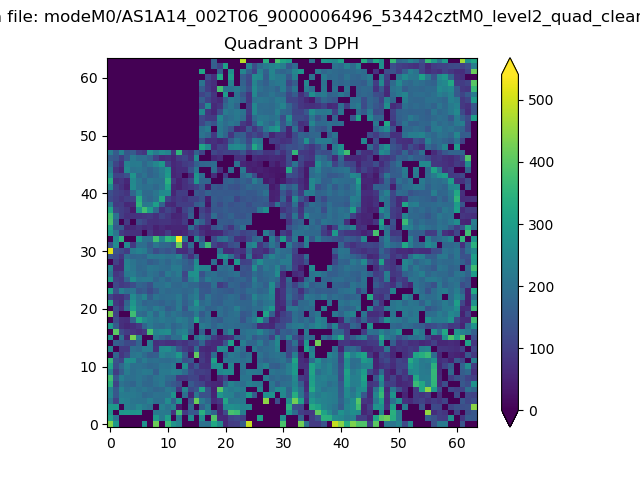 |
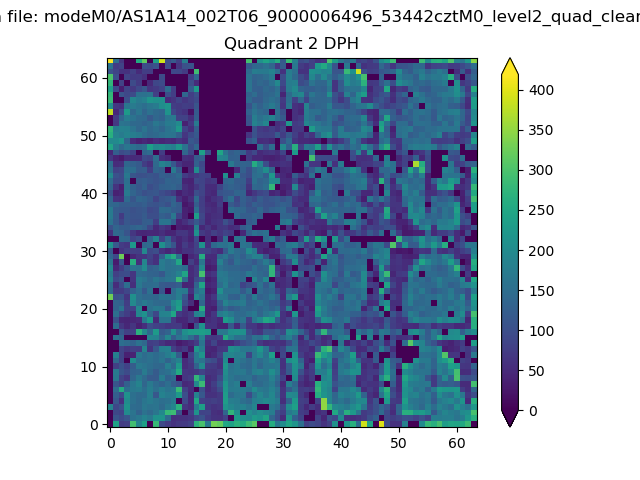 |
Quadrant C |
| Plot type | Count rate plots | Images |
|---|---|---|
| Comparison with Poisson distribution Blue bars denote a histogram of data divided into 1 sec bins. Red curve is a Poisson curve with rate = median count rate of data. |
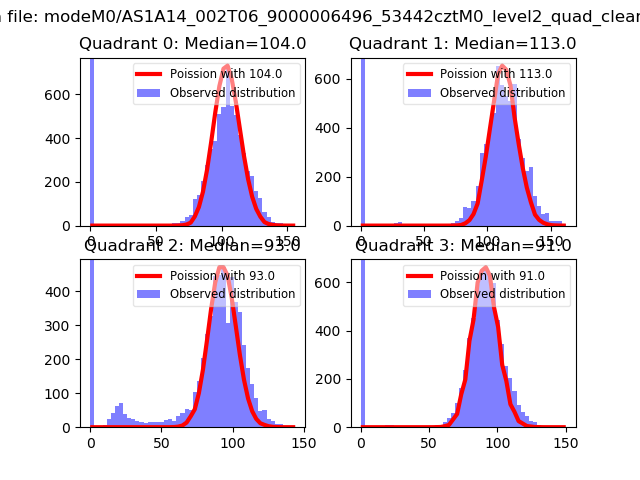 |
 |
| Quadrant-wise count rates Data is divided into 100 sec bins |
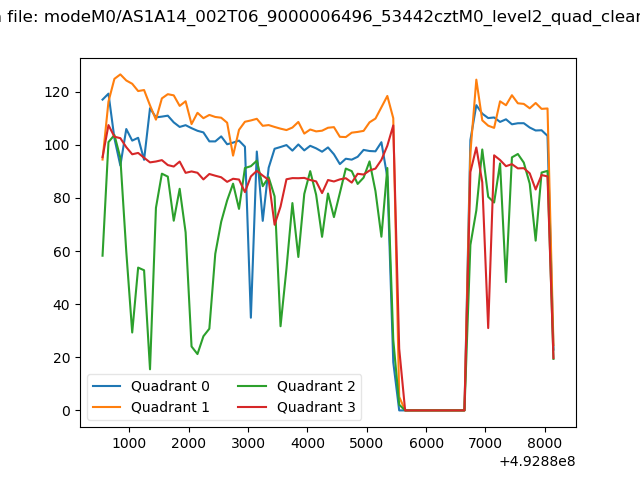 |
|
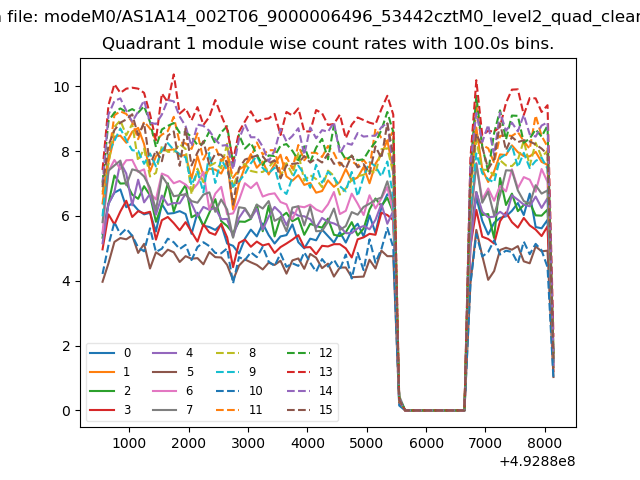
| Module-wise count rates for Quadrant A Data is divided into 100 sec bins |
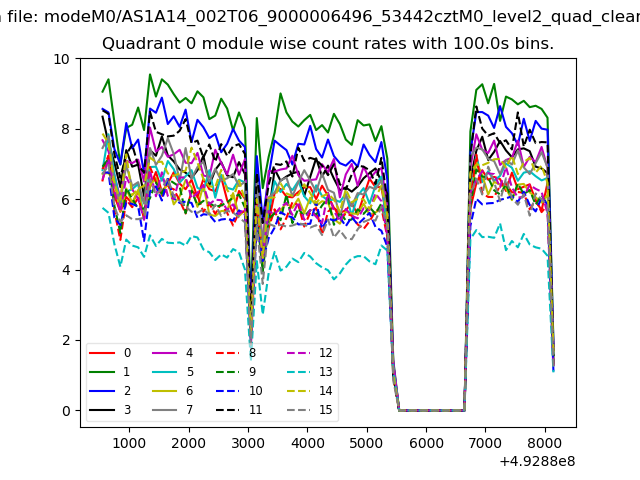 |
 |
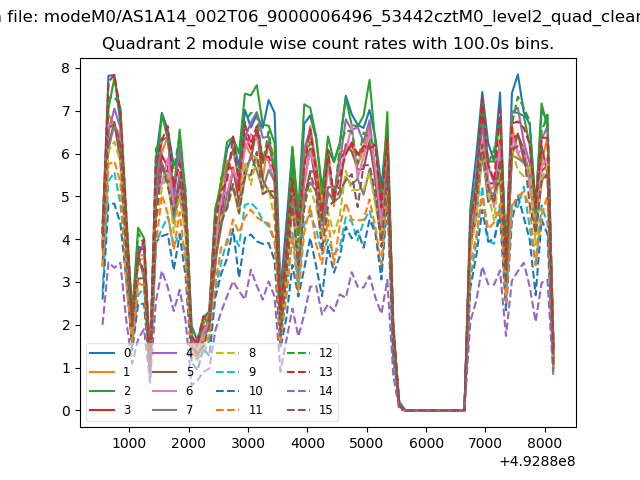
| Module-wise count rates for Quadrant B Data is divided into 100 sec bins |
 |
 |
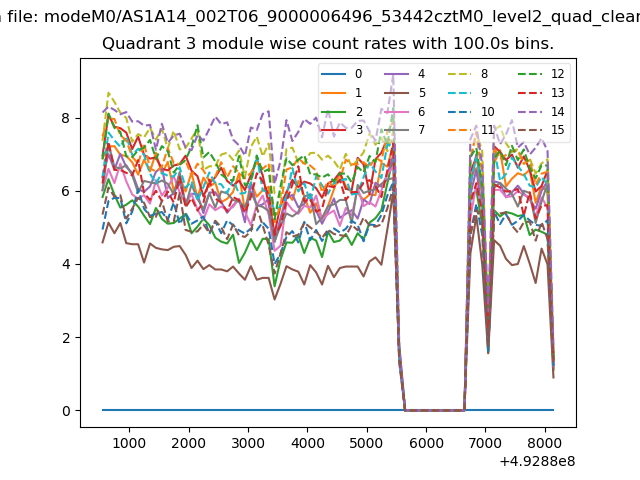
| Module-wise count rates for Quadrant C Data is divided into 100 sec bins |
 |
 |
| Module-wise count rates for Quadrant D Data is divided into 100 sec bins |
 |
 |
| Parameter | Plot |
|---|---|
| CZT HV Monitor | 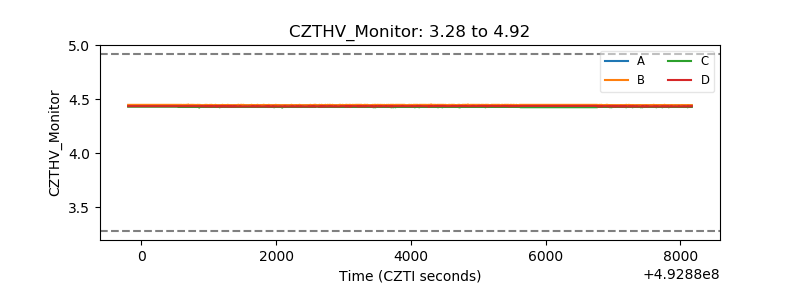 |
| D_VDD | 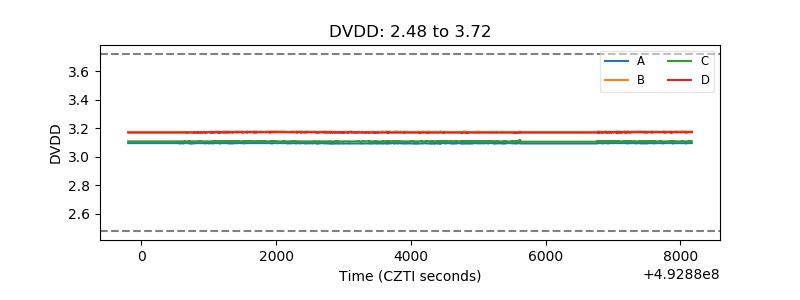 |
| Temperature 1 | 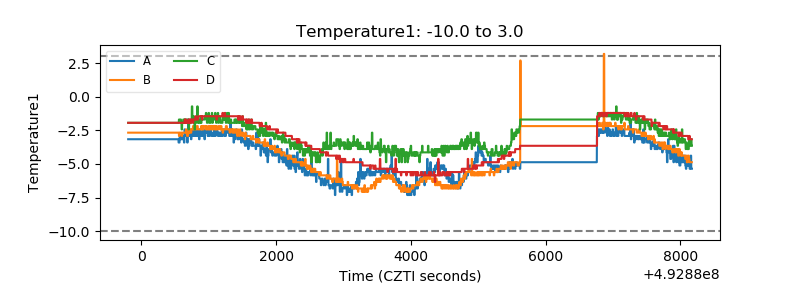 |
| Veto HV Monitor | 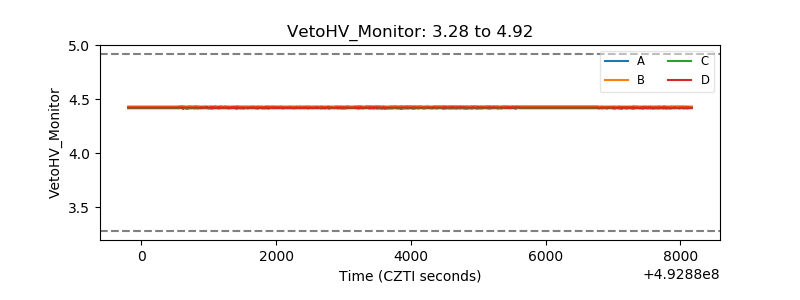 |
| Veto LLD | 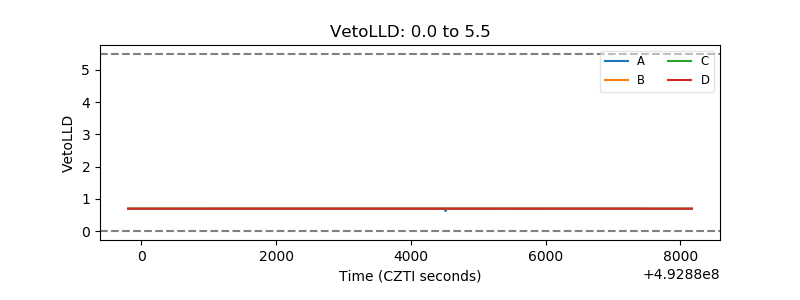 |
| Alpha Counter | 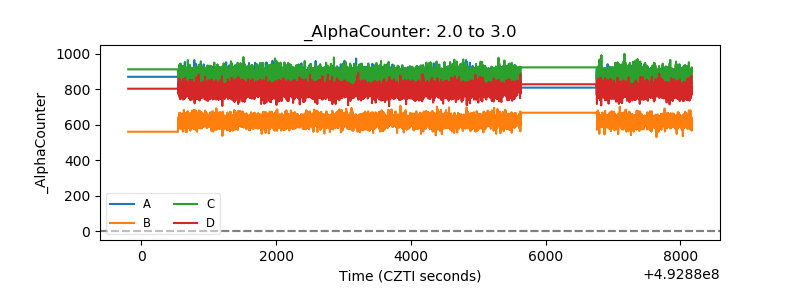 |
| _CPM_Rate | 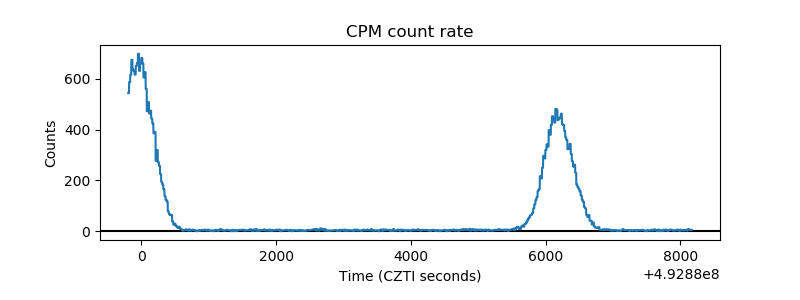 |
| CZT Counter | 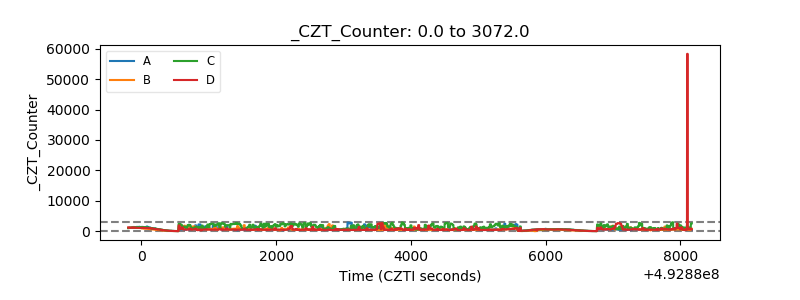 |
| +2.5 Volts monitor |  |
| +5 Volts monitor | 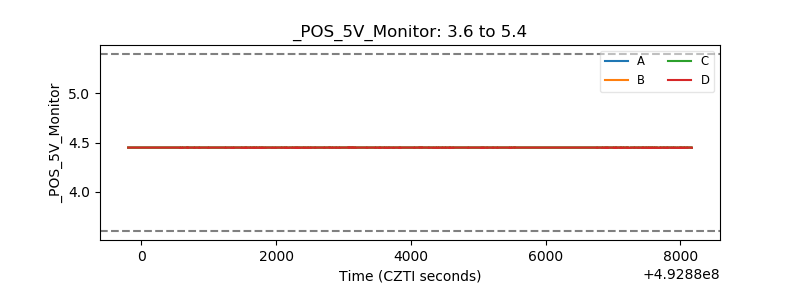 |
| _ROLL_ROT | 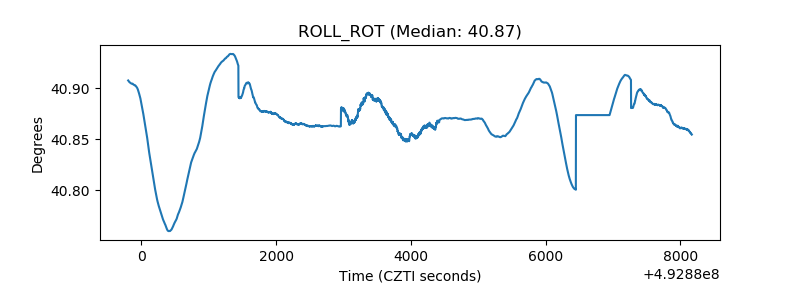 |
| _Roll_DEC | 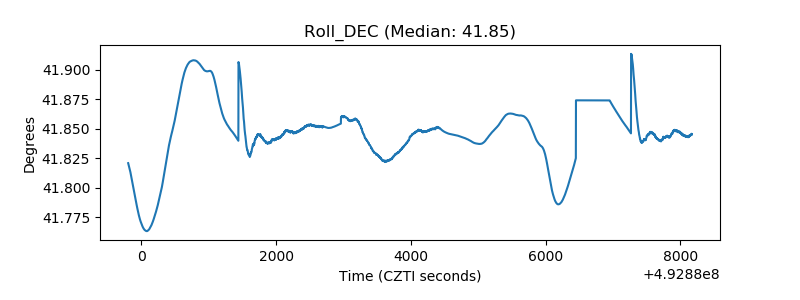 |
| _Roll_RA | 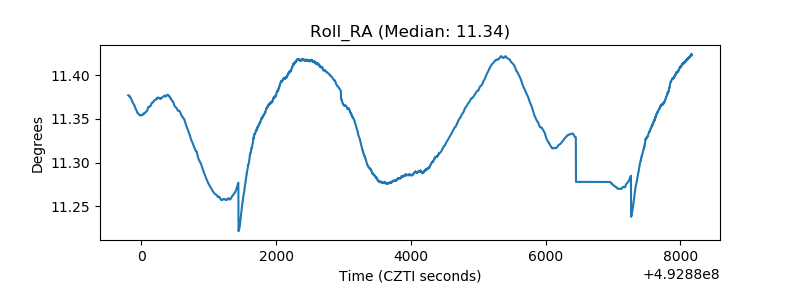 |
| Veto Counter | 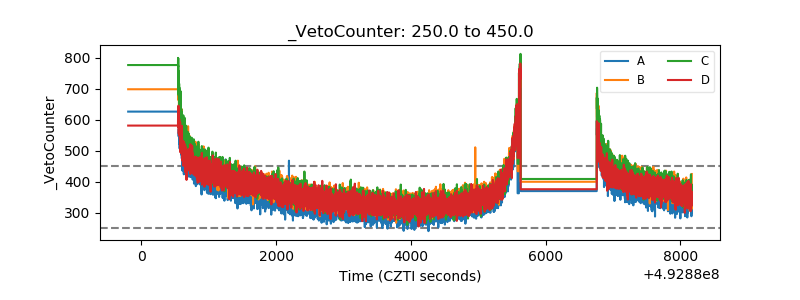 |