| Param | Original file | Final file |
|---|---|---|
| Filename | modeM0/AS1A14_002T06_9000006496_53443cztM0_level2.fits | modeM0/AS1A14_002T06_9000006496_53443cztM0_level2_quad_clean.evt |
| Size (bytes) | 697,279,680 | 90,423,360 |
| Size | 665.0 MB | 86.2 MB |
| Events in quadrant A | 6,601,745 | 581,596 |
| Events in quadrant B | 4,012,180 | 698,576 |
| Events in quadrant C | 10,193,165 | 449,913 |
| Events in quadrant D | 4,500,266 | 553,709 |
| Mode M9 | |||
|---|---|---|---|
| Quadrant | BADHDUFLAG | Total packets | Discarded packets |
| A | 0 | 10 | 0 |
| B | 0 | 10 | 0 |
| C | 0 | 10 | 0 |
| D | 0 | 10 | 0 |
| Mode SS | |||
|---|---|---|---|
| Quadrant | BADHDUFLAG | Total packets | Discarded packets |
| A | 0 | 132 | 0 |
| B | 0 | 132 | 0 |
| C | 0 | 132 | 0 |
| D | 0 | 132 | 0 |
| Mode M0 | |||
|---|---|---|---|
| Quadrant | BADHDUFLAG | Total packets | Discarded packets |
| A | 0 | 23969 | 1 |
| B | 0 | 16327 | 1 |
| C | 0 | 34846 | 1 |
| D | 0 | 17964 | 1 |
| Quadrant | Total seconds | Saturated seconds | Saturation percentage |
|---|---|---|---|
| A | 6508 | 881 | 13.537185% |
| B | 6508 | 189 | 2.904118% |
| C | 6508 | 2119 | 32.559926% |
| D | 6509 | 332 | 5.100630% |
Noise dominated data is calculated using 1-second bins in cleaned event files. If a bin has >2000 counts, and if more than 50% of those come from <1% of pixels, then it is considered to be noise-dominated and hence unusable.
| Quadrant | # 1 sec bins | Bins with >0 counts | Bins with >2000 counts | High rate bins dominated by noise | Noise dominated (total time) | Noise dominated (detector-on time) | Marked lightcurve |
|---|---|---|---|---|---|---|---|
| A | 7538 | 6509 | 771 | 771 | 10.23% | 11.85% | 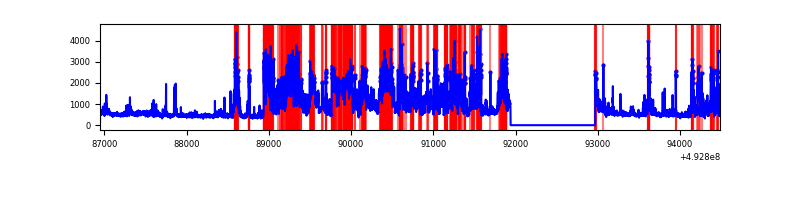 |
| B | 7538 | 6509 | 35 | 35 | 0.46% | 0.54% | 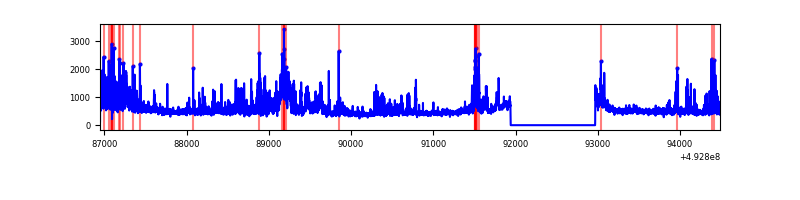 |
| C | 7538 | 6509 | 1769 | 1769 | 23.47% | 27.18% | 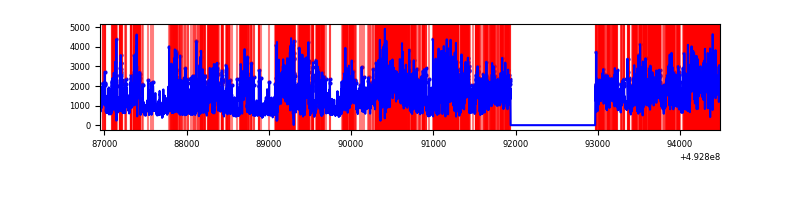 |
| D | 7539 | 6510 | 253 | 253 | 3.36% | 3.89% | 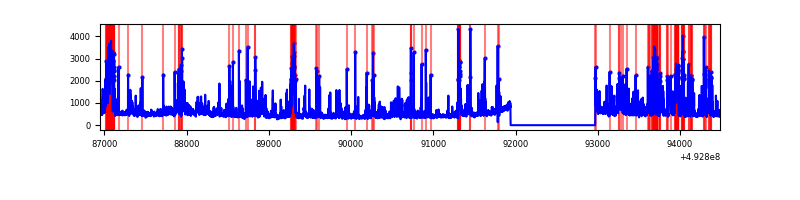 |
Top three noisy pixels from each quadrant. If the there are fewer than three noisy pixels in the level2.evt file, extra rows are filled as -1
| Pixel properties | Quadrant properties | ||||||
|---|---|---|---|---|---|---|---|
| Quadrant | DetID | PixID | Counts | Sigma | Mean | Median | Sigma |
| A | 15 | 174 | 3146790 | 18594.02 | 685 | 669 | 169.2 |
| A | 3 | 63 | 530539 | 3131.6 | 685 | 669 | 169.2 |
| A | 1 | 241 | 73072 | 427.91 | 685 | 669 | 169.2 |
| B | 4 | 171 | 575554 | 3791.08 | 713 | 688 | 151.6 |
| B | 10 | 254 | 226700 | 1490.49 | 713 | 688 | 151.6 |
| B | 0 | 213 | 71628 | 467.83 | 713 | 688 | 151.6 |
| C | 9 | 38 | 3041734 | 18049.31 | 619 | 616 | 168.5 |
| C | 15 | 224 | 2259415 | 13406.18 | 619 | 616 | 168.5 |
| C | 15 | 178 | 1062841 | 6304.4 | 619 | 616 | 168.5 |
| D | 15 | 171 | 406249 | 2086.21 | 686 | 656 | 194.4 |
| D | 2 | 120 | 313043 | 1606.79 | 686 | 656 | 194.4 |
| D | 15 | 254 | 247735 | 1270.88 | 686 | 656 | 194.4 |
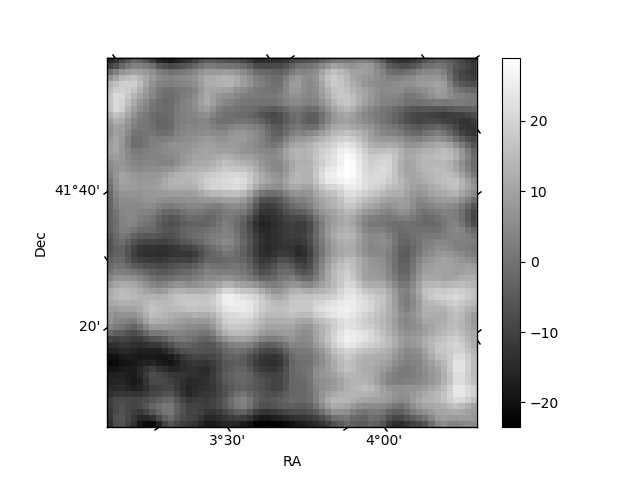
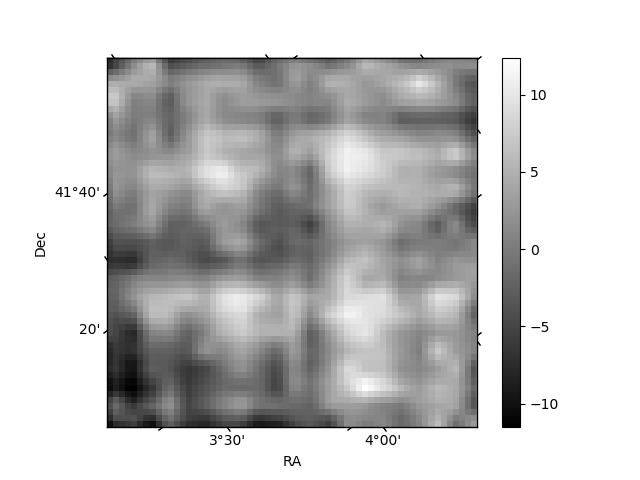
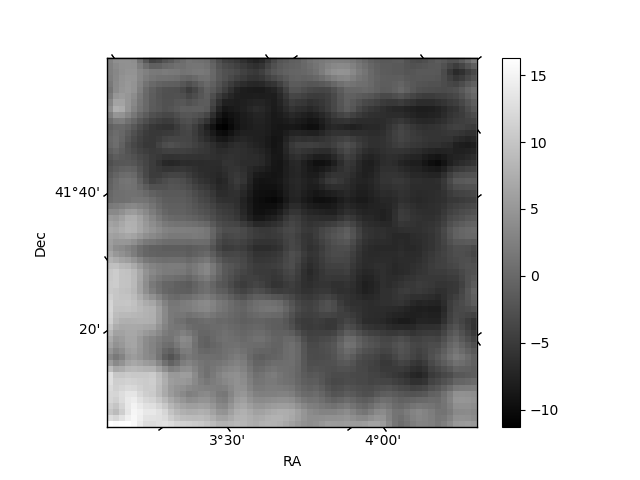
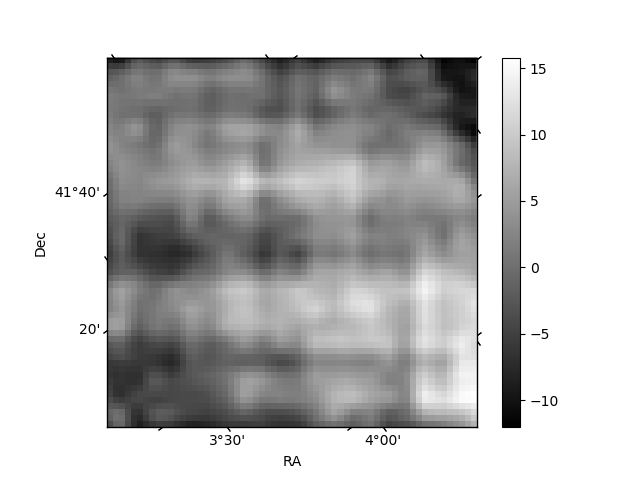
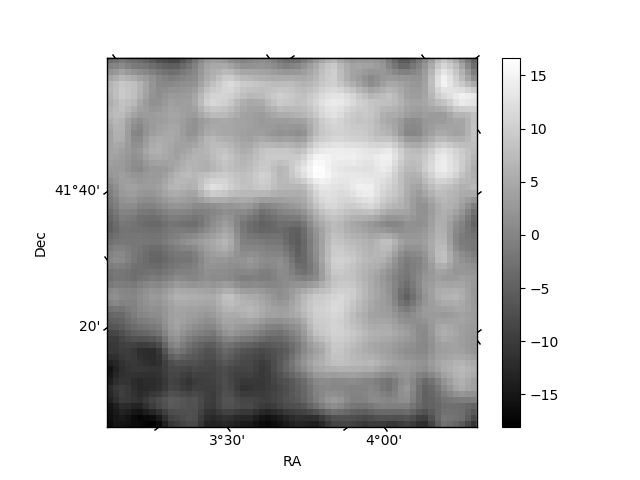
Histogram calculated using DETX and DETY for each event in the final _common_clean file
| Quadrant A | 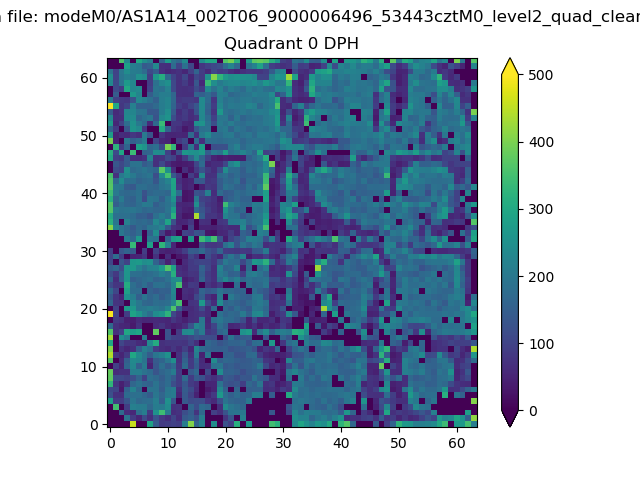 |
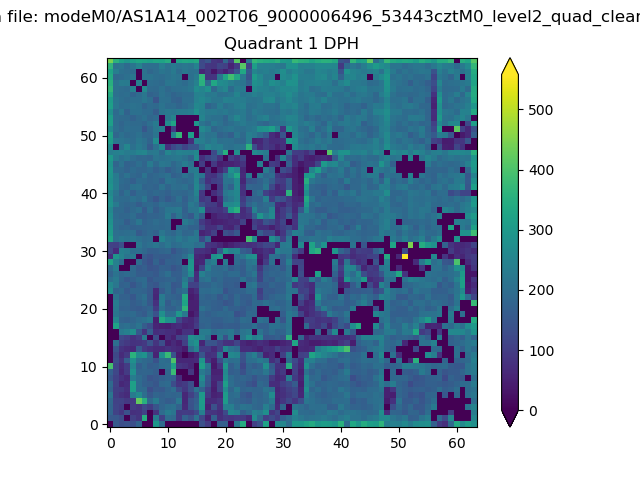 |
Quadrant B |
|---|---|---|---|
| Quadrant D | 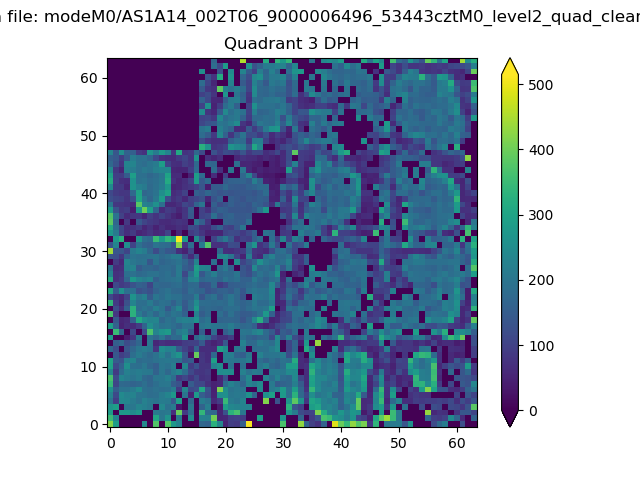 |
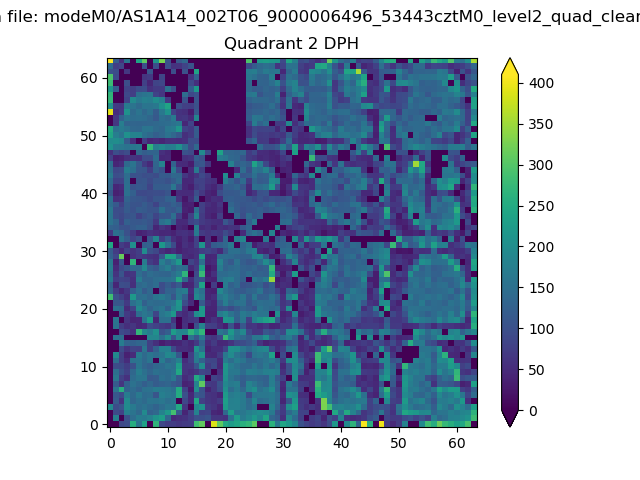 |
Quadrant C |
| Plot type | Count rate plots | Images |
|---|---|---|
| Comparison with Poisson distribution Blue bars denote a histogram of data divided into 1 sec bins. Red curve is a Poisson curve with rate = median count rate of data. |
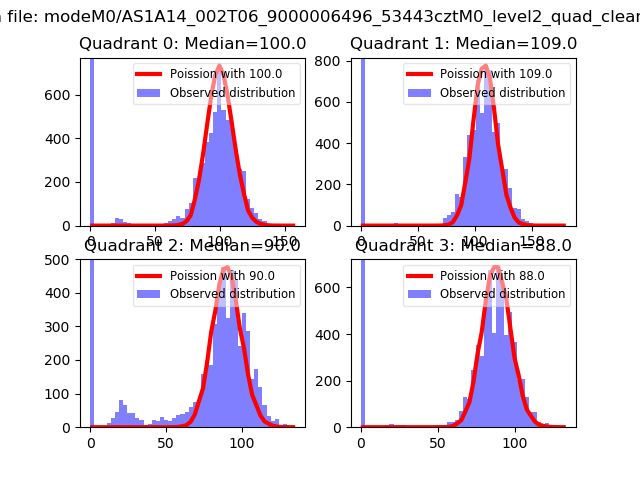 |
 |
| Quadrant-wise count rates Data is divided into 100 sec bins |
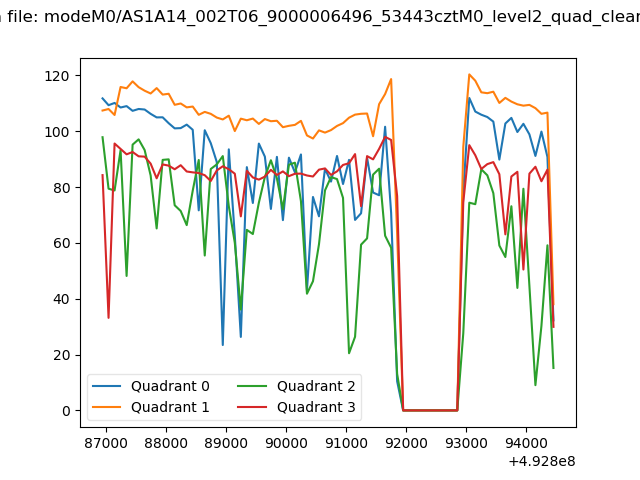 |
|
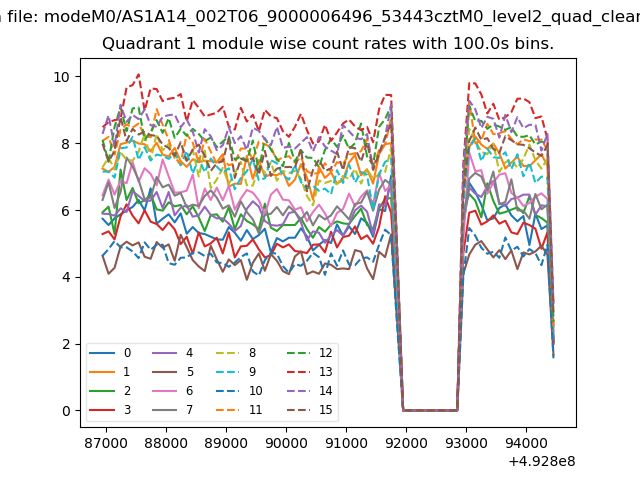
| Module-wise count rates for Quadrant A Data is divided into 100 sec bins |
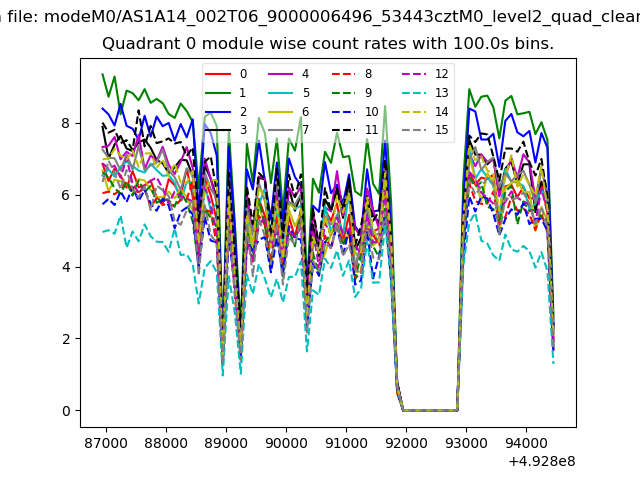 |
 |
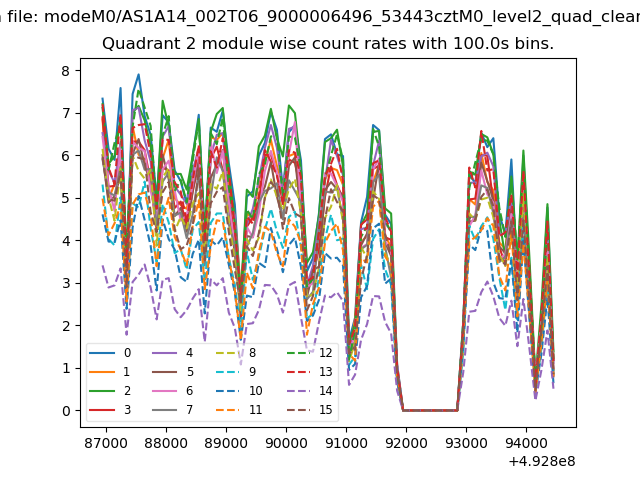
| Module-wise count rates for Quadrant B Data is divided into 100 sec bins |
 |
 |
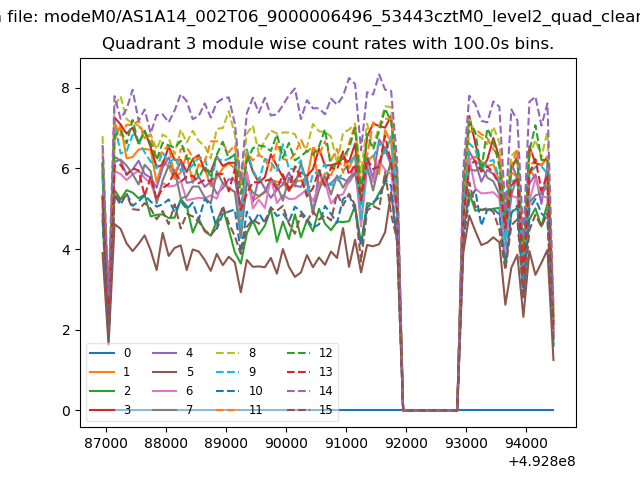
| Module-wise count rates for Quadrant C Data is divided into 100 sec bins |
 |
 |
| Module-wise count rates for Quadrant D Data is divided into 100 sec bins |
 |
 |
| Parameter | Plot |
|---|---|
| CZT HV Monitor | 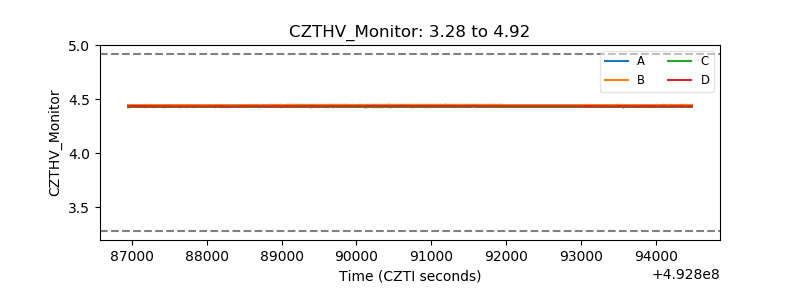 |
| D_VDD | 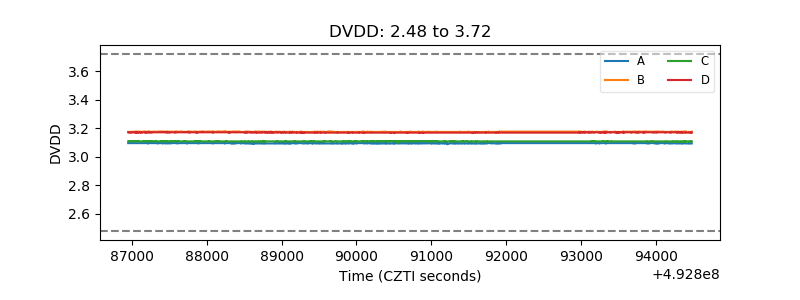 |
| Temperature 1 | 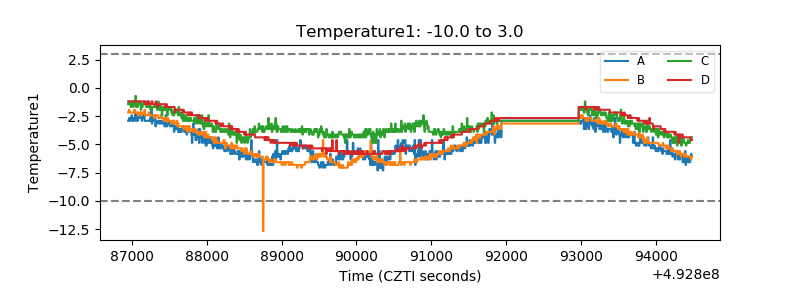 |
| Veto HV Monitor |  |
| Veto LLD | 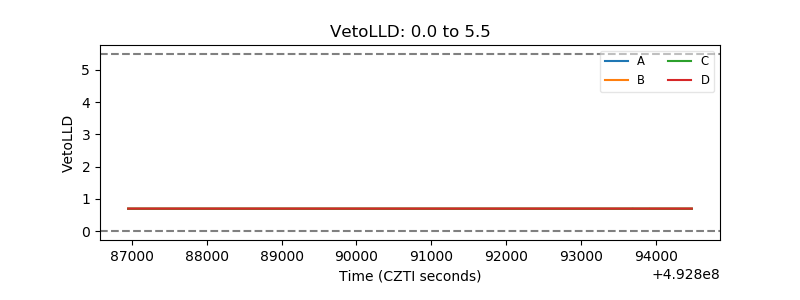 |
| Alpha Counter | 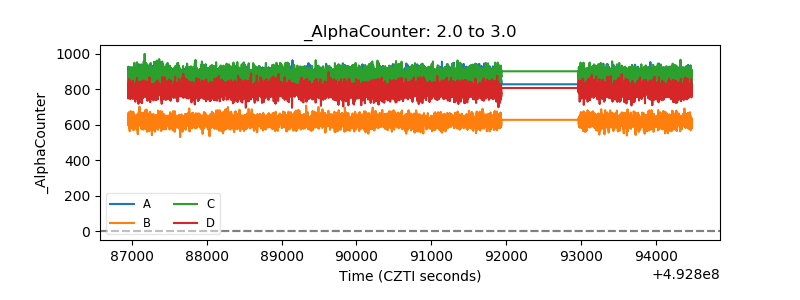 |
| _CPM_Rate |  |
| CZT Counter | 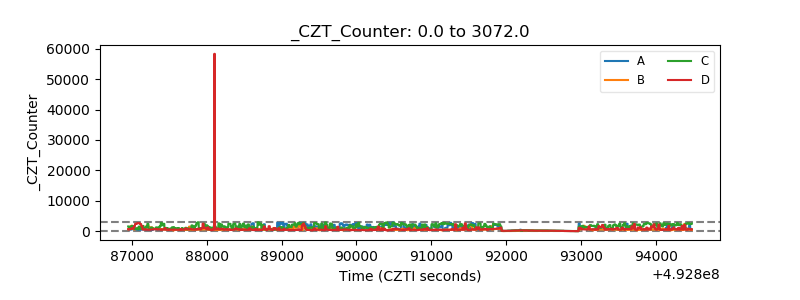 |
| +2.5 Volts monitor |  |
| +5 Volts monitor |  |
| _ROLL_ROT | 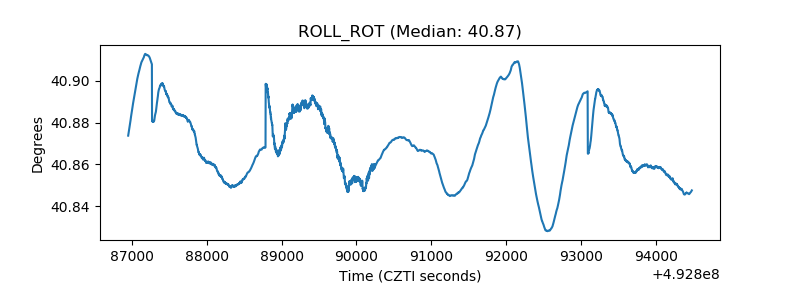 |
| _Roll_DEC | 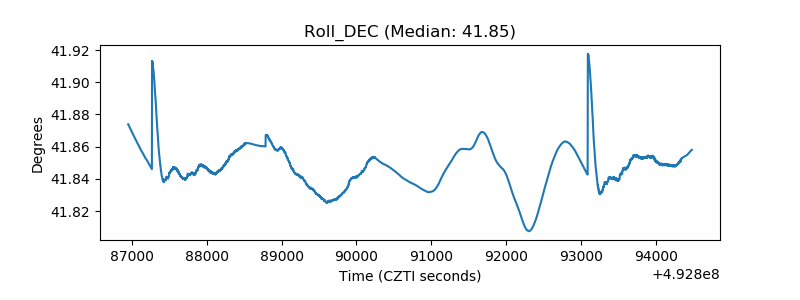 |
| _Roll_RA | 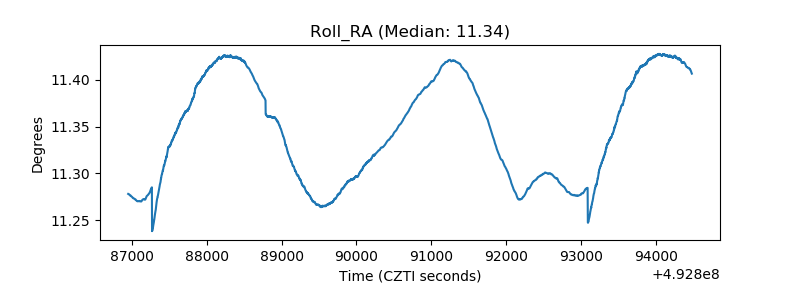 |
| Veto Counter | 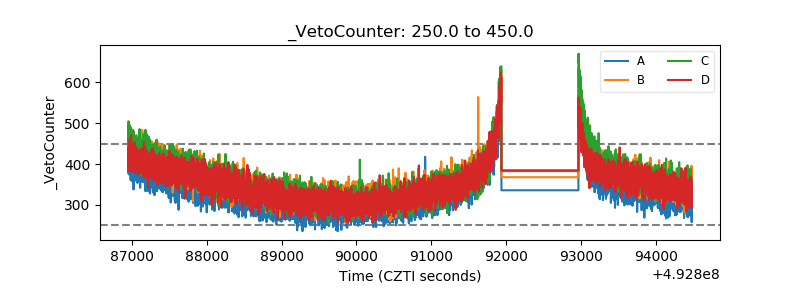 |