| Param | Original file | Final file |
|---|---|---|
| Filename | modeM0/AS1A14_002T06_9000006496_53444cztM0_level2.fits | modeM0/AS1A14_002T06_9000006496_53444cztM0_level2_quad_clean.evt |
| Size (bytes) | 702,391,680 | 91,848,960 |
| Size | 669.9 MB | 87.6 MB |
| Events in quadrant A | 6,229,423 | 580,197 |
| Events in quadrant B | 4,381,151 | 705,144 |
| Events in quadrant C | 9,852,660 | 460,279 |
| Events in quadrant D | 5,013,951 | 564,266 |
| Mode M9 | |||
|---|---|---|---|
| Quadrant | BADHDUFLAG | Total packets | Discarded packets |
| A | 0 | 7 | 0 |
| B | 0 | 7 | 0 |
| C | 0 | 7 | 0 |
| D | 0 | 7 | 0 |
| Mode SS | |||
|---|---|---|---|
| Quadrant | BADHDUFLAG | Total packets | Discarded packets |
| A | 0 | 138 | 0 |
| B | 0 | 138 | 0 |
| C | 0 | 138 | 0 |
| D | 0 | 138 | 0 |
| Mode M0 | |||
|---|---|---|---|
| Quadrant | BADHDUFLAG | Total packets | Discarded packets |
| A | 0 | 23067 | 1 |
| B | 0 | 17558 | 1 |
| C | 0 | 33925 | 1 |
| D | 0 | 19716 | 1 |
| Quadrant | Total seconds | Saturated seconds | Saturation percentage |
|---|---|---|---|
| A | 6755 | 982 | 14.537380% |
| B | 6755 | 181 | 2.679497% |
| C | 6755 | 2132 | 31.561806% |
| D | 6755 | 410 | 6.069578% |
Noise dominated data is calculated using 1-second bins in cleaned event files. If a bin has >2000 counts, and if more than 50% of those come from <1% of pixels, then it is considered to be noise-dominated and hence unusable.
| Quadrant | # 1 sec bins | Bins with >0 counts | Bins with >2000 counts | High rate bins dominated by noise | Noise dominated (total time) | Noise dominated (detector-on time) | Marked lightcurve |
|---|---|---|---|---|---|---|---|
| A | 7480 | 6756 | 767 | 767 | 10.25% | 11.35% | 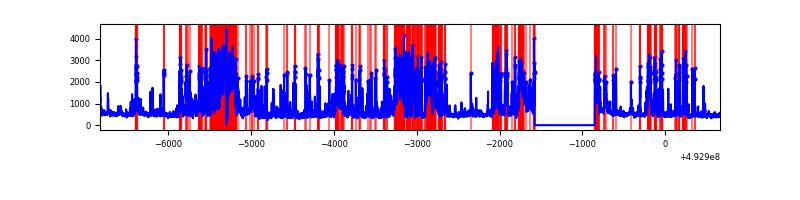 |
| B | 7480 | 6756 | 58 | 58 | 0.78% | 0.86% | 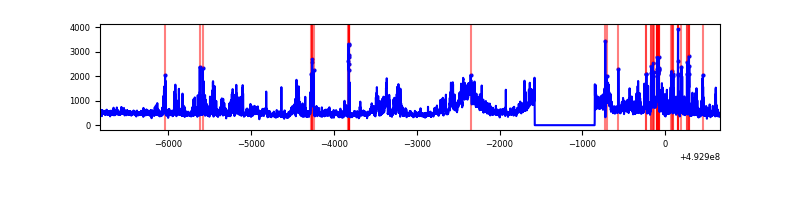 |
| C | 7480 | 6755 | 1844 | 1844 | 24.65% | 27.30% | 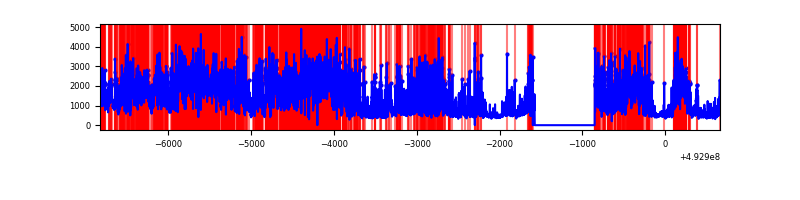 |
| D | 7480 | 6756 | 372 | 372 | 4.97% | 5.51% | 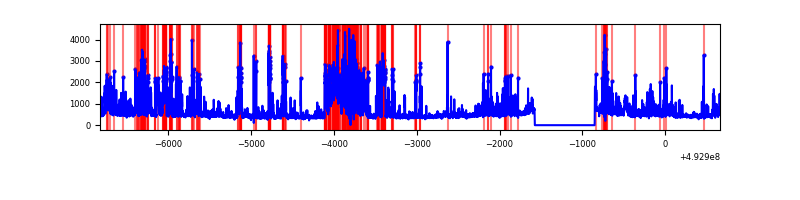 |
Top three noisy pixels from each quadrant. If the there are fewer than three noisy pixels in the level2.evt file, extra rows are filled as -1
| Pixel properties | Quadrant properties | ||||||
|---|---|---|---|---|---|---|---|
| Quadrant | DetID | PixID | Counts | Sigma | Mean | Median | Sigma |
| A | 3 | 63 | 2102217 | 12620.25 | 679 | 665 | 166.5 |
| A | 15 | 174 | 1173153 | 7041.03 | 679 | 665 | 166.5 |
| A | 3 | 14 | 105655 | 630.49 | 679 | 665 | 166.5 |
| B | 10 | 254 | 646259 | 4212.91 | 721 | 697 | 153.2 |
| B | 4 | 171 | 366109 | 2384.67 | 721 | 697 | 153.2 |
| B | 15 | 20 | 137867 | 895.17 | 721 | 697 | 153.2 |
| C | 9 | 38 | 2690871 | 15295.35 | 637 | 631 | 175.9 |
| C | 15 | 224 | 2071743 | 11775.3 | 637 | 631 | 175.9 |
| C | 15 | 178 | 1085917 | 6170.39 | 637 | 631 | 175.9 |
| D | 2 | 172 | 702432 | 3534.5 | 694 | 662 | 198.5 |
| D | 15 | 171 | 332815 | 1672.9 | 694 | 662 | 198.5 |
| D | 3 | 12 | 311573 | 1565.92 | 694 | 662 | 198.5 |
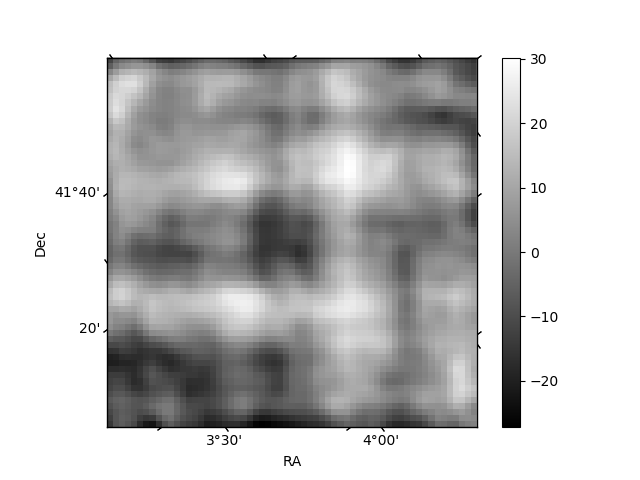
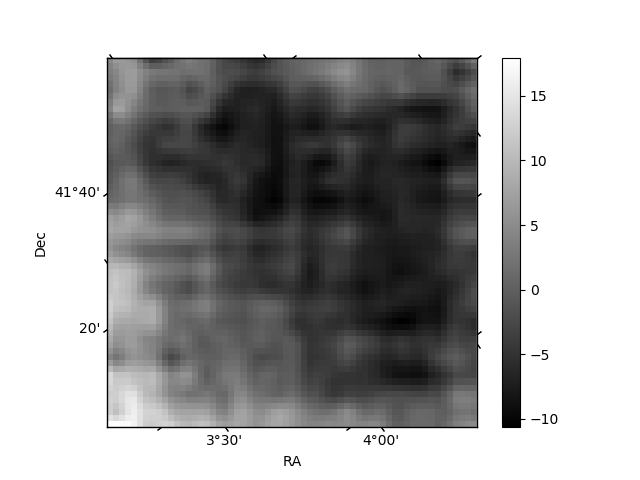
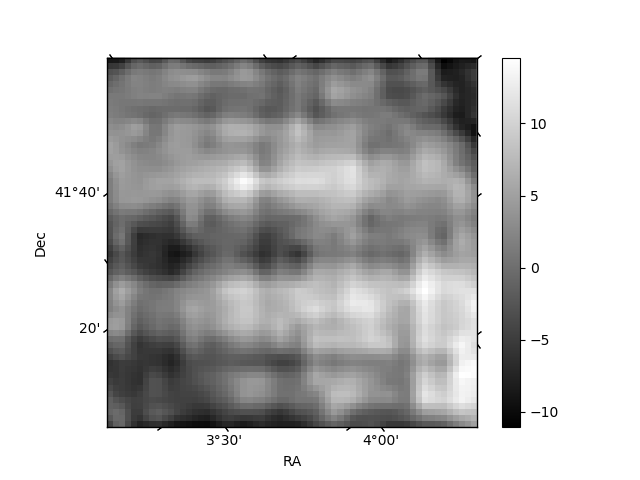
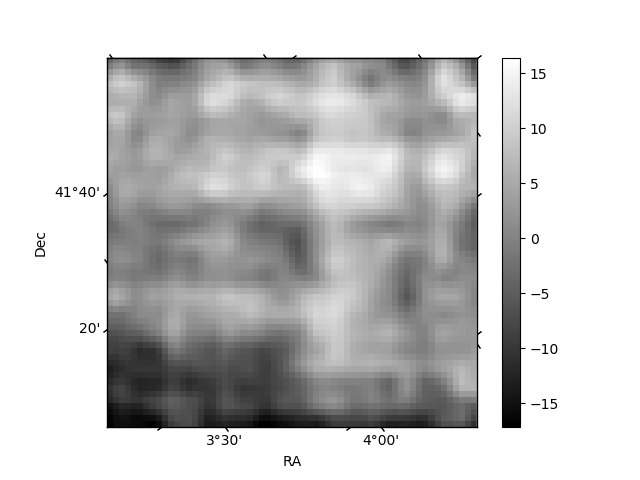
Histogram calculated using DETX and DETY for each event in the final _common_clean file
| Quadrant A | 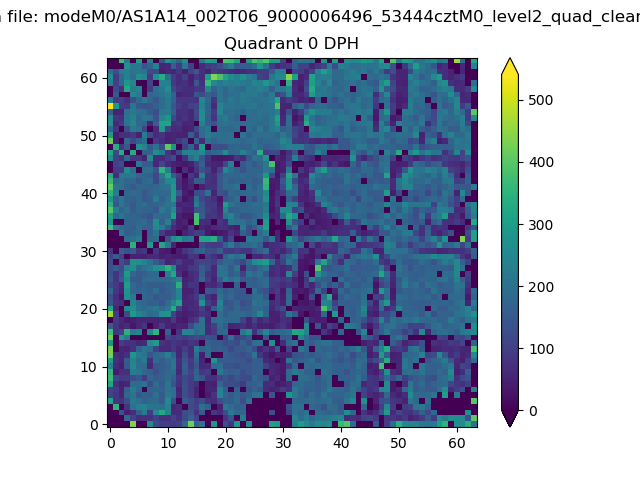 |
 |
Quadrant B |
|---|---|---|---|
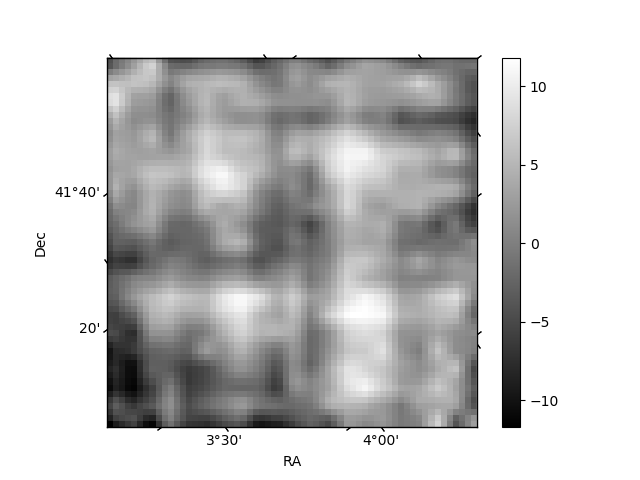
| Quadrant D | 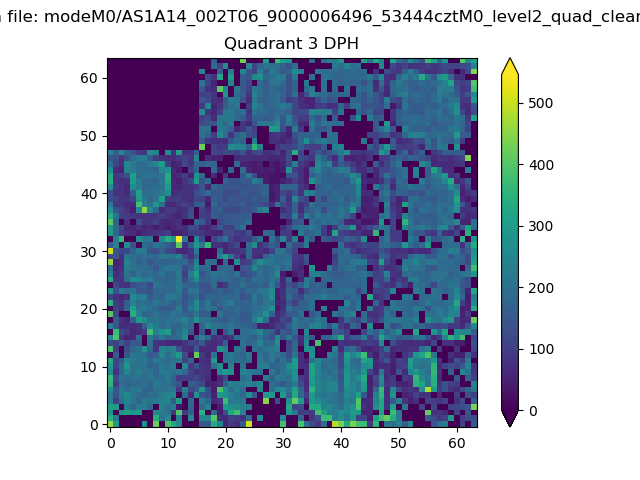 |
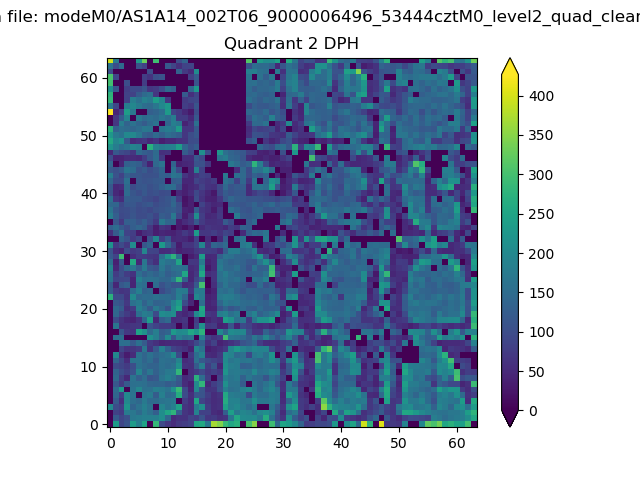 |
Quadrant C |
| Plot type | Count rate plots | Images |
|---|---|---|
| Comparison with Poisson distribution Blue bars denote a histogram of data divided into 1 sec bins. Red curve is a Poisson curve with rate = median count rate of data. |
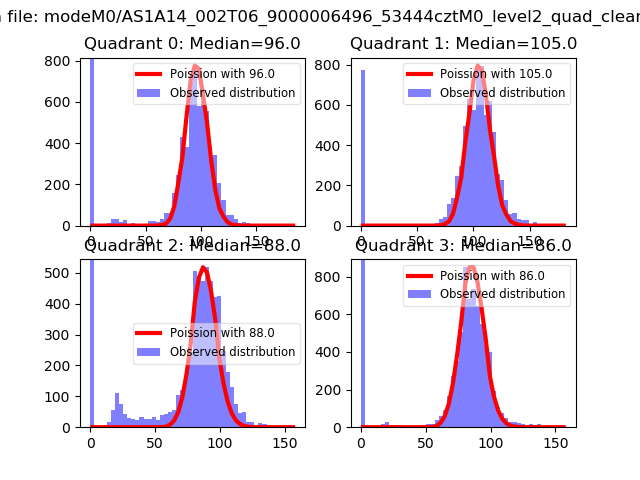 |
 |
| Quadrant-wise count rates Data is divided into 100 sec bins |
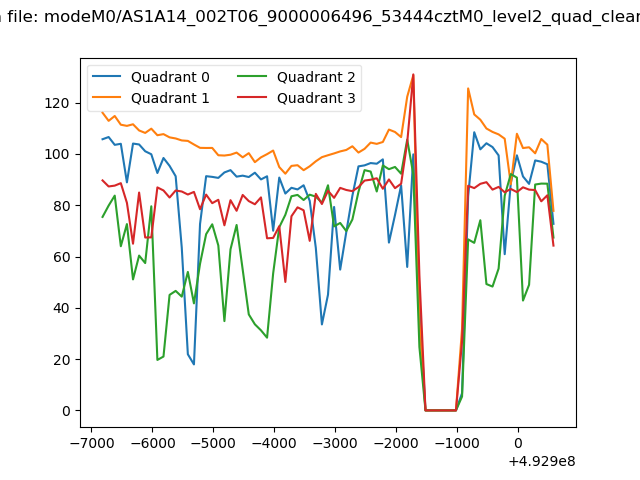 |
|
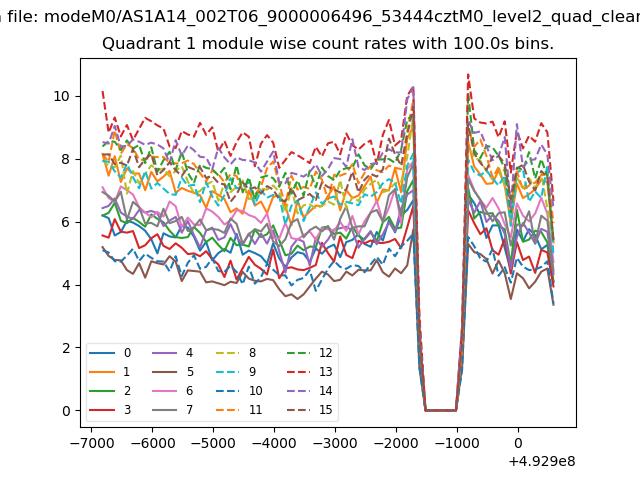
| Module-wise count rates for Quadrant A Data is divided into 100 sec bins |
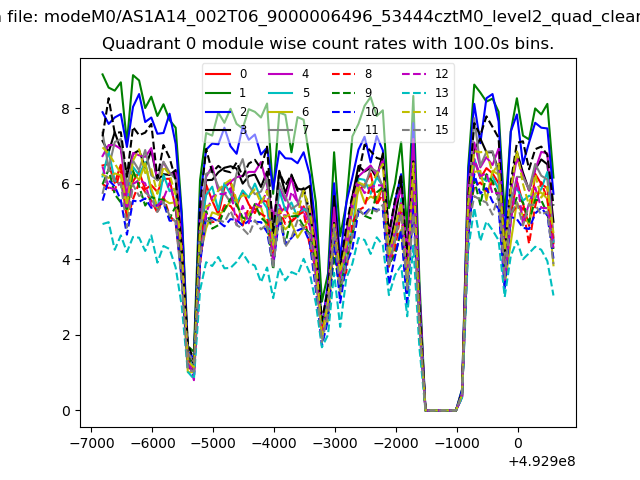 |
 |
| Module-wise count rates for Quadrant B Data is divided into 100 sec bins |
 |
 |
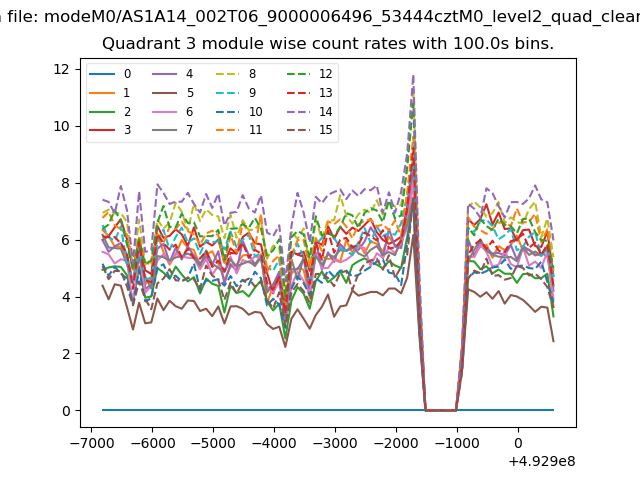
| Module-wise count rates for Quadrant C Data is divided into 100 sec bins |
 |
 |
| Module-wise count rates for Quadrant D Data is divided into 100 sec bins |
 |
 |
| Parameter | Plot |
|---|---|
| CZT HV Monitor | 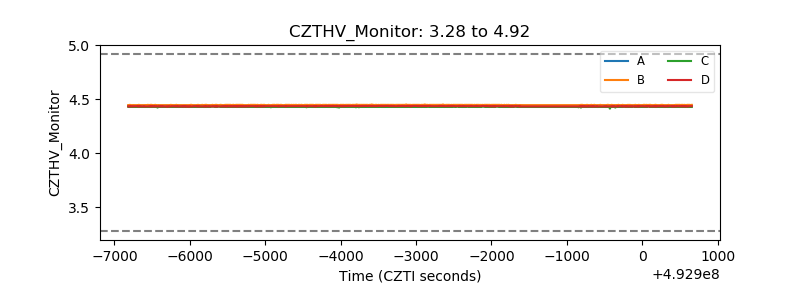 |
| D_VDD | 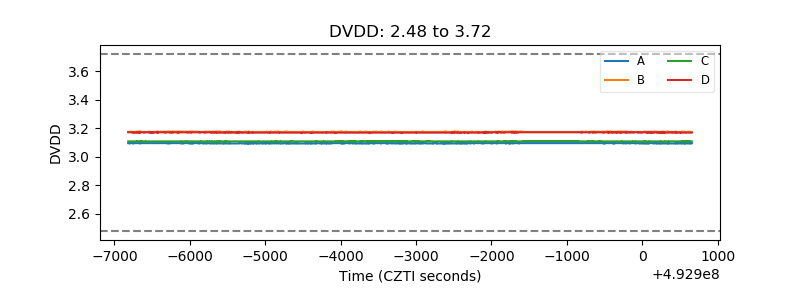 |
| Temperature 1 | 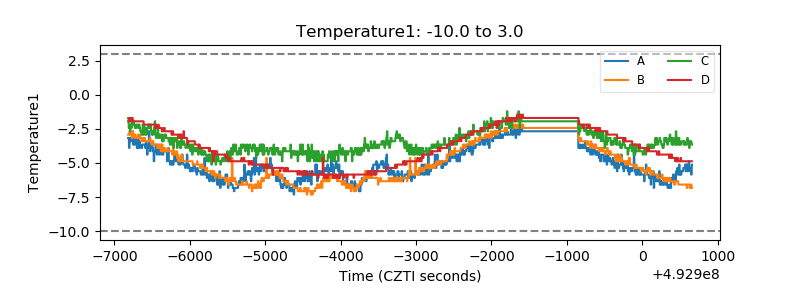 |
| Veto HV Monitor |  |
| Veto LLD | 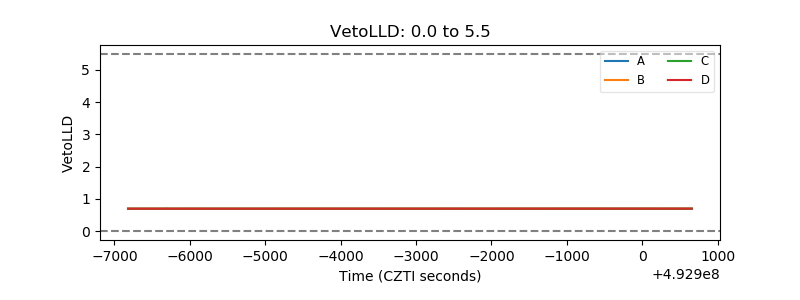 |
| Alpha Counter | 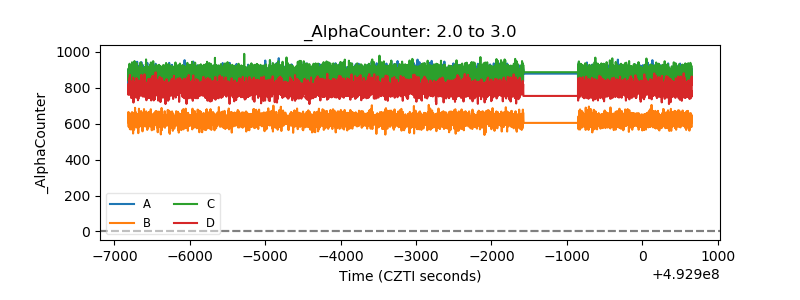 |
| _CPM_Rate | 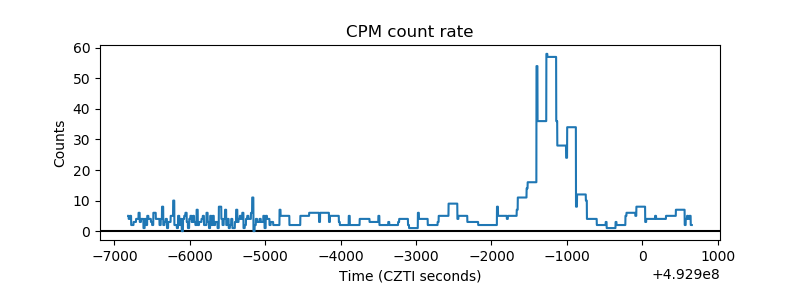 |
| CZT Counter | 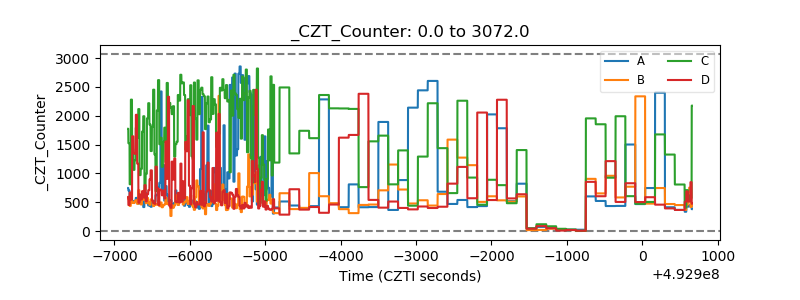 |
| +2.5 Volts monitor |  |
| +5 Volts monitor |  |
| _ROLL_ROT | 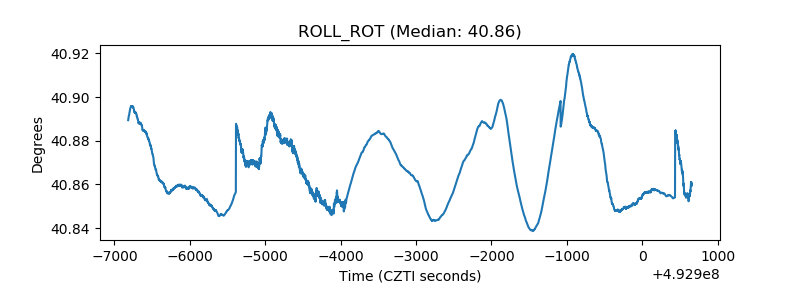 |
| _Roll_DEC | 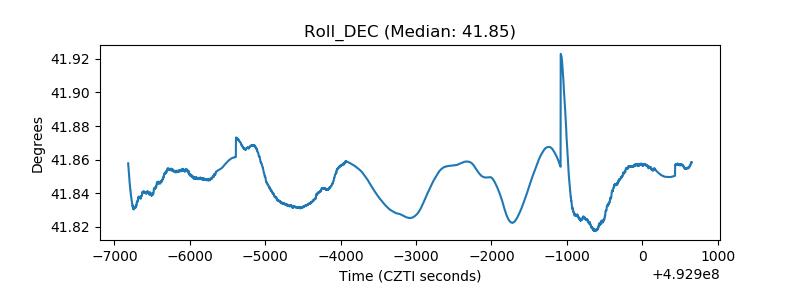 |
| _Roll_RA | 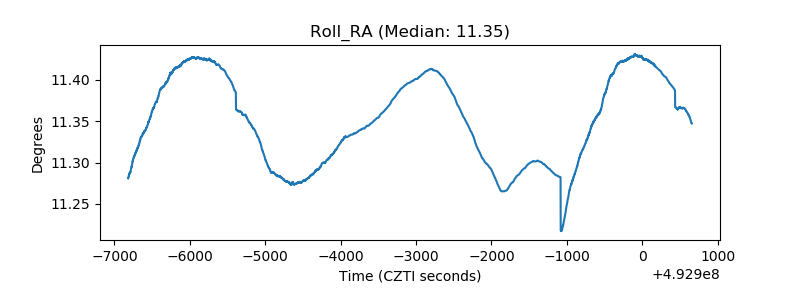 |
| Veto Counter | 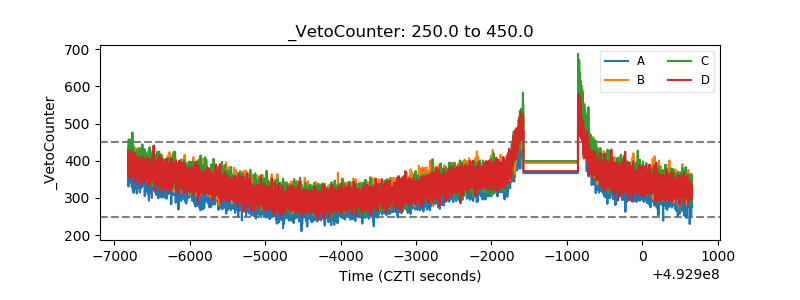 |