| Param | Original file | Final file |
|---|---|---|
| Filename | modeM0/AS1A14_002T06_9000006496_53445cztM0_level2.fits | modeM0/AS1A14_002T06_9000006496_53445cztM0_level2_quad_clean.evt |
| Size (bytes) | 797,503,680 | 107,576,640 |
| Size | 760.6 MB | 102.6 MB |
| Events in quadrant A | 8,658,919 | 651,615 |
| Events in quadrant B | 5,739,637 | 789,278 |
| Events in quadrant C | 9,337,772 | 605,593 |
| Events in quadrant D | 5,176,031 | 663,669 |
| Mode SS | |||
|---|---|---|---|
| Quadrant | BADHDUFLAG | Total packets | Discarded packets |
| A | 0 | 158 | 0 |
| B | 0 | 158 | 0 |
| C | 0 | 158 | 0 |
| D | 0 | 158 | 0 |
| Mode M0 | |||
|---|---|---|---|
| Quadrant | BADHDUFLAG | Total packets | Discarded packets |
| A | 0 | 31093 | 1 |
| B | 0 | 22710 | 1 |
| C | 0 | 33203 | 1 |
| D | 0 | 20984 | 1 |
| Quadrant | Total seconds | Saturated seconds | Saturation percentage |
|---|---|---|---|
| A | 7863 | 1519 | 19.318326% |
| B | 7864 | 683 | 8.685148% |
| C | 7864 | 1618 | 20.574771% |
| D | 7864 | 332 | 4.221770% |
Noise dominated data is calculated using 1-second bins in cleaned event files. If a bin has >2000 counts, and if more than 50% of those come from <1% of pixels, then it is considered to be noise-dominated and hence unusable.
| Quadrant | # 1 sec bins | Bins with >0 counts | Bins with >2000 counts | High rate bins dominated by noise | Noise dominated (total time) | Noise dominated (detector-on time) | Marked lightcurve |
|---|---|---|---|---|---|---|---|
| A | 7863 | 7863 | 1299 | 1299 | 16.52% | 16.52% | 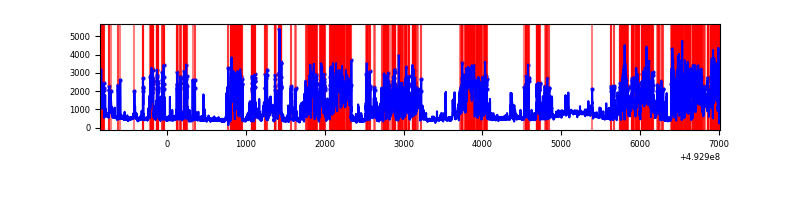 |
| B | 7864 | 7864 | 203 | 203 | 2.58% | 2.58% | 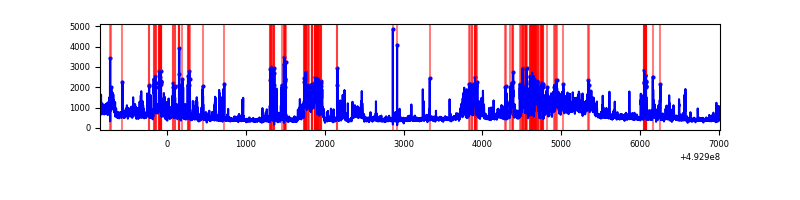 |
| C | 7864 | 7864 | 1240 | 1240 | 15.77% | 15.77% | 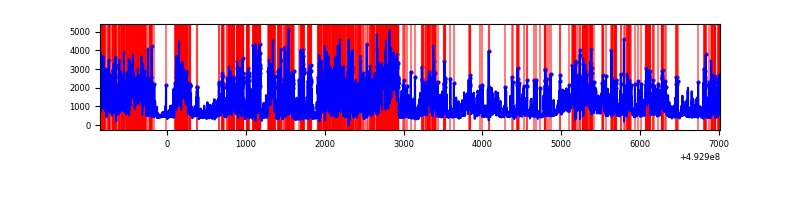 |
| D | 7864 | 7864 | 220 | 220 | 2.80% | 2.80% | 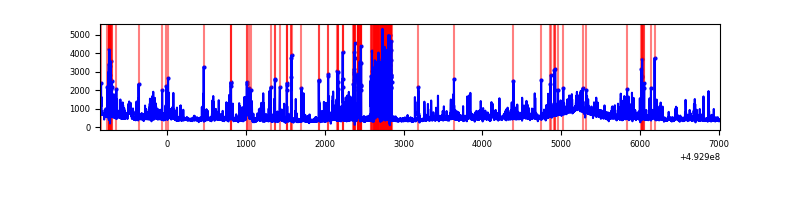 |
Top three noisy pixels from each quadrant. If the there are fewer than three noisy pixels in the level2.evt file, extra rows are filled as -1
| Pixel properties | Quadrant properties | ||||||
|---|---|---|---|---|---|---|---|
| Quadrant | DetID | PixID | Counts | Sigma | Mean | Median | Sigma |
| A | 3 | 63 | 3213853 | 15820.16 | 819 | 798 | 203.1 |
| A | 15 | 174 | 1681976 | 8277.64 | 819 | 798 | 203.1 |
| A | 3 | 78 | 196162 | 961.92 | 819 | 798 | 203.1 |
| B | 4 | 171 | 1127347 | 6125.81 | 860 | 827 | 183.9 |
| B | 10 | 254 | 374853 | 2033.88 | 860 | 827 | 183.9 |
| B | 8 | 234 | 207586 | 1124.32 | 860 | 827 | 183.9 |
| C | 15 | 224 | 2792818 | 12811.57 | 797 | 791 | 217.9 |
| C | 15 | 178 | 1696950 | 7783.04 | 797 | 791 | 217.9 |
| C | 4 | 5 | 715446 | 3279.28 | 797 | 791 | 217.9 |
| D | 2 | 249 | 632630 | 2676.5 | 842 | 806 | 236.1 |
| D | 2 | 172 | 278644 | 1176.96 | 842 | 806 | 236.1 |
| D | 13 | 153 | 179803 | 758.26 | 842 | 806 | 236.1 |
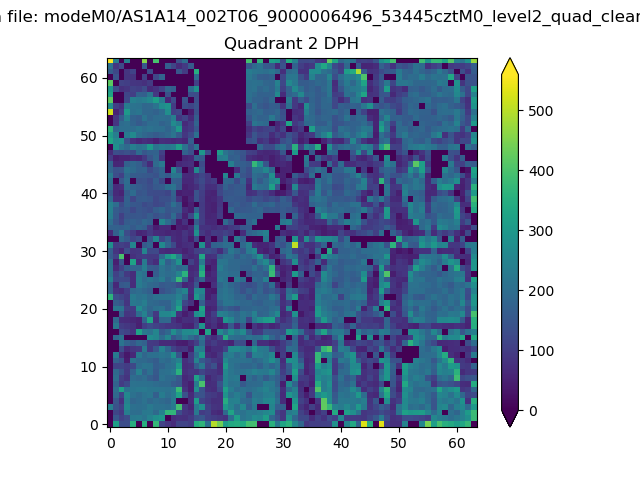
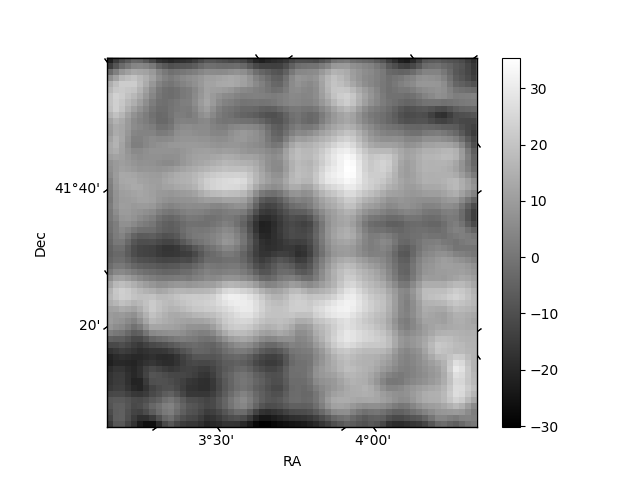
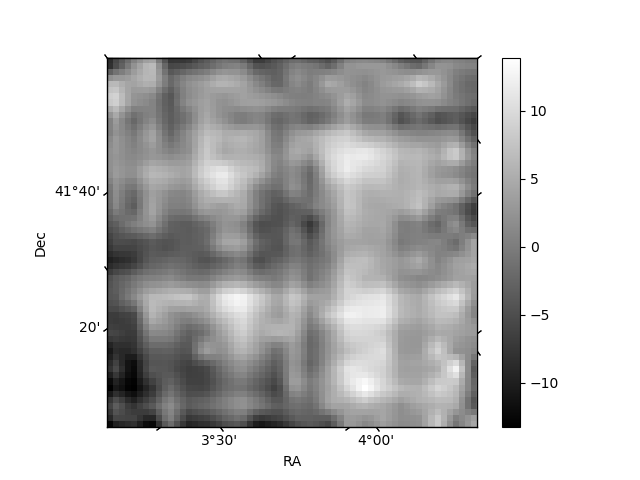
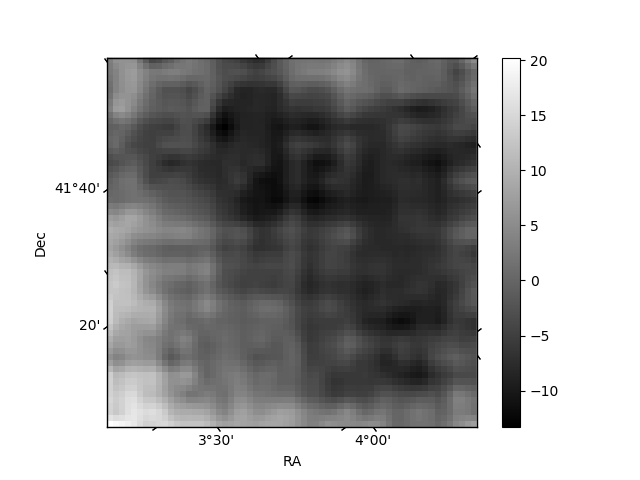
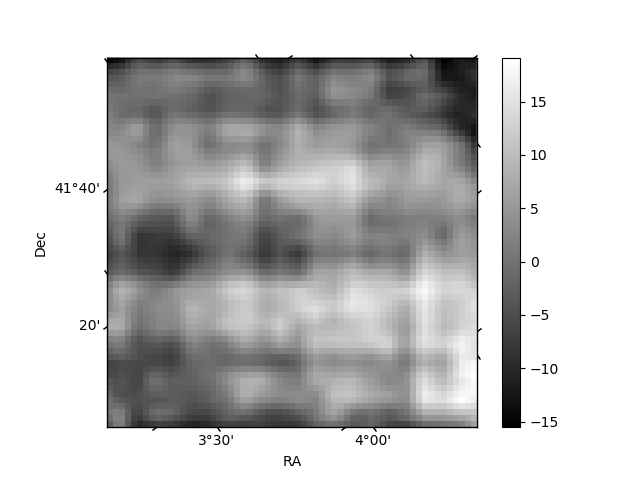
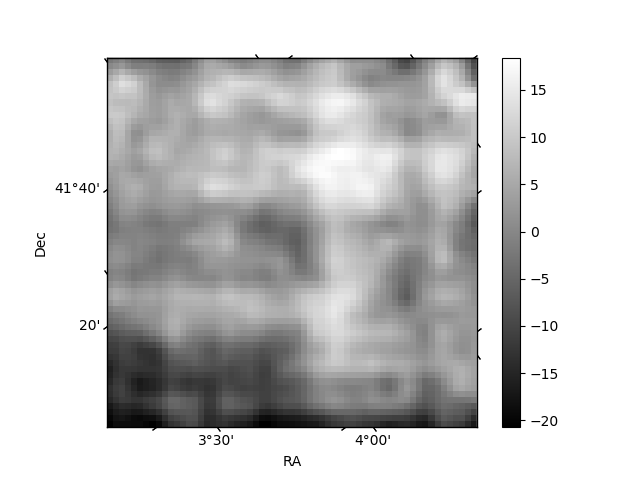
Histogram calculated using DETX and DETY for each event in the final _common_clean file
| Quadrant A | 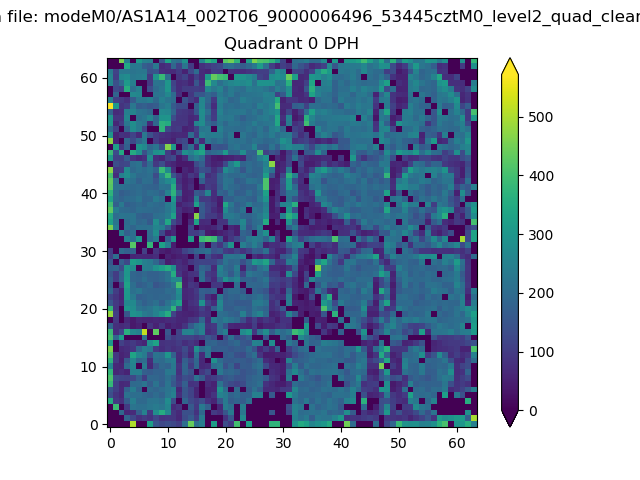 |
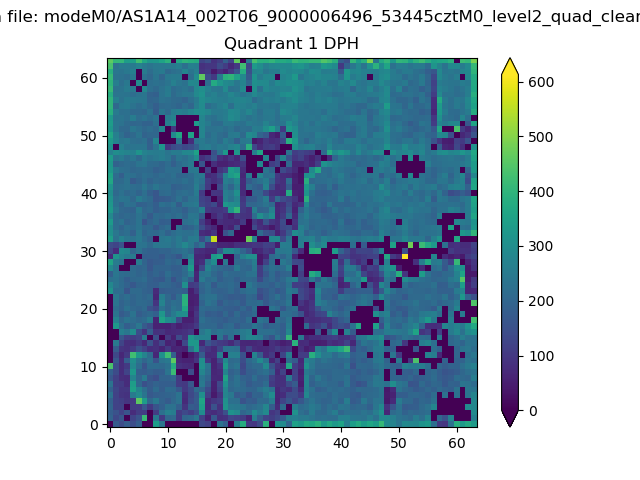 |
Quadrant B |
|---|---|---|---|
| Quadrant D | 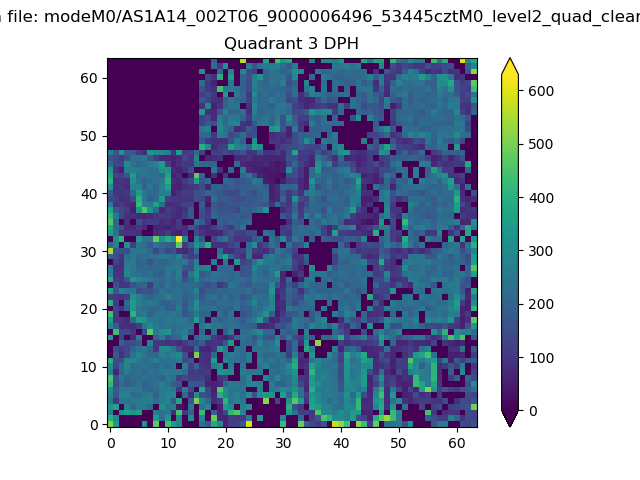 |
 |
Quadrant C |
| Plot type | Count rate plots | Images |
|---|---|---|
| Comparison with Poisson distribution Blue bars denote a histogram of data divided into 1 sec bins. Red curve is a Poisson curve with rate = median count rate of data. |
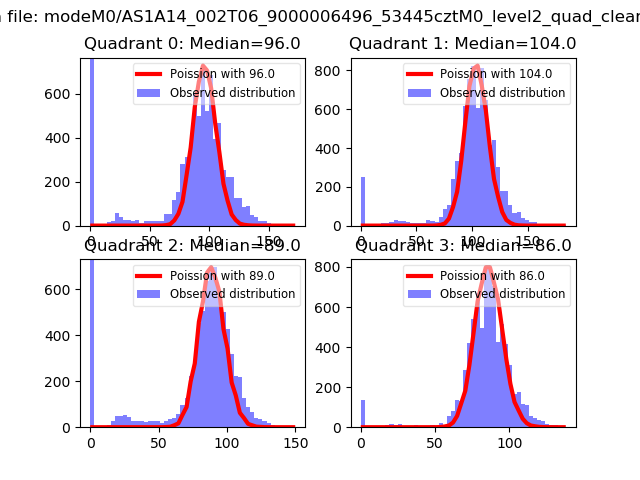 |
 |
| Quadrant-wise count rates Data is divided into 100 sec bins |
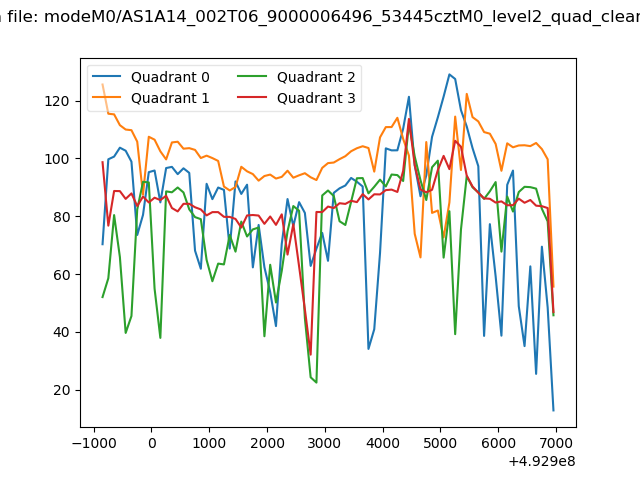 |
|
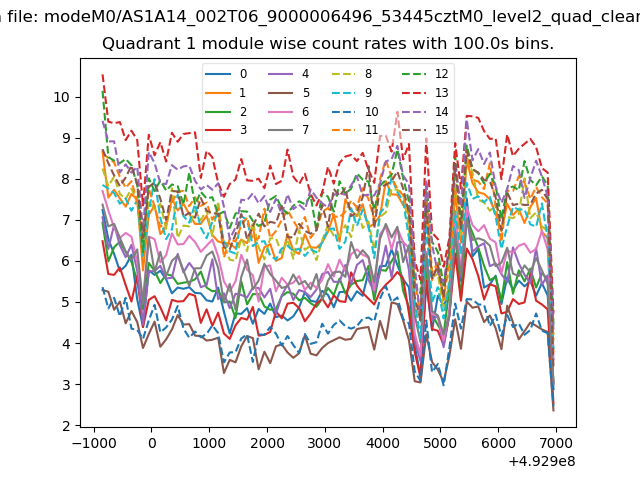
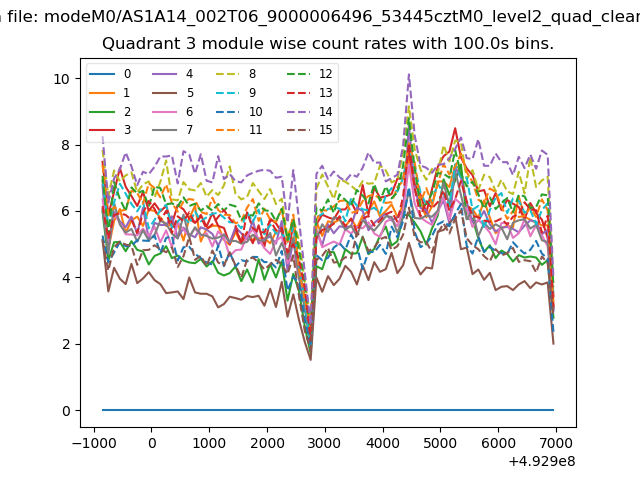
| Module-wise count rates for Quadrant A Data is divided into 100 sec bins |
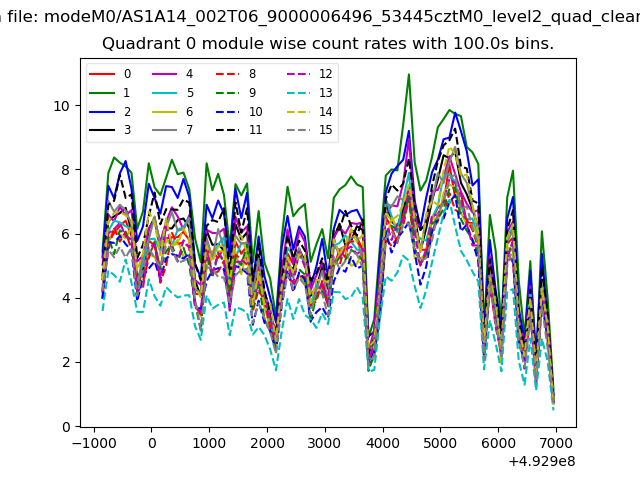 |
 |
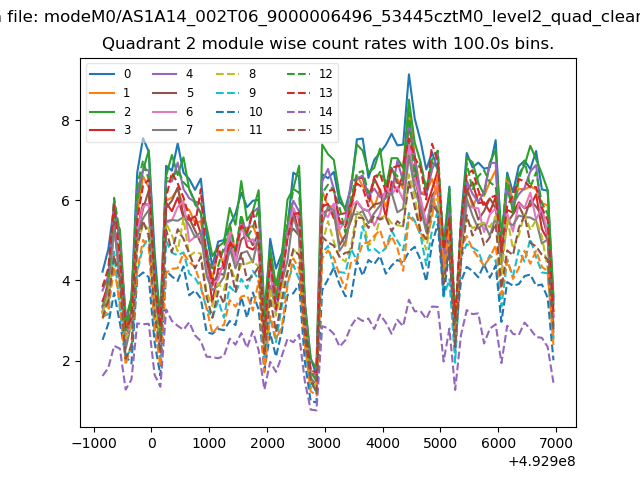
| Module-wise count rates for Quadrant B Data is divided into 100 sec bins |
 |
 |
| Module-wise count rates for Quadrant C Data is divided into 100 sec bins |
 |
 |
| Module-wise count rates for Quadrant D Data is divided into 100 sec bins |
 |
 |
| Parameter | Plot |
|---|---|
| CZT HV Monitor | 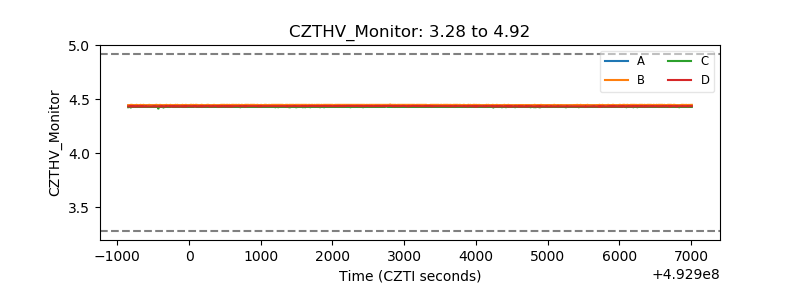 |
| D_VDD | 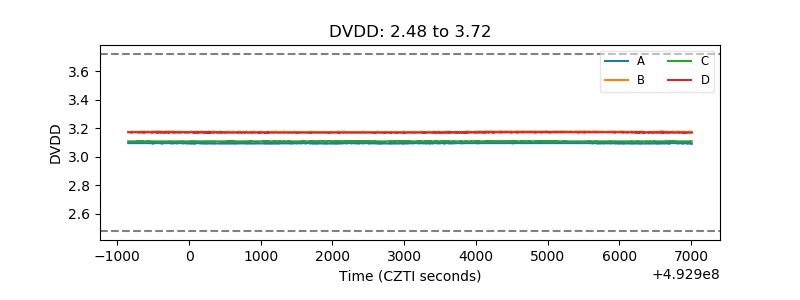 |
| Temperature 1 | 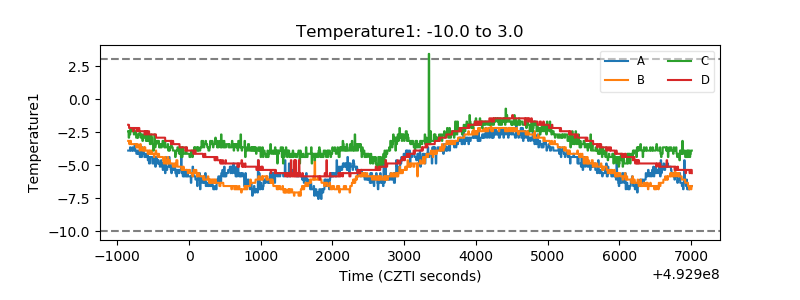 |
| Veto HV Monitor | 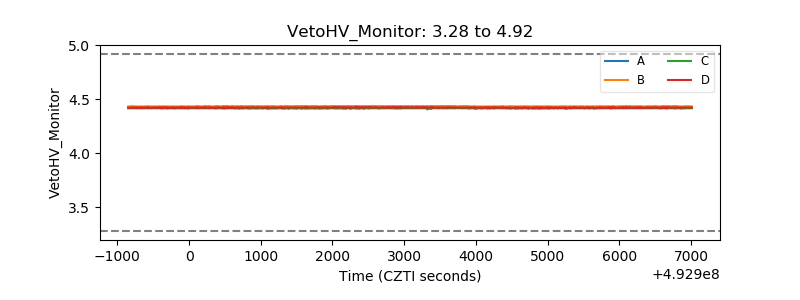 |
| Veto LLD | 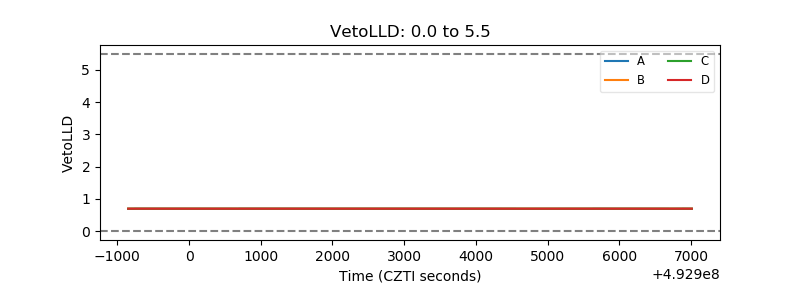 |
| Alpha Counter | 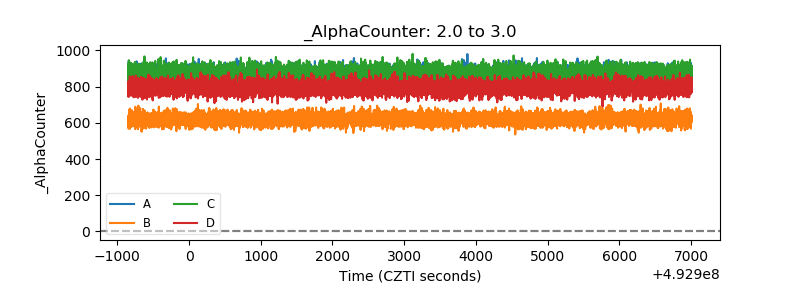 |
| _CPM_Rate | 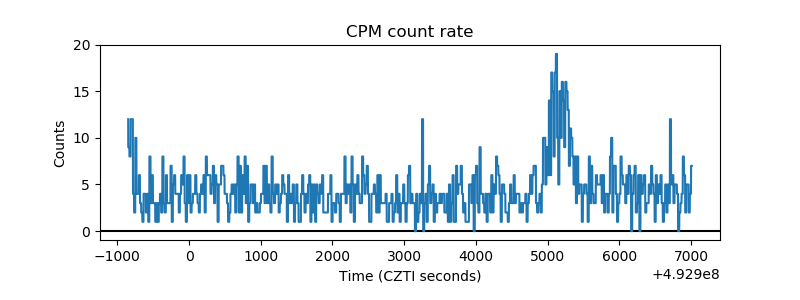 |
| CZT Counter | 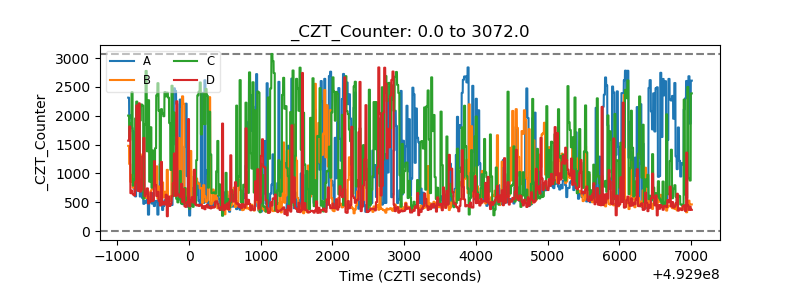 |
| +2.5 Volts monitor |  |
| +5 Volts monitor |  |
| _ROLL_ROT | 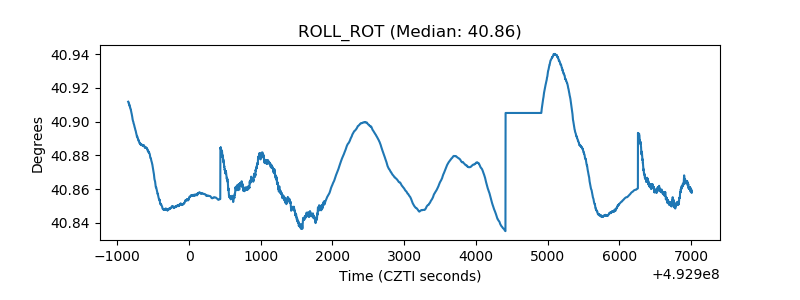 |
| _Roll_DEC | 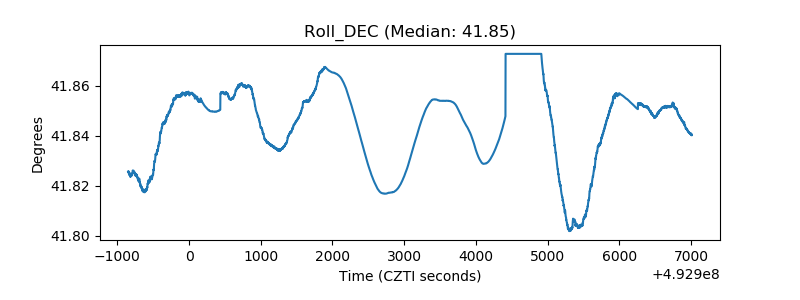 |
| _Roll_RA | 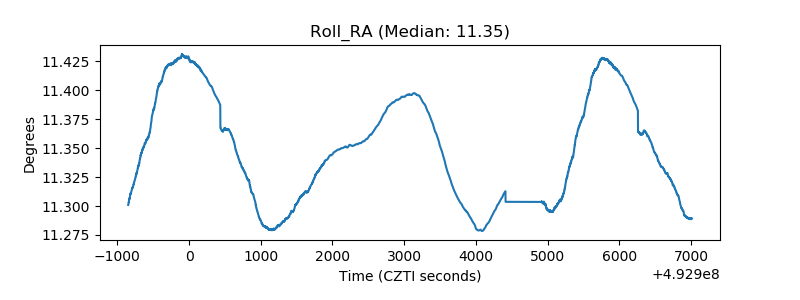 |
| Veto Counter | 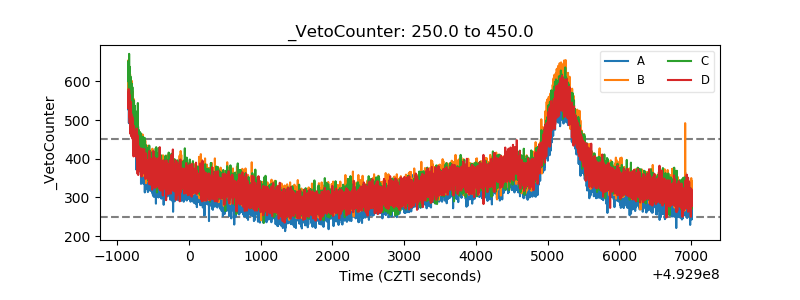 |