| Param | Original file | Final file |
|---|---|---|
| Filename | modeM0/AS1A14_002T06_9000006496_53446cztM0_level2.fits | modeM0/AS1A14_002T06_9000006496_53446cztM0_level2_quad_clean.evt |
| Size (bytes) | 916,099,200 | 111,101,760 |
| Size | 873.7 MB | 106.0 MB |
| Events in quadrant A | 10,371,377 | 647,410 |
| Events in quadrant B | 6,747,026 | 791,076 |
| Events in quadrant C | 10,847,126 | 631,461 |
| Events in quadrant D | 5,294,744 | 709,373 |
| Mode SS | |||
|---|---|---|---|
| Quadrant | BADHDUFLAG | Total packets | Discarded packets |
| A | 0 | 168 | 0 |
| B | 0 | 168 | 0 |
| C | 0 | 168 | 0 |
| D | 0 | 168 | 0 |
| Mode M0 | |||
|---|---|---|---|
| Quadrant | BADHDUFLAG | Total packets | Discarded packets |
| A | 0 | 36602 | 5 |
| B | 0 | 26179 | 0 |
| C | 0 | 38085 | 0 |
| D | 0 | 21950 | 0 |
| Quadrant | Total seconds | Saturated seconds | Saturation percentage |
|---|---|---|---|
| A | 8411 | 2184 | 25.965997% |
| B | 8412 | 1200 | 14.265335% |
| C | 8412 | 1980 | 23.537803% |
| D | 8412 | 348 | 4.136947% |
Noise dominated data is calculated using 1-second bins in cleaned event files. If a bin has >2000 counts, and if more than 50% of those come from <1% of pixels, then it is considered to be noise-dominated and hence unusable.
| Quadrant | # 1 sec bins | Bins with >0 counts | Bins with >2000 counts | High rate bins dominated by noise | Noise dominated (total time) | Noise dominated (detector-on time) | Marked lightcurve |
|---|---|---|---|---|---|---|---|
| A | 8411 | 8411 | 1842 | 1842 | 21.90% | 21.90% | 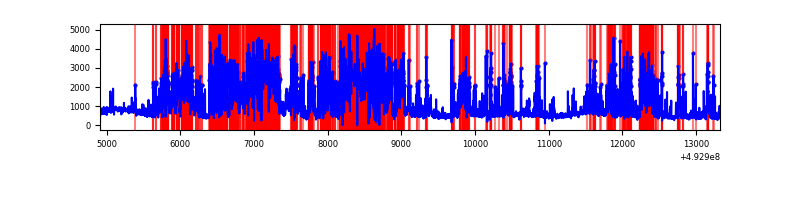 |
| B | 8412 | 8412 | 478 | 478 | 5.68% | 5.68% | 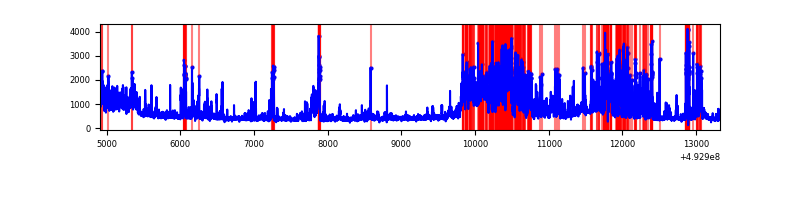 |
| C | 8412 | 8412 | 1500 | 1500 | 17.83% | 17.83% | 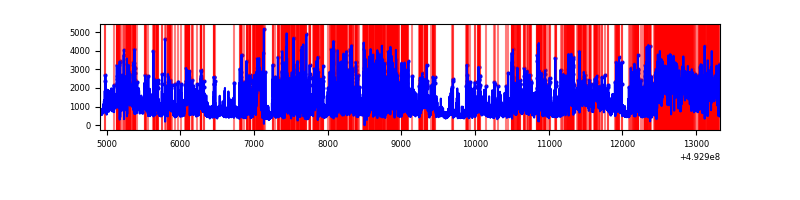 |
| D | 8412 | 8412 | 236 | 236 | 2.81% | 2.81% | 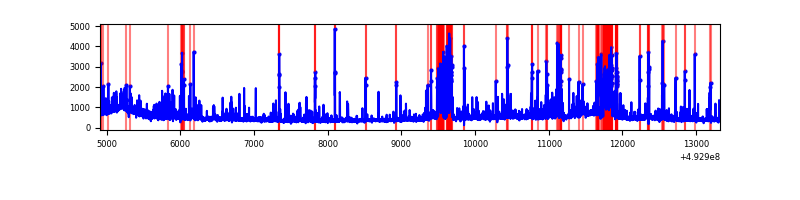 |
Top three noisy pixels from each quadrant. If the there are fewer than three noisy pixels in the level2.evt file, extra rows are filled as -1
| Pixel properties | Quadrant properties | ||||||
|---|---|---|---|---|---|---|---|
| Quadrant | DetID | PixID | Counts | Sigma | Mean | Median | Sigma |
| A | 3 | 63 | 3485065 | 16608.53 | 846 | 825 | 209.8 |
| A | 15 | 174 | 3386795 | 16140.1 | 846 | 825 | 209.8 |
| A | 3 | 78 | 61638 | 289.88 | 846 | 825 | 209.8 |
| B | 4 | 171 | 1869327 | 9632.64 | 902 | 868 | 194.0 |
| B | 8 | 234 | 538947 | 2774.01 | 902 | 868 | 194.0 |
| B | 5 | 185 | 337992 | 1738.01 | 902 | 868 | 194.0 |
| C | 15 | 224 | 3596785 | 15469.49 | 855 | 846 | 232.5 |
| C | 15 | 158 | 1236802 | 5317.0 | 855 | 846 | 232.5 |
| C | 15 | 178 | 833928 | 3583.86 | 855 | 846 | 232.5 |
| D | 3 | 224 | 428436 | 1681.05 | 905 | 864 | 254.3 |
| D | 2 | 172 | 291028 | 1140.82 | 905 | 864 | 254.3 |
| D | 3 | 12 | 261581 | 1025.04 | 905 | 864 | 254.3 |
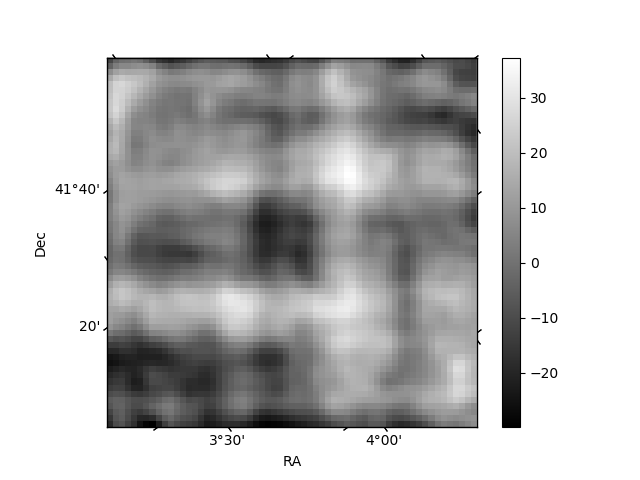
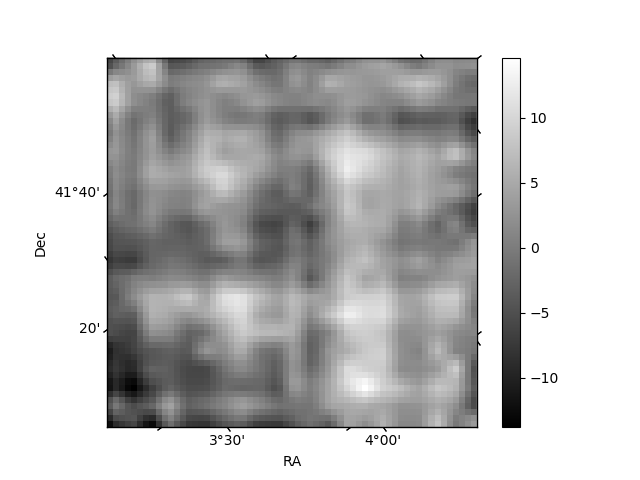
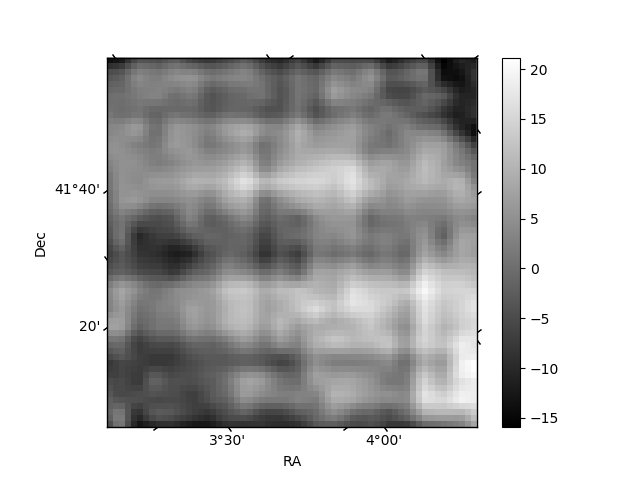
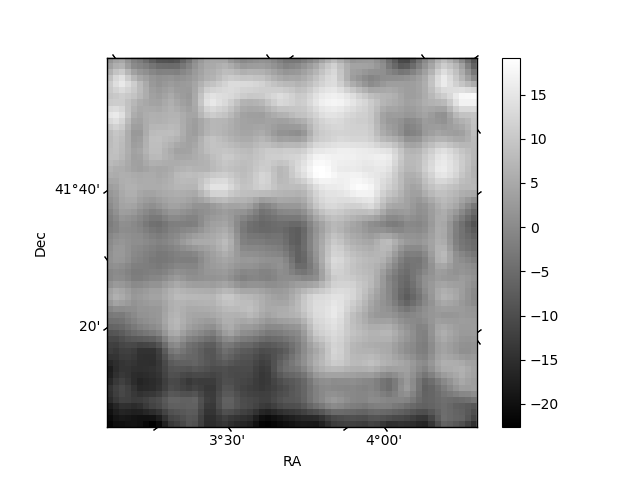
Histogram calculated using DETX and DETY for each event in the final _common_clean file
| Quadrant A | 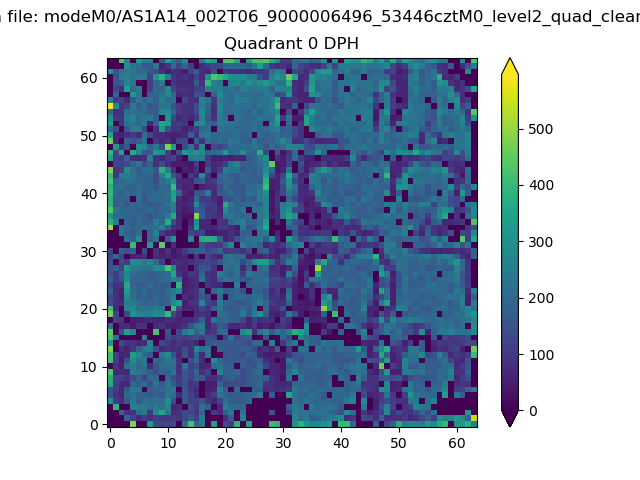 |
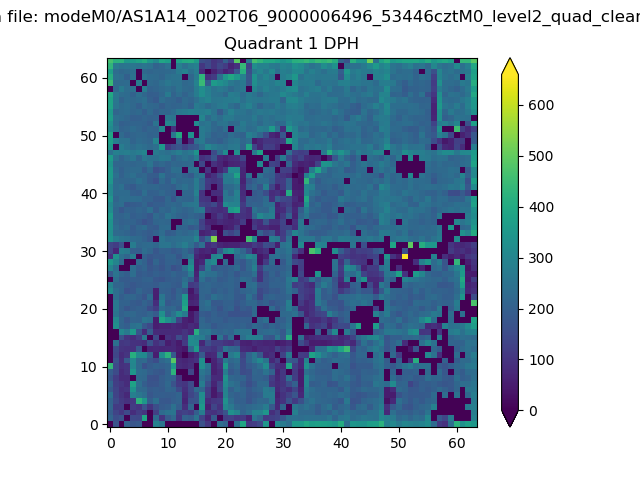 |
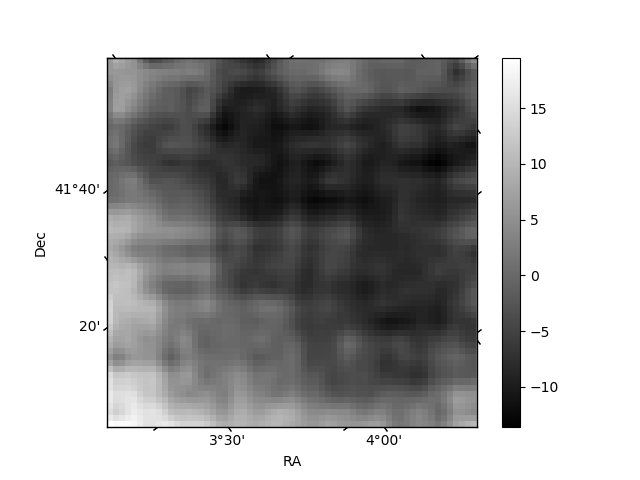
Quadrant B |
|---|---|---|---|
| Quadrant D | 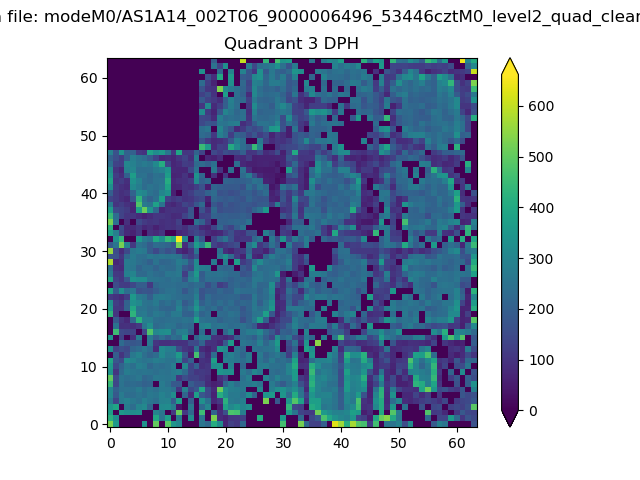 |
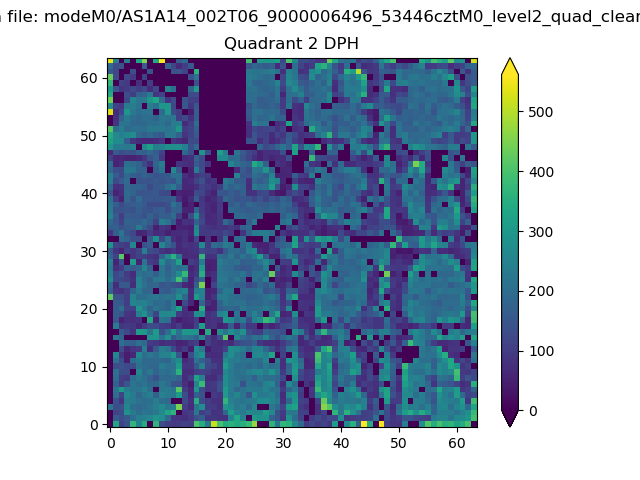 |
Quadrant C |
| Plot type | Count rate plots | Images |
|---|---|---|
| Comparison with Poisson distribution Blue bars denote a histogram of data divided into 1 sec bins. Red curve is a Poisson curve with rate = median count rate of data. |
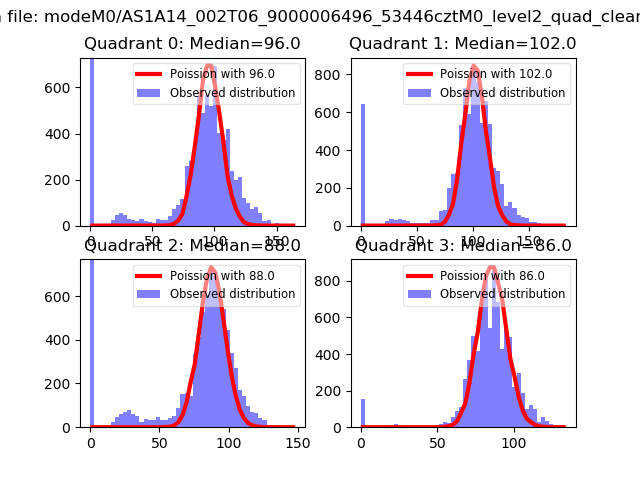 |
 |
| Quadrant-wise count rates Data is divided into 100 sec bins |
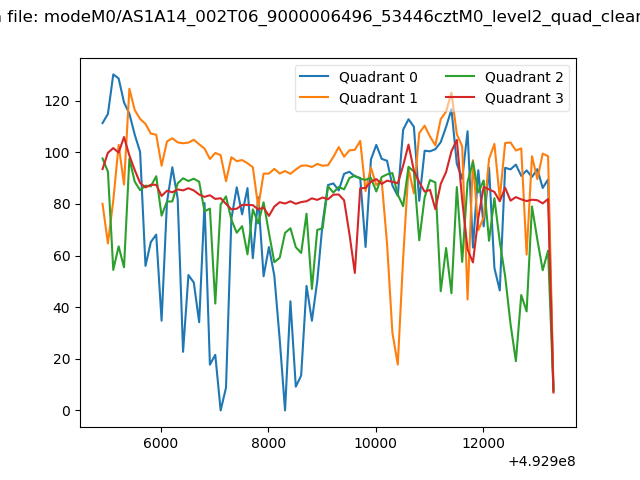 |
|
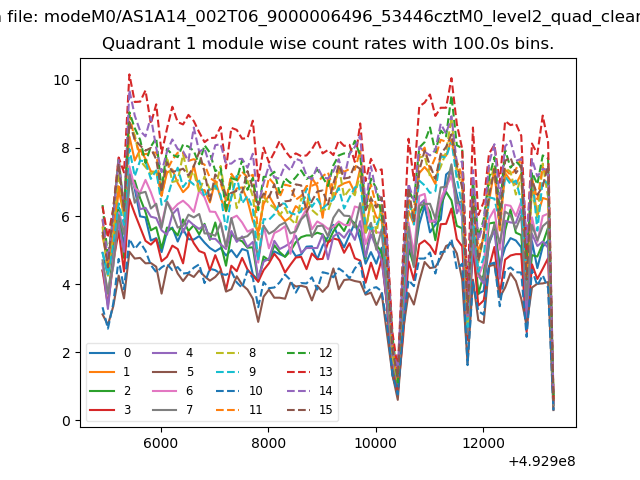
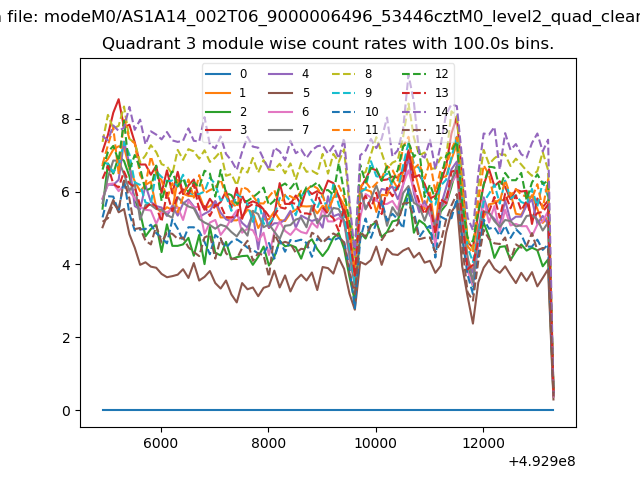
| Module-wise count rates for Quadrant A Data is divided into 100 sec bins |
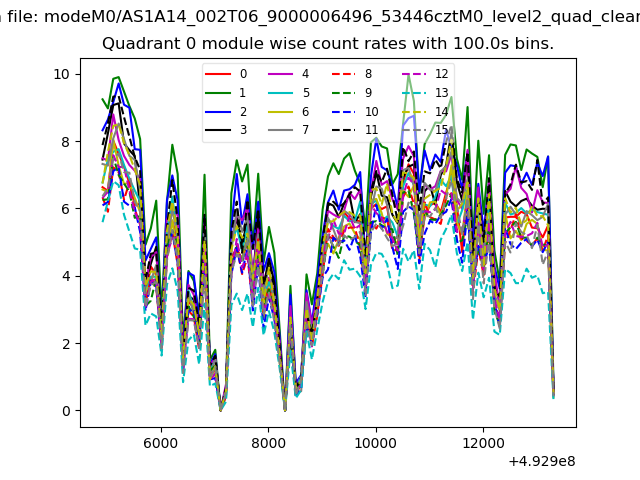 |
 |
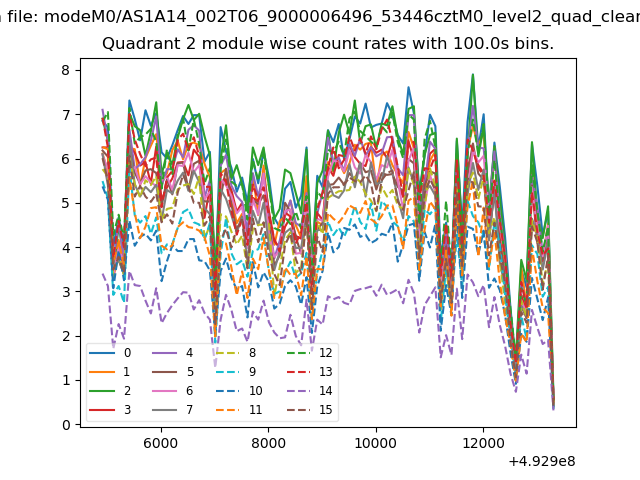
| Module-wise count rates for Quadrant B Data is divided into 100 sec bins |
 |
 |
| Module-wise count rates for Quadrant C Data is divided into 100 sec bins |
 |
 |
| Module-wise count rates for Quadrant D Data is divided into 100 sec bins |
 |
 |
| Parameter | Plot |
|---|---|
| CZT HV Monitor | 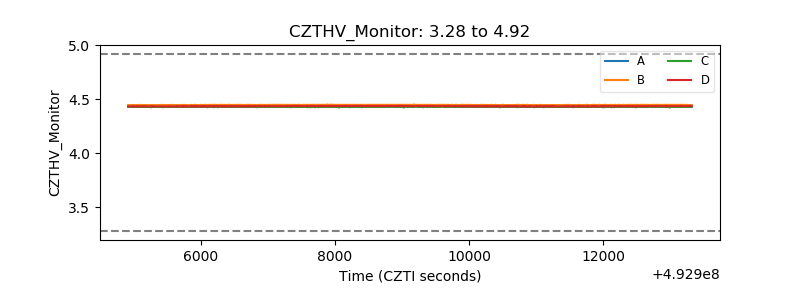 |
| D_VDD | 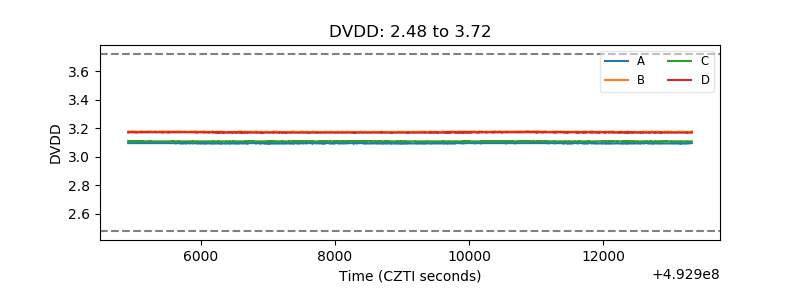 |
| Temperature 1 | 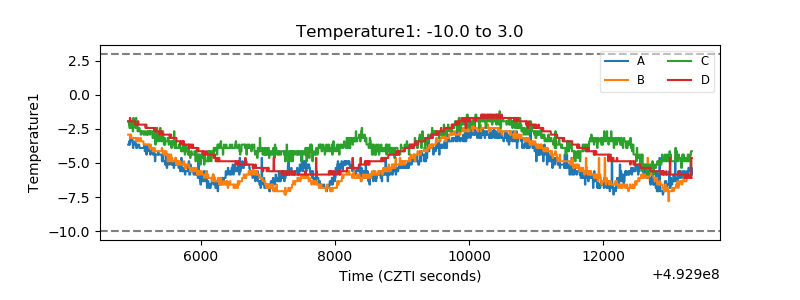 |
| Veto HV Monitor | 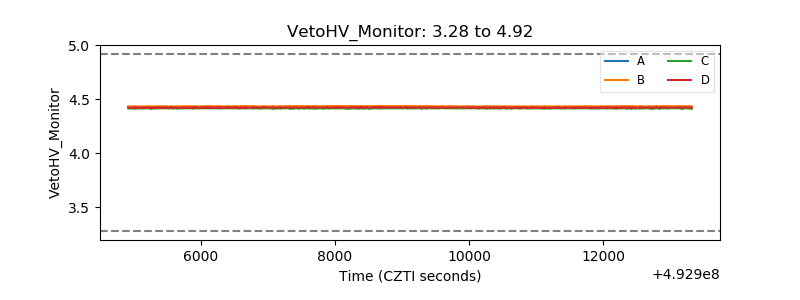 |
| Veto LLD | 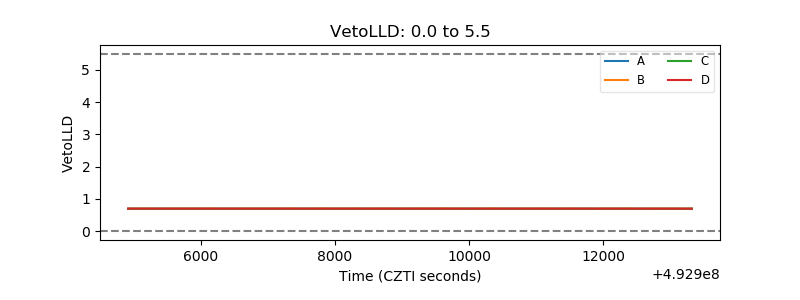 |
| Alpha Counter | 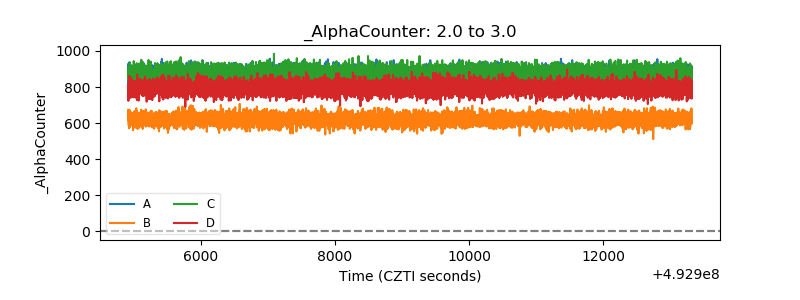 |
| _CPM_Rate | 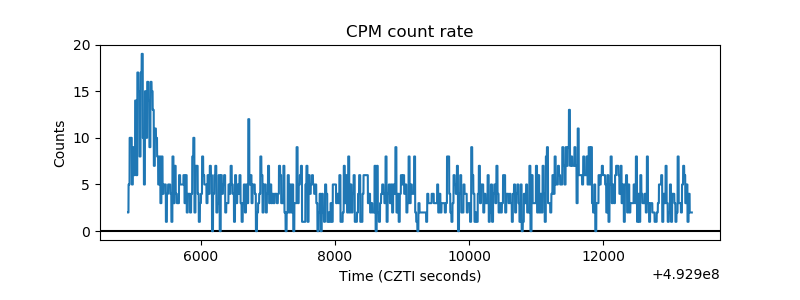 |
| CZT Counter | 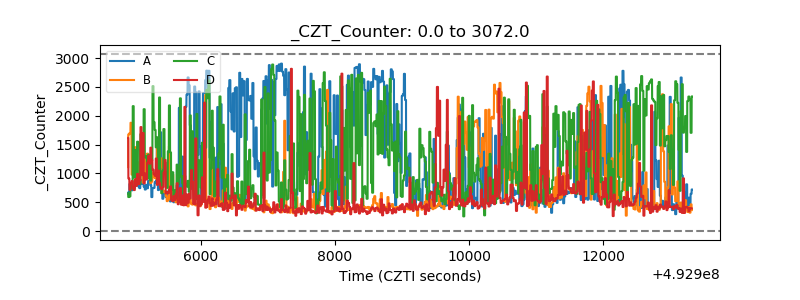 |
| +2.5 Volts monitor |  |
| +5 Volts monitor | 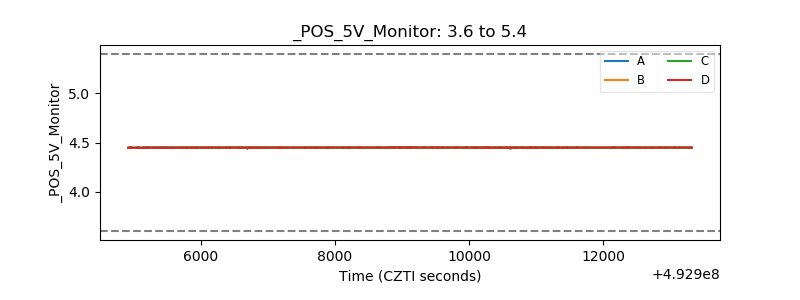 |
| _ROLL_ROT | 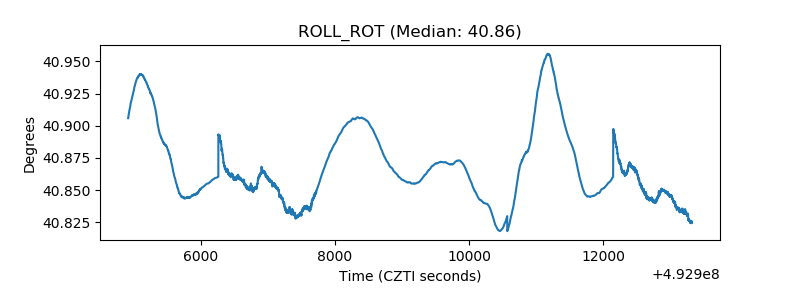 |
| _Roll_DEC | 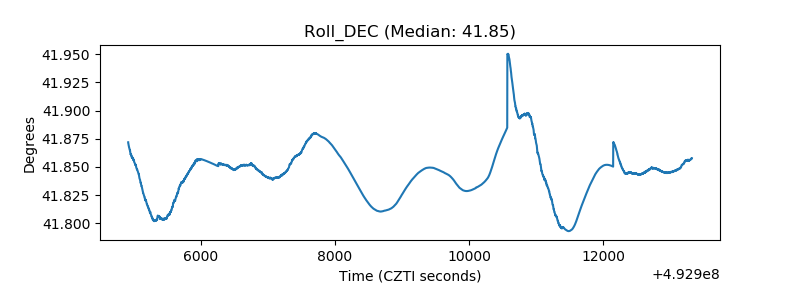 |
| _Roll_RA | 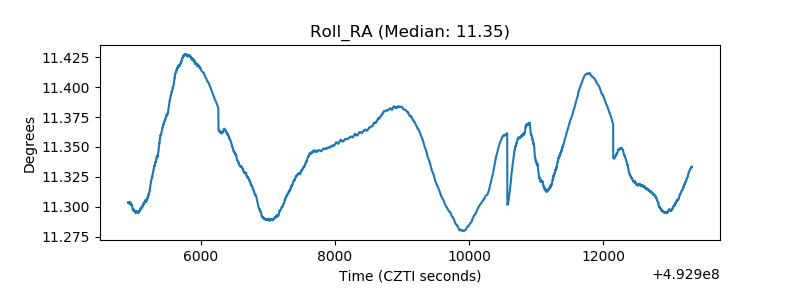 |
| Veto Counter | 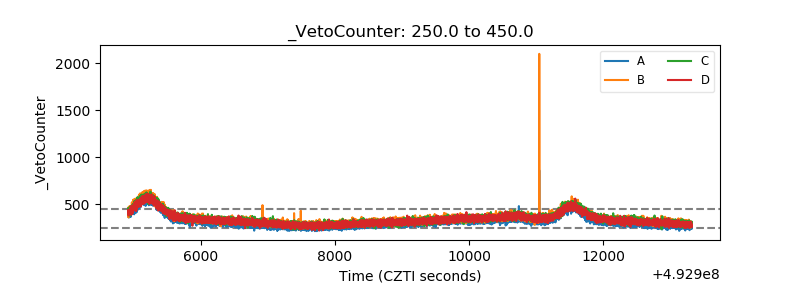 |