| Param | Original file | Final file |
|---|---|---|
| Filename | modeM0/AS1A14_002T06_9000006496_53447cztM0_level2.fits | modeM0/AS1A14_002T06_9000006496_53447cztM0_level2_quad_clean.evt |
| Size (bytes) | 869,745,600 | 102,715,200 |
| Size | 829.5 MB | 98.0 MB |
| Events in quadrant A | 7,754,714 | 649,434 |
| Events in quadrant B | 5,888,582 | 778,493 |
| Events in quadrant C | 12,037,915 | 493,735 |
| Events in quadrant D | 5,902,691 | 638,659 |
| Mode SS | |||
|---|---|---|---|
| Quadrant | BADHDUFLAG | Total packets | Discarded packets |
| A | 0 | 158 | 0 |
| B | 0 | 158 | 0 |
| C | 0 | 158 | 0 |
| D | 0 | 158 | 0 |
| Mode M0 | |||
|---|---|---|---|
| Quadrant | BADHDUFLAG | Total packets | Discarded packets |
| A | 0 | 28536 | 0 |
| B | 0 | 23056 | 0 |
| C | 0 | 41258 | 0 |
| D | 0 | 23185 | 0 |
| Quadrant | Total seconds | Saturated seconds | Saturation percentage |
|---|---|---|---|
| A | 7903 | 1339 | 16.942933% |
| B | 7903 | 601 | 7.604707% |
| C | 7903 | 2844 | 35.986334% |
| D | 7903 | 471 | 5.959762% |
Noise dominated data is calculated using 1-second bins in cleaned event files. If a bin has >2000 counts, and if more than 50% of those come from <1% of pixels, then it is considered to be noise-dominated and hence unusable.
| Quadrant | # 1 sec bins | Bins with >0 counts | Bins with >2000 counts | High rate bins dominated by noise | Noise dominated (total time) | Noise dominated (detector-on time) | Marked lightcurve |
|---|---|---|---|---|---|---|---|
| A | 7903 | 7903 | 1144 | 1144 | 14.48% | 14.48% | 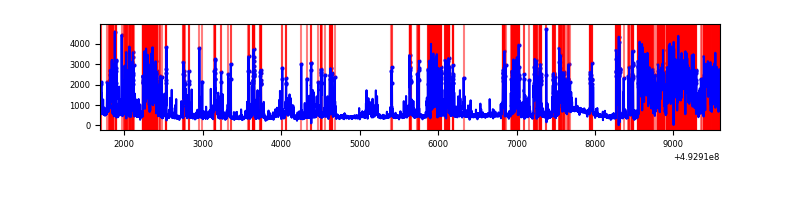 |
| B | 7903 | 7903 | 292 | 292 | 3.69% | 3.69% | 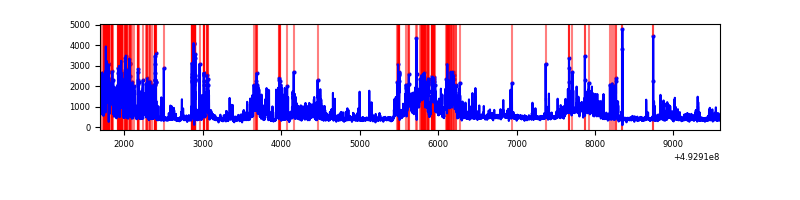 |
| C | 7903 | 7903 | 2210 | 2210 | 27.96% | 27.96% | 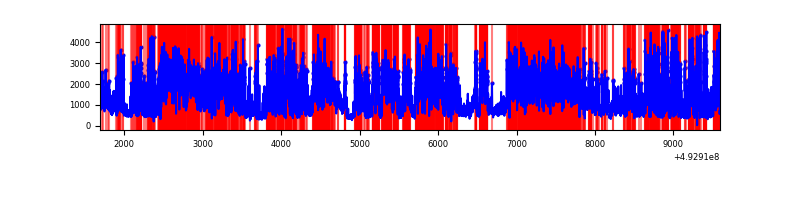 |
| D | 7903 | 7903 | 348 | 348 | 4.40% | 4.40% | 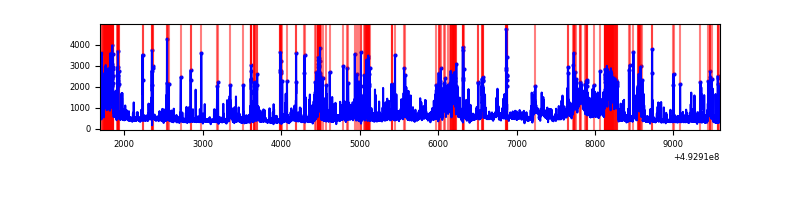 |
Top three noisy pixels from each quadrant. If the there are fewer than three noisy pixels in the level2.evt file, extra rows are filled as -1
| Pixel properties | Quadrant properties | ||||||
|---|---|---|---|---|---|---|---|
| Quadrant | DetID | PixID | Counts | Sigma | Mean | Median | Sigma |
| A | 15 | 174 | 2210237 | 11256.47 | 792 | 775 | 196.3 |
| A | 3 | 63 | 2053902 | 10460.0 | 792 | 775 | 196.3 |
| A | 3 | 78 | 210944 | 1070.74 | 792 | 775 | 196.3 |
| B | 4 | 171 | 1558779 | 8686.92 | 827 | 797 | 179.3 |
| B | 8 | 234 | 577762 | 3217.01 | 827 | 797 | 179.3 |
| B | 0 | 213 | 159690 | 885.95 | 827 | 797 | 179.3 |
| C | 15 | 158 | 3010891 | 15265.13 | 715 | 709 | 197.2 |
| C | 15 | 224 | 2005789 | 10168.09 | 715 | 709 | 197.2 |
| C | 15 | 178 | 1505791 | 7632.52 | 715 | 709 | 197.2 |
| D | 2 | 172 | 1171616 | 5131.43 | 806 | 771 | 228.2 |
| D | 12 | 3 | 439531 | 1922.94 | 806 | 771 | 228.2 |
| D | 3 | 224 | 312193 | 1364.86 | 806 | 771 | 228.2 |
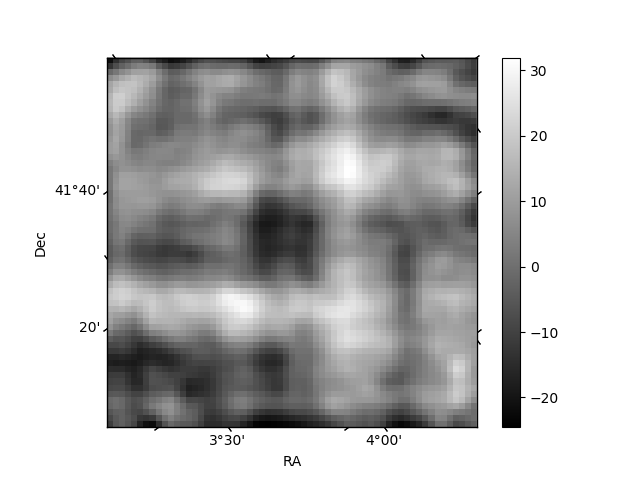
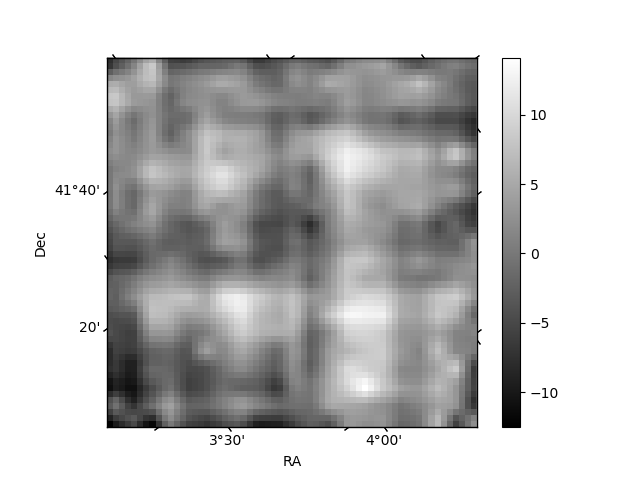
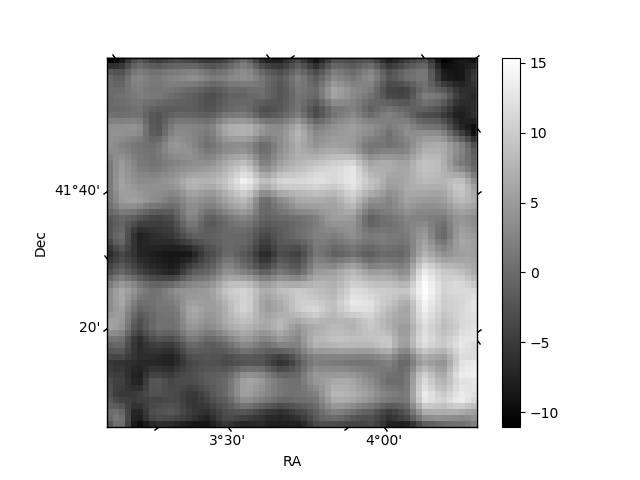
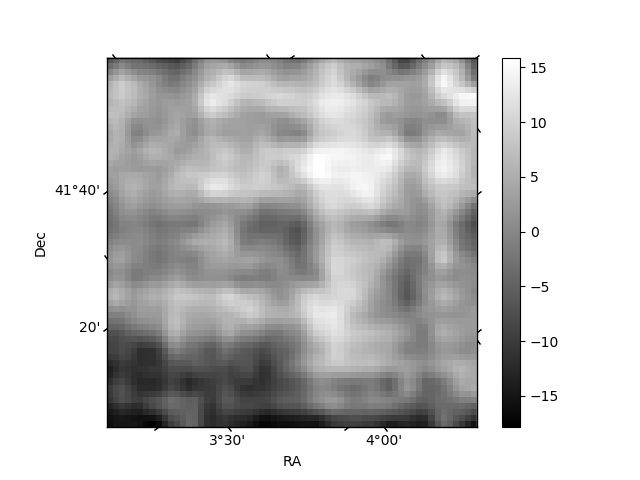
Histogram calculated using DETX and DETY for each event in the final _common_clean file
| Quadrant A | 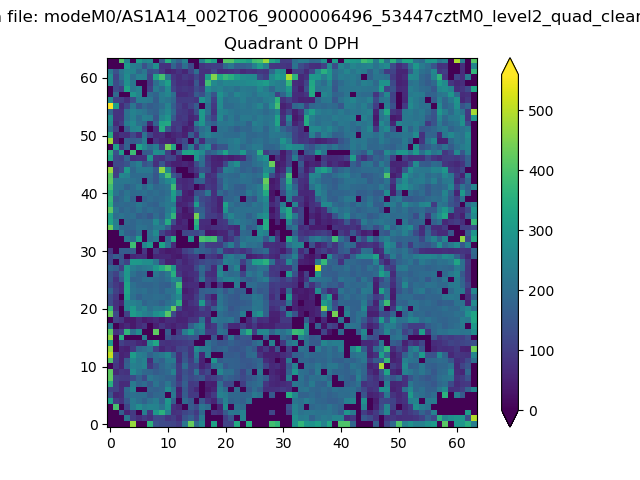 |
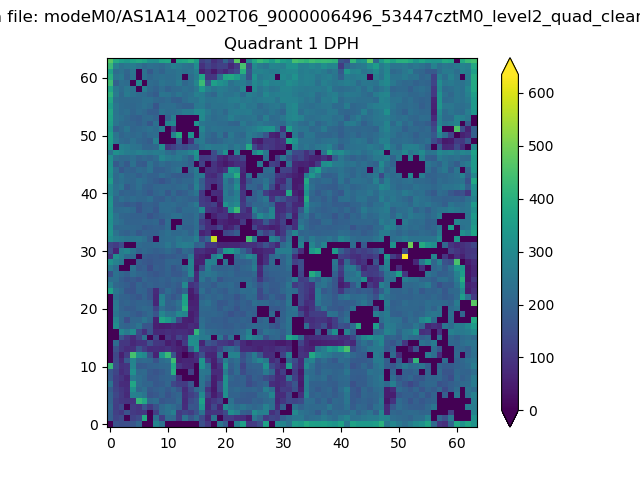 |
Quadrant B |
|---|---|---|---|
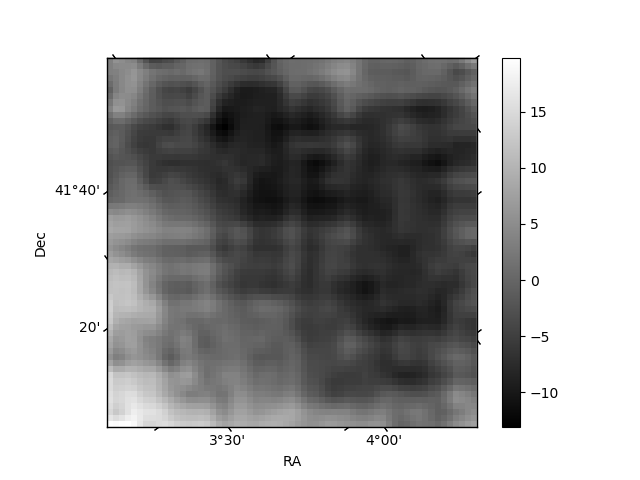
| Quadrant D | 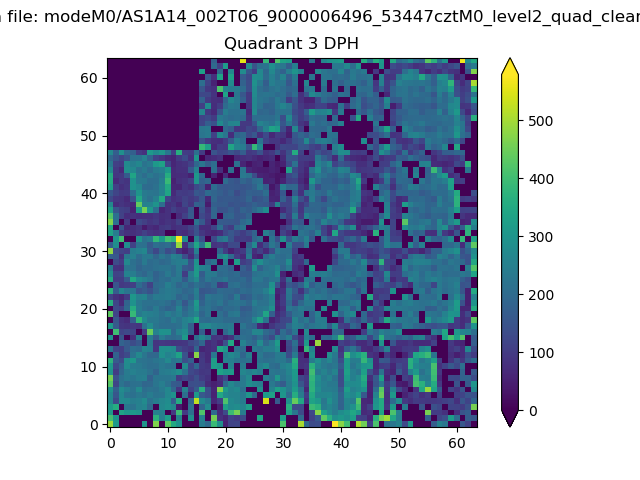 |
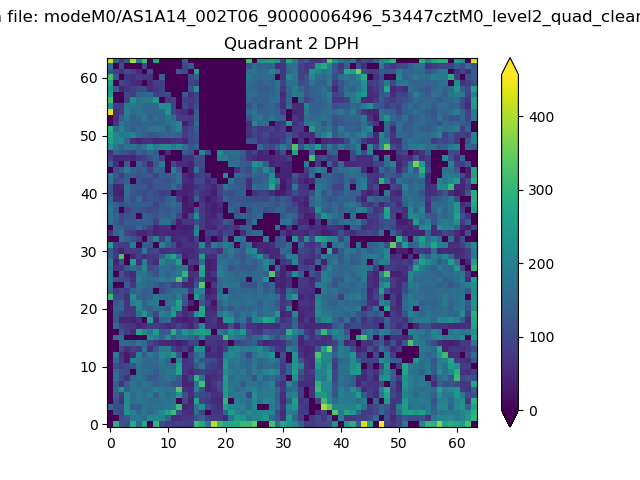 |
Quadrant C |
| Plot type | Count rate plots | Images |
|---|---|---|
| Comparison with Poisson distribution Blue bars denote a histogram of data divided into 1 sec bins. Red curve is a Poisson curve with rate = median count rate of data. |
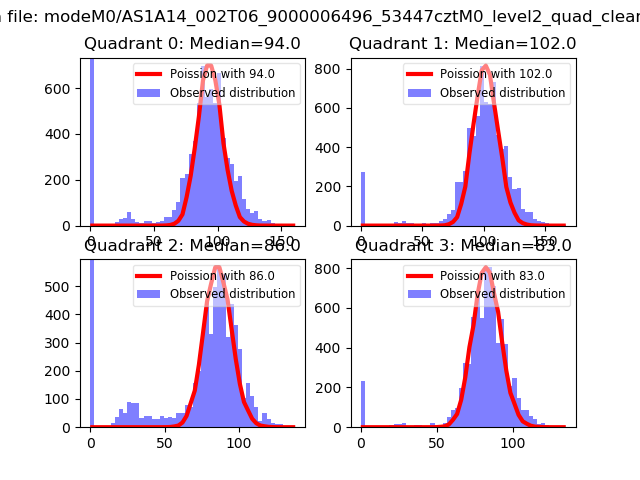 |
 |
| Quadrant-wise count rates Data is divided into 100 sec bins |
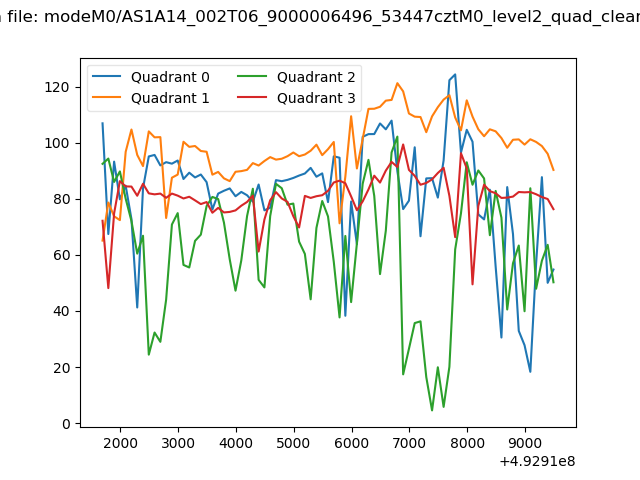 |
|
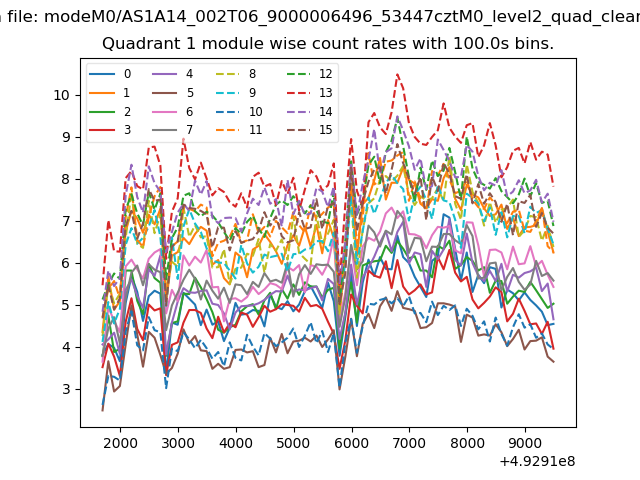
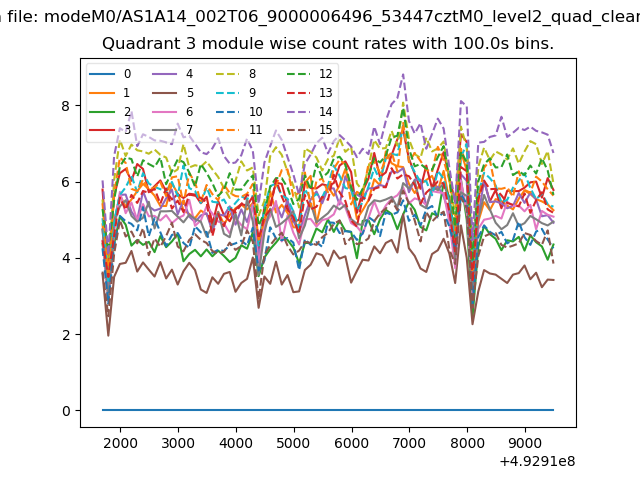
| Module-wise count rates for Quadrant A Data is divided into 100 sec bins |
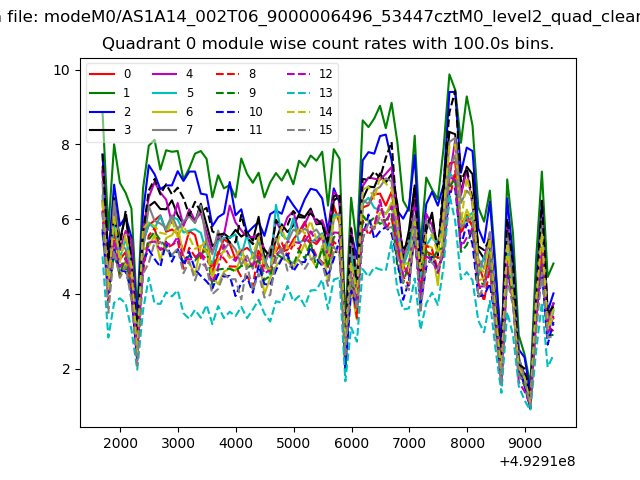 |
 |
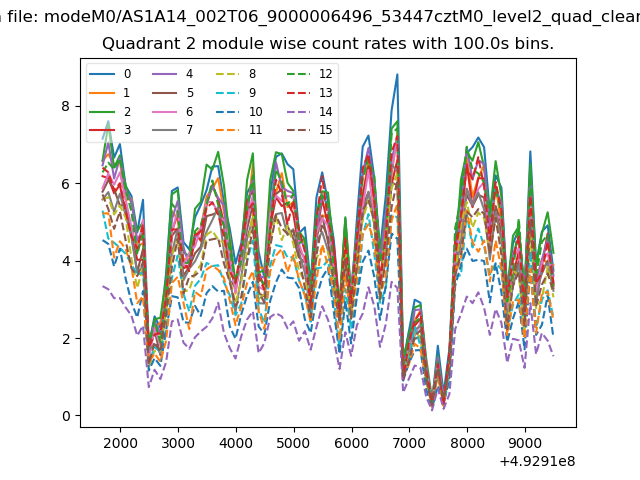
| Module-wise count rates for Quadrant B Data is divided into 100 sec bins |
 |
 |
| Module-wise count rates for Quadrant C Data is divided into 100 sec bins |
 |
 |
| Module-wise count rates for Quadrant D Data is divided into 100 sec bins |
 |
 |
| Parameter | Plot |
|---|---|
| CZT HV Monitor | 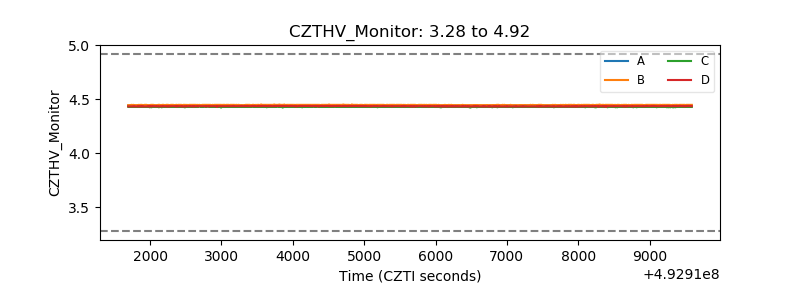 |
| D_VDD | 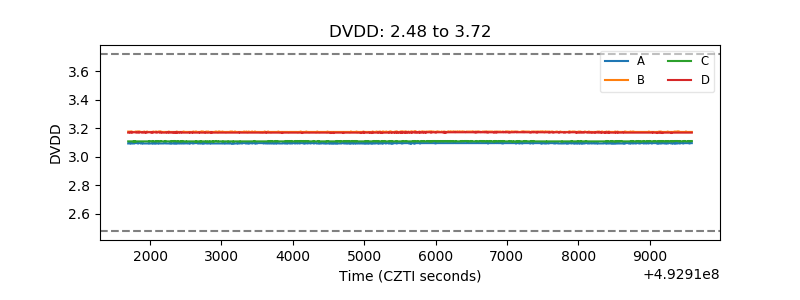 |
| Temperature 1 | 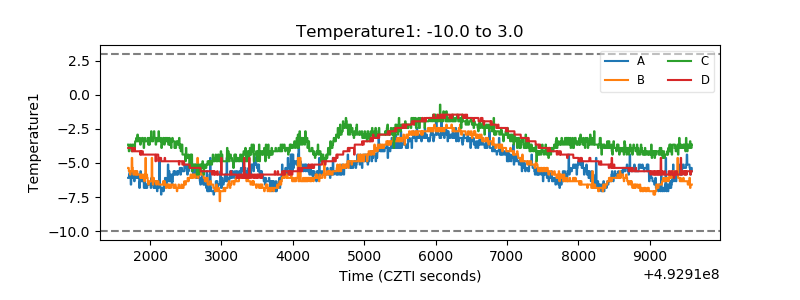 |
| Veto HV Monitor | 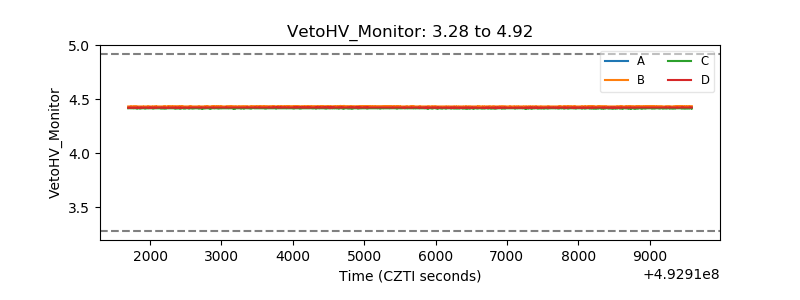 |
| Veto LLD | 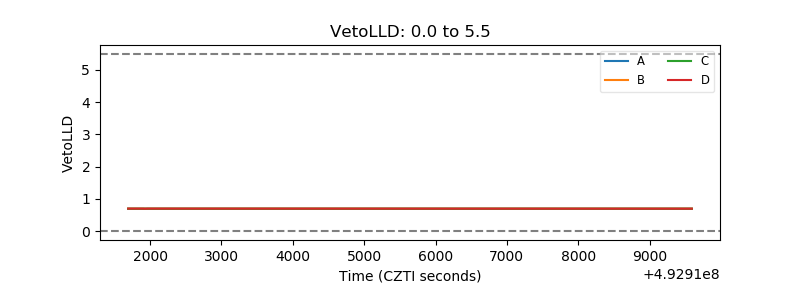 |
| Alpha Counter | 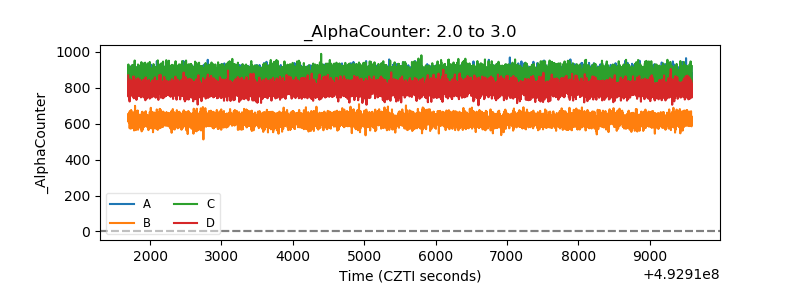 |
| _CPM_Rate | 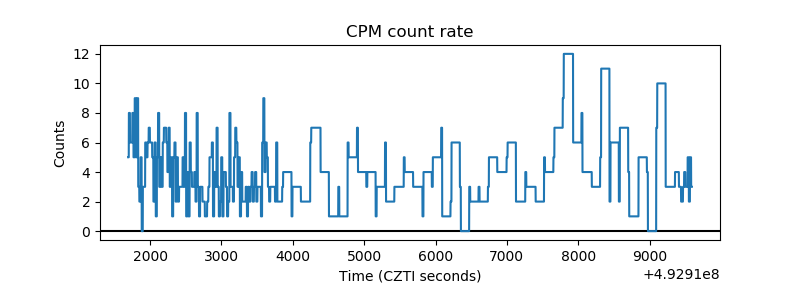 |
| CZT Counter | 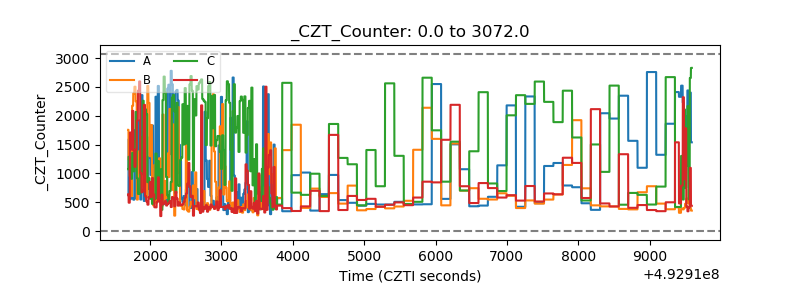 |
| +2.5 Volts monitor |  |
| +5 Volts monitor | 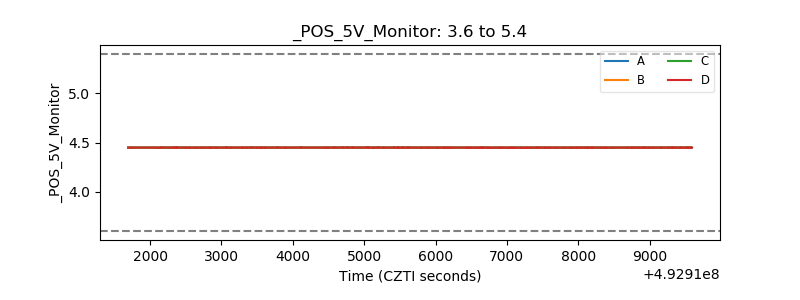 |
| _ROLL_ROT | 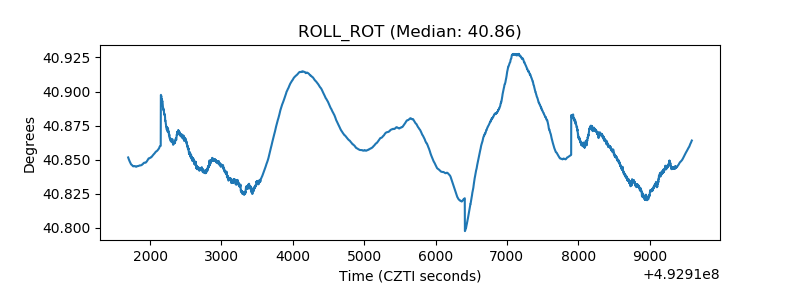 |
| _Roll_DEC | 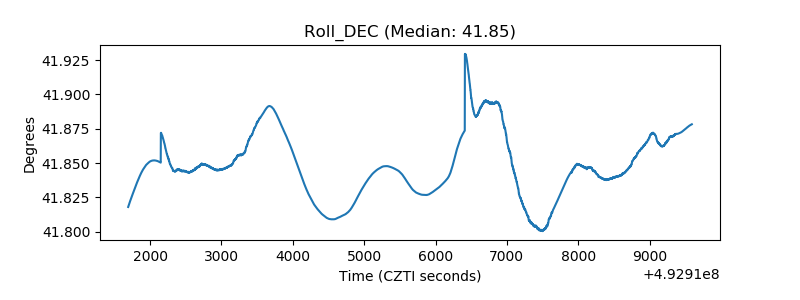 |
| _Roll_RA | 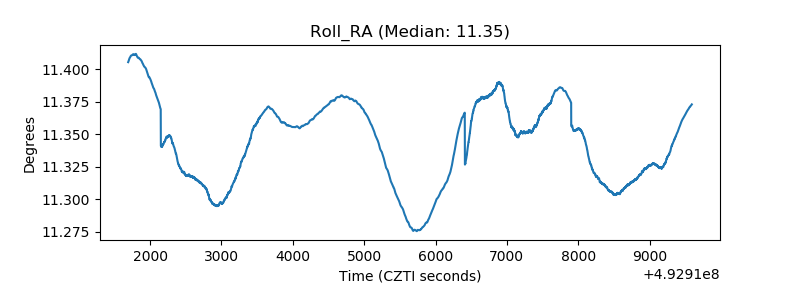 |
| Veto Counter | 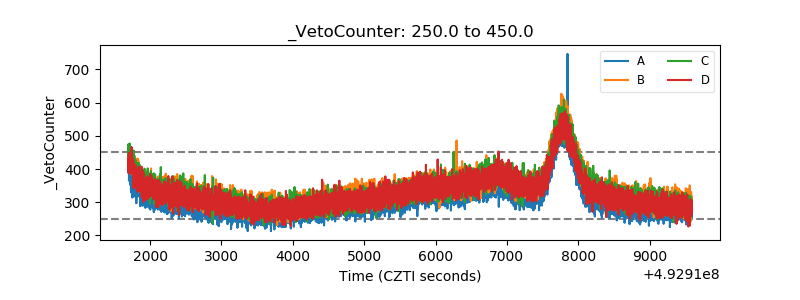 |