| Param | Original file | Final file |
|---|---|---|
| Filename | modeM0/AS1A14_002T06_9000006496_53450cztM0_level2.fits | modeM0/AS1A14_002T06_9000006496_53450cztM0_level2_quad_clean.evt |
| Size (bytes) | 1,973,687,040 | 225,123,840 |
| Size | 1.8 GB | 214.7 MB |
| Events in quadrant A | 17,509,990 | 1,449,117 |
| Events in quadrant B | 11,170,106 | 1,823,093 |
| Events in quadrant C | 31,337,814 | 881,756 |
| Events in quadrant D | 11,633,414 | 1,403,706 |
| Mode M9 | |||
|---|---|---|---|
| Quadrant | BADHDUFLAG | Total packets | Discarded packets |
| A | 0 | 15 | 0 |
| B | 0 | 15 | 0 |
| C | 0 | 15 | 0 |
| D | 0 | 15 | 0 |
| Mode SS | |||
|---|---|---|---|
| Quadrant | BADHDUFLAG | Total packets | Discarded packets |
| A | 0 | 370 | 0 |
| B | 0 | 370 | 0 |
| C | 0 | 370 | 0 |
| D | 0 | 370 | 0 |
| Mode M0 | |||
|---|---|---|---|
| Quadrant | BADHDUFLAG | Total packets | Discarded packets |
| A | 0 | 64585 | 3 |
| B | 0 | 46145 | 6 |
| C | 0 | 105513 | 9 |
| D | 0 | 47526 | 3 |
| Quadrant | Total seconds | Saturated seconds | Saturation percentage |
|---|---|---|---|
| A | 18248 | 2906 | 15.925033% |
| B | 18246 | 580 | 3.178779% |
| C | 18247 | 8659 | 47.454376% |
| D | 18247 | 934 | 5.118650% |
Noise dominated data is calculated using 1-second bins in cleaned event files. If a bin has >2000 counts, and if more than 50% of those come from <1% of pixels, then it is considered to be noise-dominated and hence unusable.
| Quadrant | # 1 sec bins | Bins with >0 counts | Bins with >2000 counts | High rate bins dominated by noise | Noise dominated (total time) | Noise dominated (detector-on time) | Marked lightcurve |
|---|---|---|---|---|---|---|---|
| A | 19708 | 18252 | 2228 | 2228 | 11.31% | 12.21% | 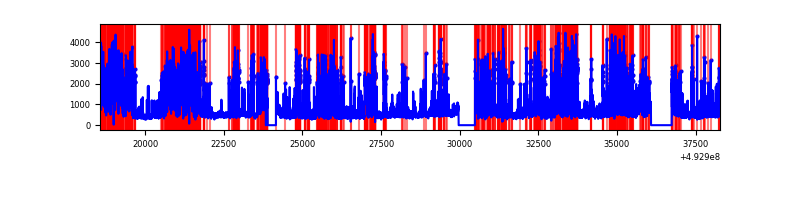 |
| B | 19708 | 18251 | 172 | 172 | 0.87% | 0.94% | 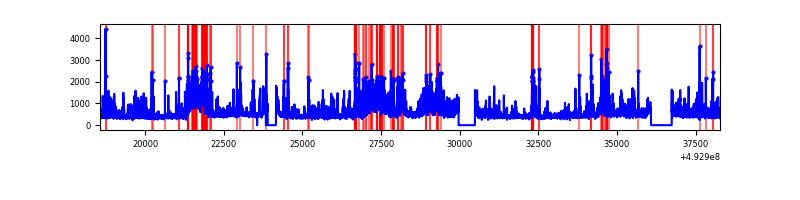 |
| C | 19707 | 18250 | 7361 | 7361 | 37.35% | 40.33% | 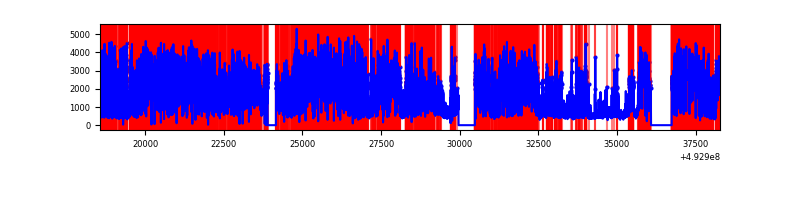 |
| D | 19707 | 18251 | 647 | 647 | 3.28% | 3.55% | 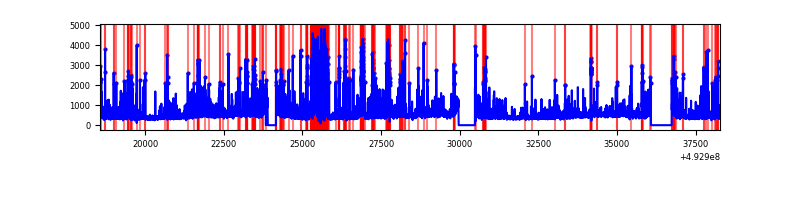 |
Top three noisy pixels from each quadrant. If the there are fewer than three noisy pixels in the level2.evt file, extra rows are filled as -1
| Pixel properties | Quadrant properties | ||||||
|---|---|---|---|---|---|---|---|
| Quadrant | DetID | PixID | Counts | Sigma | Mean | Median | Sigma |
| A | 15 | 174 | 4650645 | 10223.68 | 1829 | 1778 | 454.7 |
| A | 3 | 63 | 3705081 | 8144.22 | 1829 | 1778 | 454.7 |
| A | 4 | 249 | 1405254 | 3086.49 | 1829 | 1778 | 454.7 |
| B | 8 | 234 | 1207170 | 2911.96 | 1931 | 1861 | 413.9 |
| B | 4 | 171 | 1125767 | 2715.3 | 1931 | 1861 | 413.9 |
| B | 10 | 254 | 378127 | 909.04 | 1931 | 1861 | 413.9 |
| C | 1 | 241 | 9499208 | 24261.73 | 1445 | 1434 | 391.5 |
| C | 15 | 224 | 6426722 | 16413.17 | 1445 | 1434 | 391.5 |
| C | 15 | 178 | 5788298 | 14782.34 | 1445 | 1434 | 391.5 |
| D | 2 | 172 | 1784442 | 3428.47 | 1849 | 1771 | 520.0 |
| D | 3 | 12 | 667894 | 1281.1 | 1849 | 1771 | 520.0 |
| D | 12 | 3 | 380553 | 728.48 | 1849 | 1771 | 520.0 |
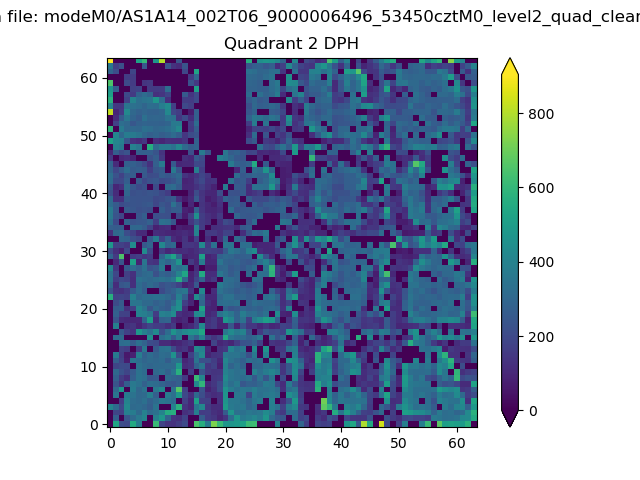
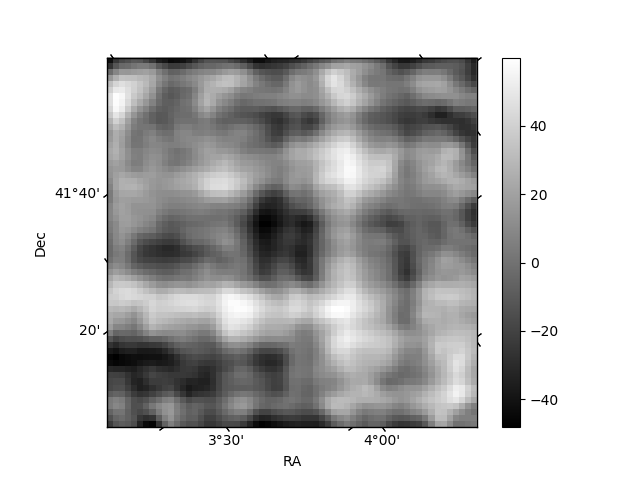
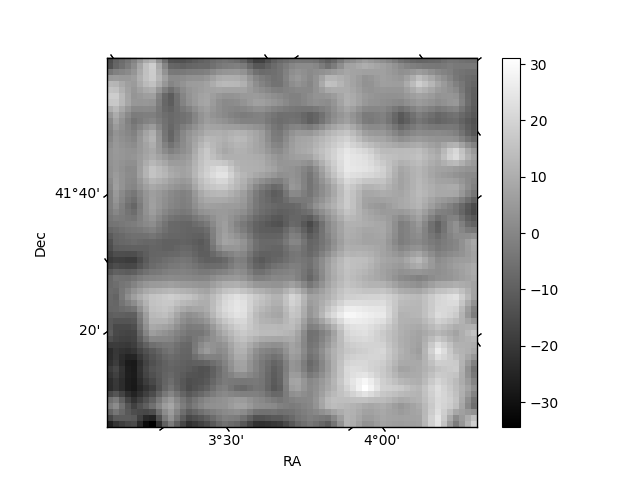
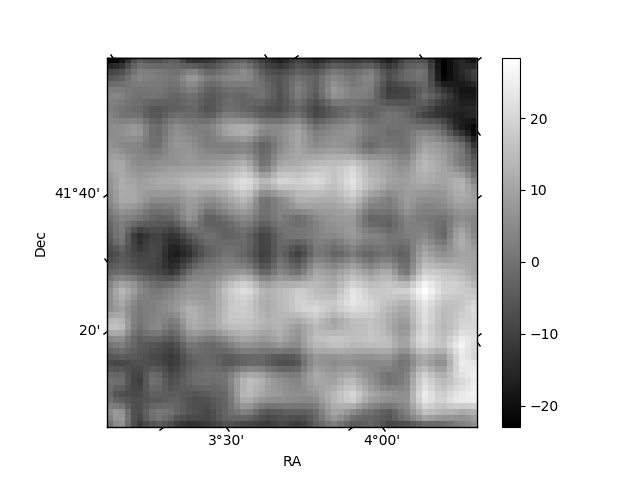
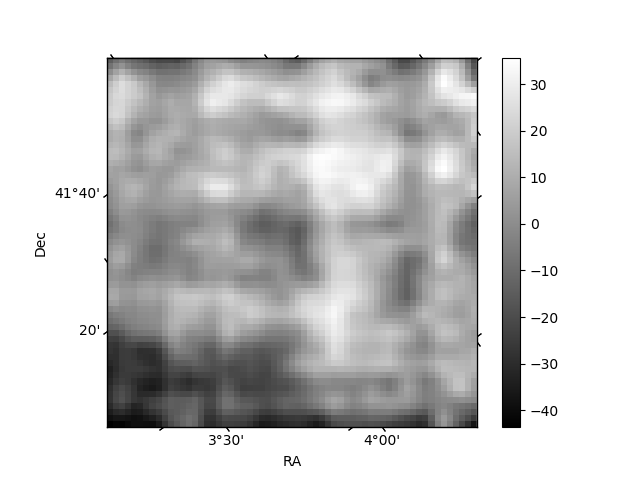
Histogram calculated using DETX and DETY for each event in the final _common_clean file
| Quadrant A | 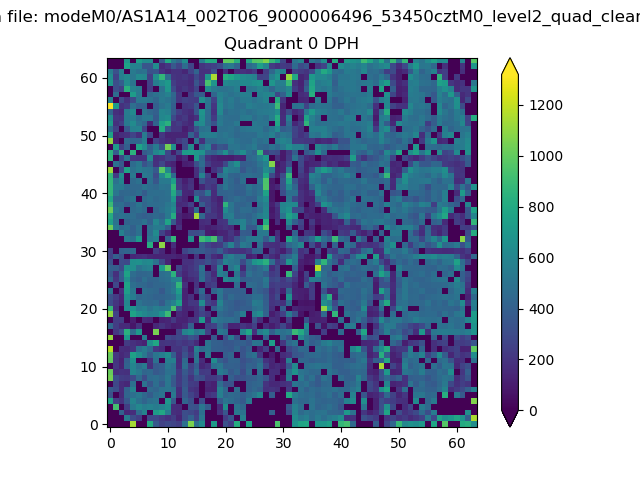 |
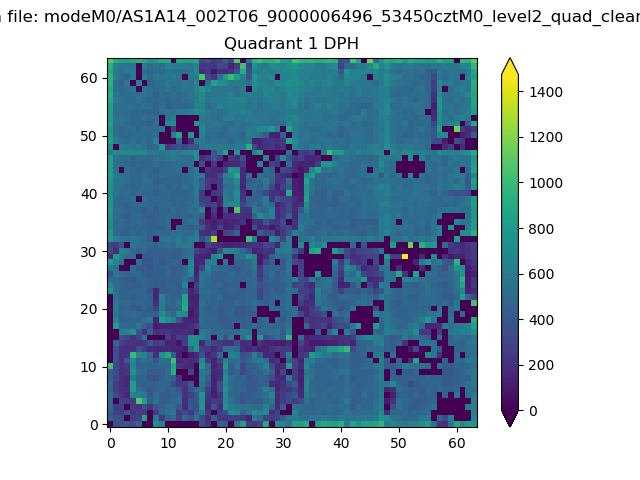 |
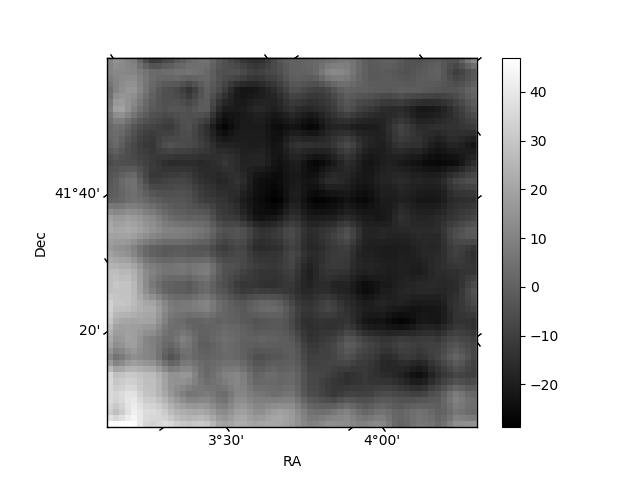
Quadrant B |
|---|---|---|---|
| Quadrant D | 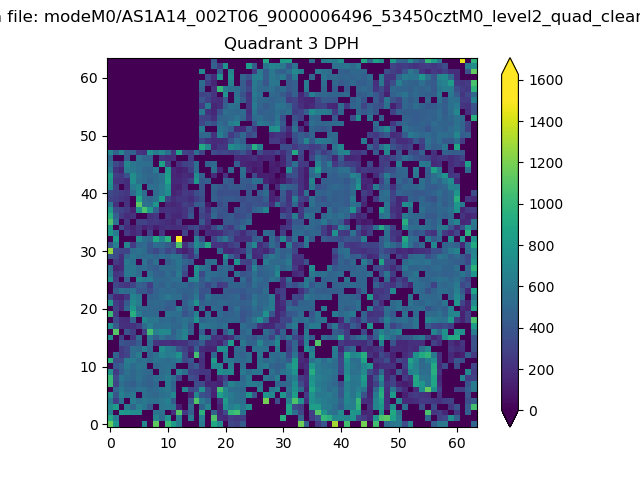 |
 |
Quadrant C |
| Plot type | Count rate plots | Images |
|---|---|---|
| Comparison with Poisson distribution Blue bars denote a histogram of data divided into 1 sec bins. Red curve is a Poisson curve with rate = median count rate of data. |
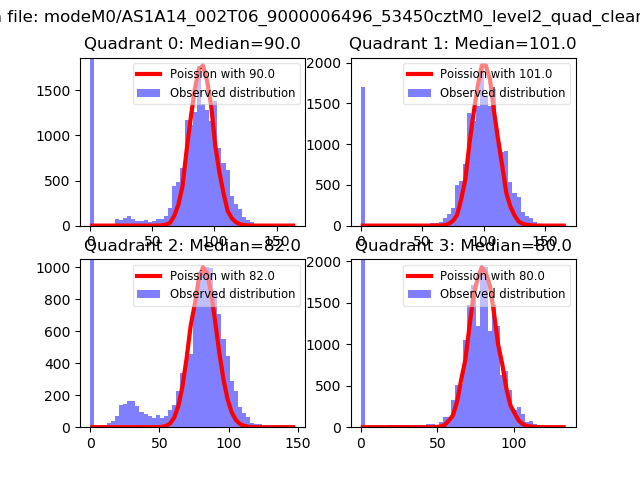 |
 |
| Quadrant-wise count rates Data is divided into 100 sec bins |
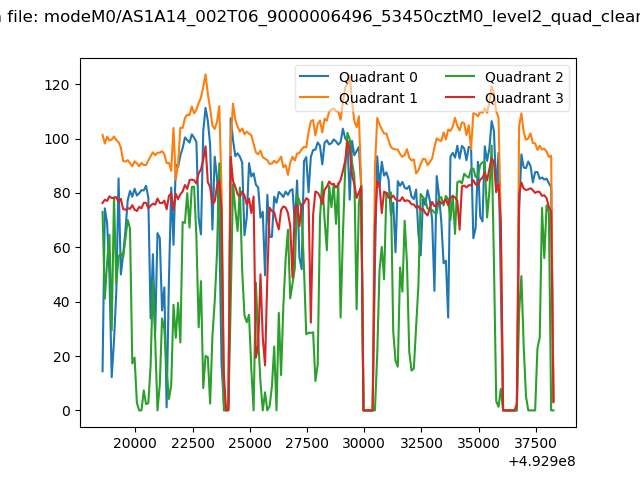 |
|
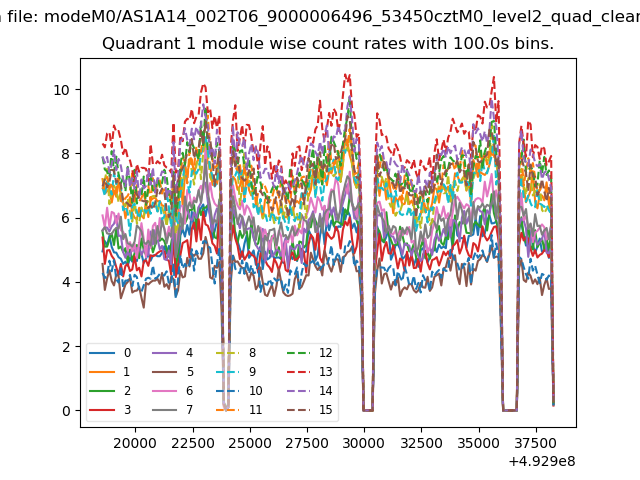
| Module-wise count rates for Quadrant A Data is divided into 100 sec bins |
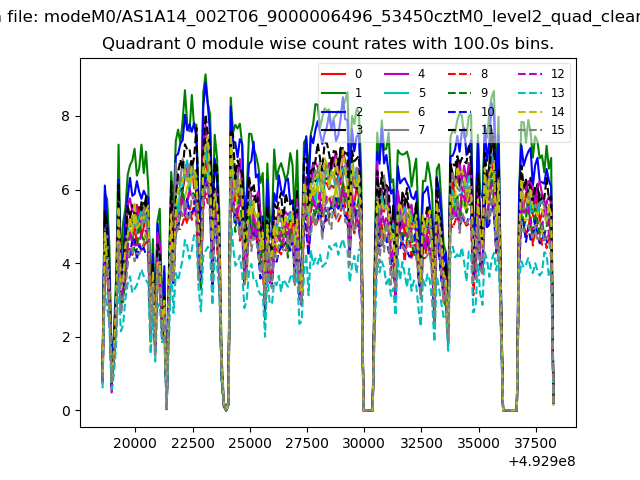 |
 |
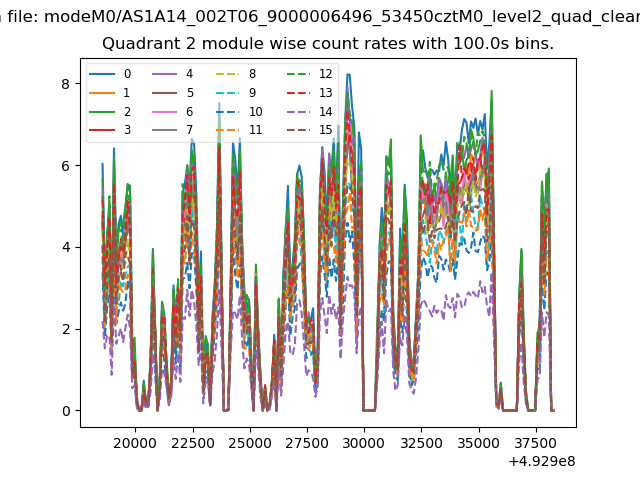
| Module-wise count rates for Quadrant B Data is divided into 100 sec bins |
 |
 |
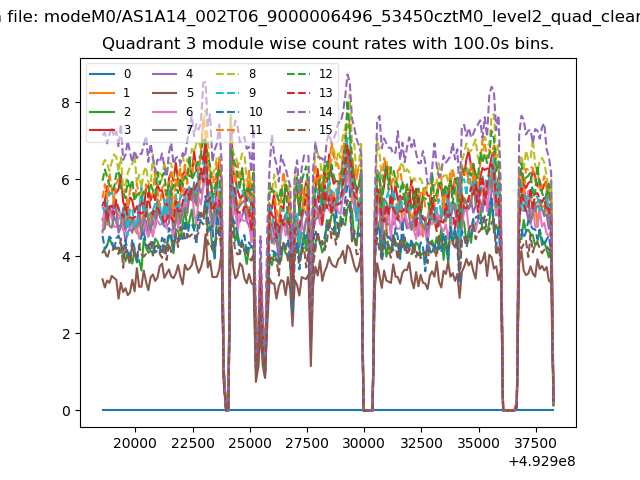
| Module-wise count rates for Quadrant C Data is divided into 100 sec bins |
 |
 |
| Module-wise count rates for Quadrant D Data is divided into 100 sec bins |
 |
 |
| Parameter | Plot |
|---|---|
| CZT HV Monitor | 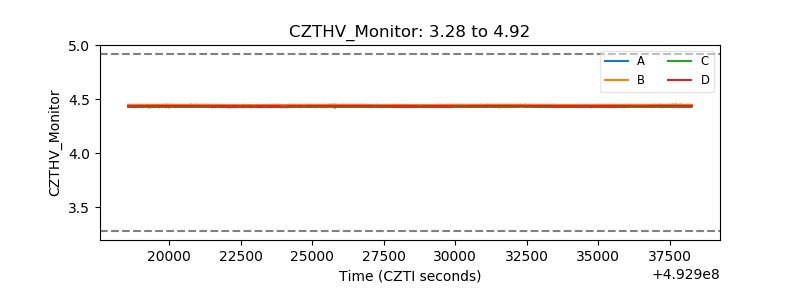 |
| D_VDD | 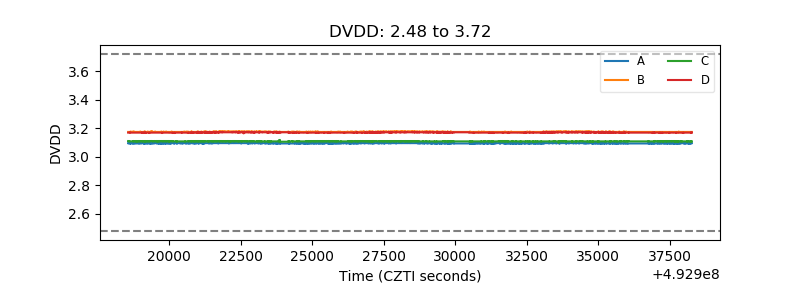 |
| Temperature 1 | 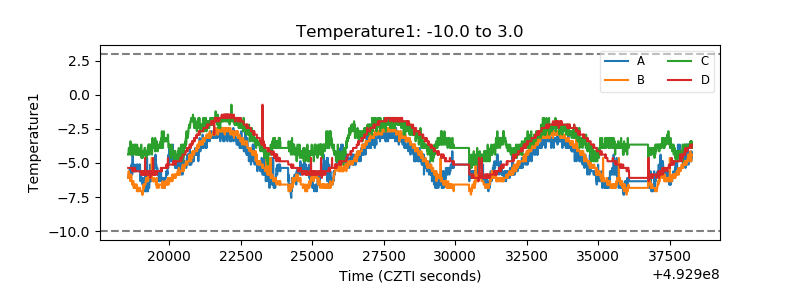 |
| Veto HV Monitor | 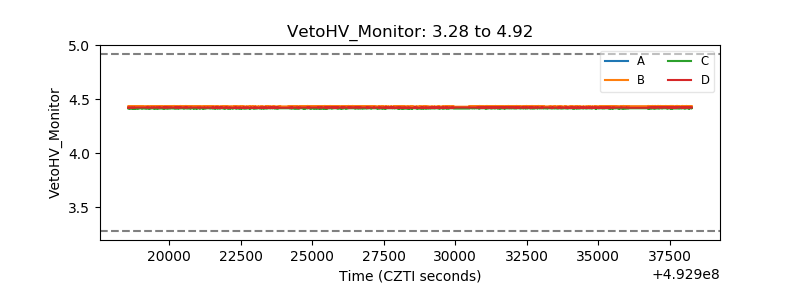 |
| Veto LLD | 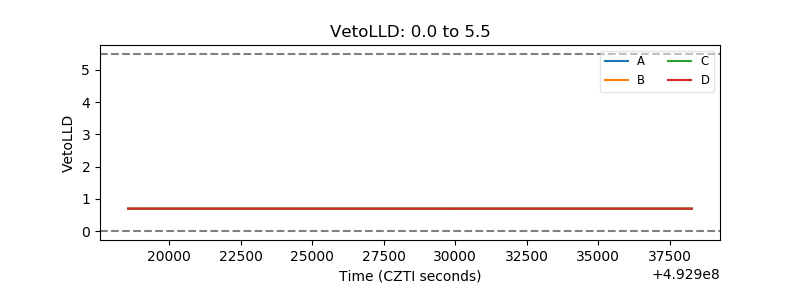 |
| Alpha Counter | 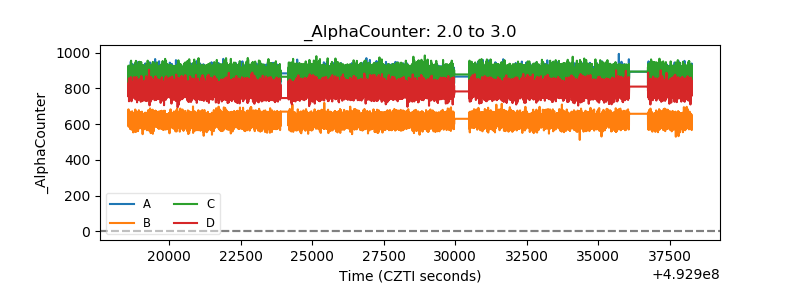 |
| _CPM_Rate | 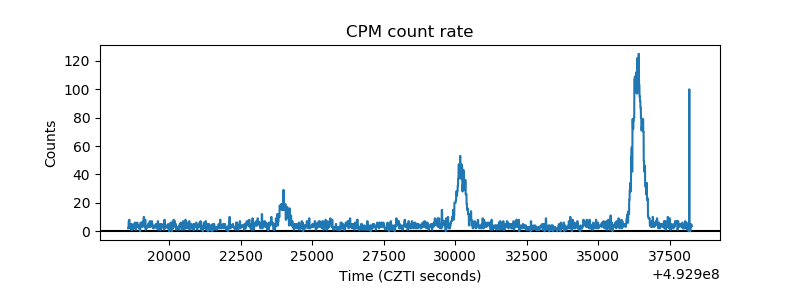 |
| CZT Counter | 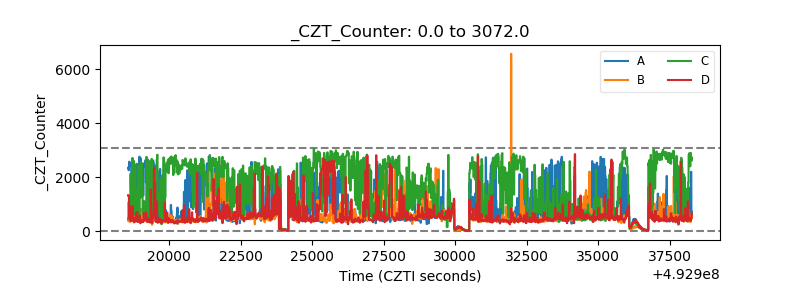 |
| +2.5 Volts monitor | 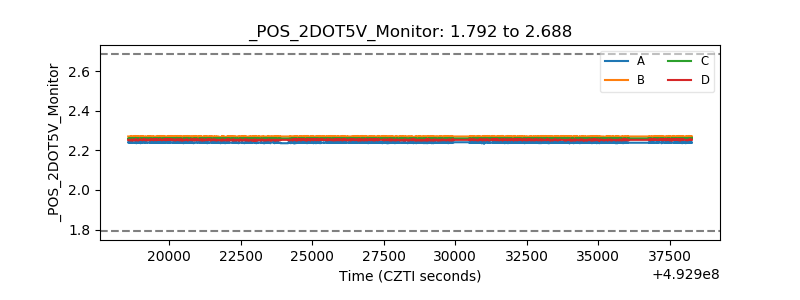 |
| +5 Volts monitor | 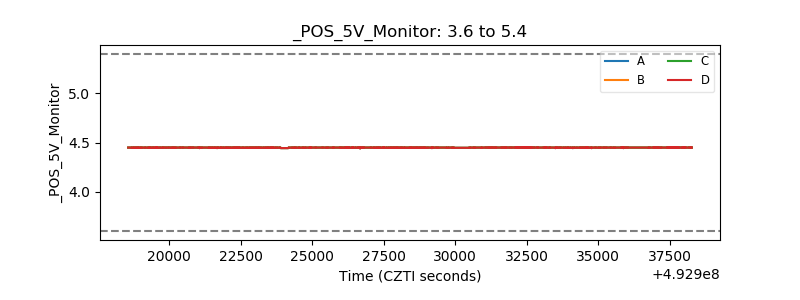 |
| _ROLL_ROT | 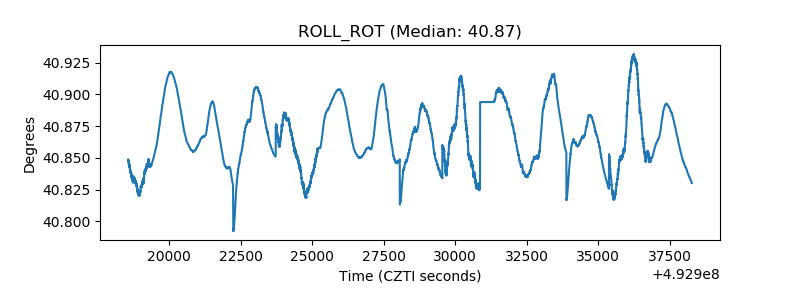 |
| _Roll_DEC | 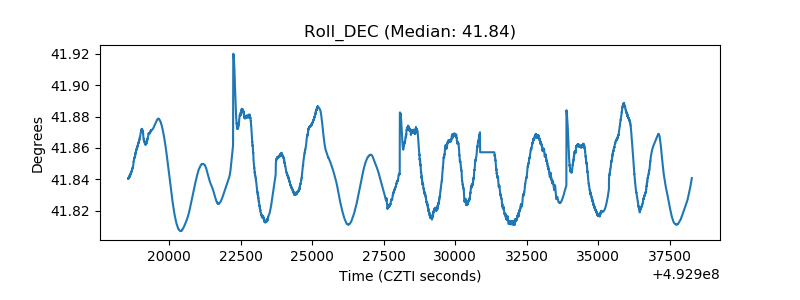 |
| _Roll_RA | 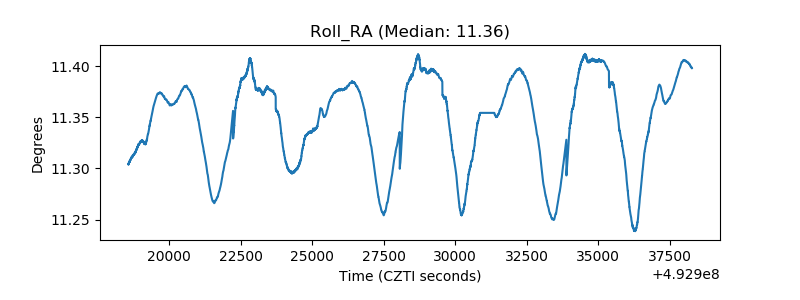 |
| Veto Counter | 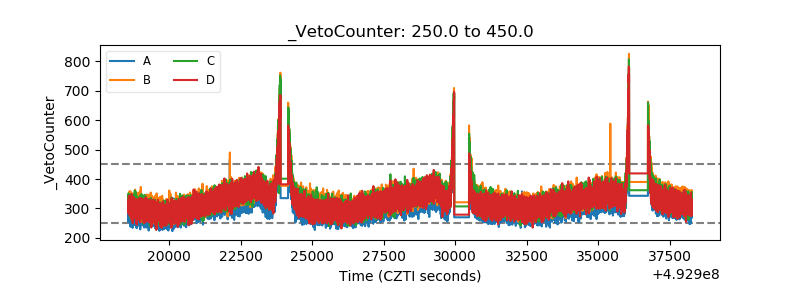 |