| Param | Original file | Final file |
|---|---|---|
| Filename | modeM0/AS1A14_002T06_9000006496_53453cztM0_level2.fits | modeM0/AS1A14_002T06_9000006496_53453cztM0_level2_quad_clean.evt |
| Size (bytes) | 675,472,320 | 93,280,320 |
| Size | 644.2 MB | 89.0 MB |
| Events in quadrant A | 5,170,698 | 623,418 |
| Events in quadrant B | 4,541,350 | 706,943 |
| Events in quadrant C | 10,026,321 | 444,459 |
| Events in quadrant D | 4,737,562 | 574,499 |
| Mode M9 | |||
|---|---|---|---|
| Quadrant | BADHDUFLAG | Total packets | Discarded packets |
| A | 0 | 9 | 0 |
| B | 0 | 10 | 0 |
| C | 0 | 10 | 0 |
| D | 0 | 10 | 0 |
| Mode SS | |||
|---|---|---|---|
| Quadrant | BADHDUFLAG | Total packets | Discarded packets |
| A | 0 | 140 | 0 |
| B | 0 | 140 | 0 |
| C | 0 | 140 | 0 |
| D | 0 | 140 | 0 |
| Mode M0 | |||
|---|---|---|---|
| Quadrant | BADHDUFLAG | Total packets | Discarded packets |
| A | 0 | 19977 | 5 |
| B | 0 | 18233 | 2 |
| C | 0 | 34414 | 2 |
| D | 0 | 18747 | 2 |
| Quadrant | Total seconds | Saturated seconds | Saturation percentage |
|---|---|---|---|
| A | 6809 | 661 | 9.707740% |
| B | 6809 | 323 | 4.743722% |
| C | 6809 | 2328 | 34.190043% |
| D | 6809 | 360 | 5.287120% |
Noise dominated data is calculated using 1-second bins in cleaned event files. If a bin has >2000 counts, and if more than 50% of those come from <1% of pixels, then it is considered to be noise-dominated and hence unusable.
| Quadrant | # 1 sec bins | Bins with >0 counts | Bins with >2000 counts | High rate bins dominated by noise | Noise dominated (total time) | Noise dominated (detector-on time) | Marked lightcurve |
|---|---|---|---|---|---|---|---|
| A | 7793 | 6808 | 454 | 454 | 5.83% | 6.67% | 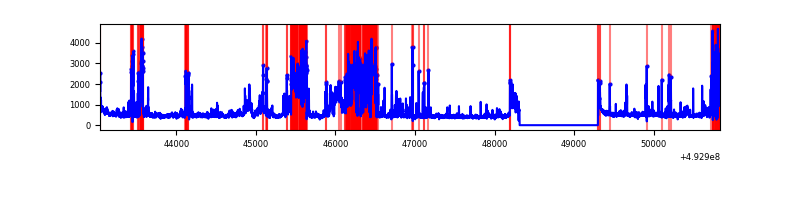 |
| B | 7794 | 6809 | 94 | 94 | 1.21% | 1.38% | 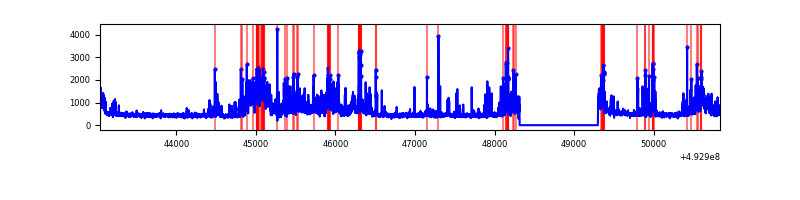 |
| C | 7794 | 6810 | 1971 | 1971 | 25.29% | 28.94% | 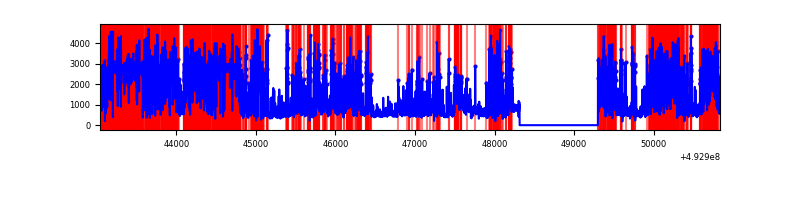 |
| D | 7794 | 6810 | 248 | 248 | 3.18% | 3.64% | 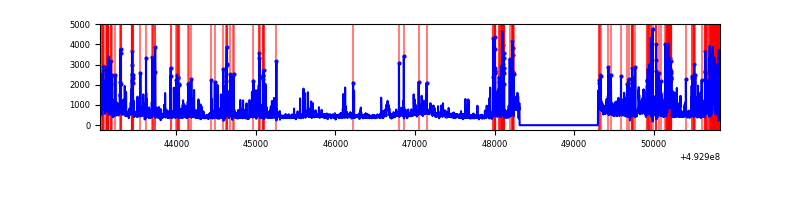 |
Top three noisy pixels from each quadrant. If the there are fewer than three noisy pixels in the level2.evt file, extra rows are filled as -1
| Pixel properties | Quadrant properties | ||||||
|---|---|---|---|---|---|---|---|
| Quadrant | DetID | PixID | Counts | Sigma | Mean | Median | Sigma |
| A | 15 | 174 | 1490620 | 8321.87 | 735 | 716 | 179.0 |
| A | 3 | 63 | 488157 | 2722.6 | 735 | 716 | 179.0 |
| A | 4 | 249 | 284165 | 1583.21 | 735 | 716 | 179.0 |
| B | 8 | 234 | 934013 | 5895.81 | 742 | 716 | 158.3 |
| B | 4 | 171 | 416657 | 2627.57 | 742 | 716 | 158.3 |
| B | 2 | 249 | 59560 | 371.73 | 742 | 716 | 158.3 |
| C | 1 | 241 | 3501672 | 21008.5 | 610 | 604 | 166.7 |
| C | 15 | 224 | 2383777 | 14300.46 | 610 | 604 | 166.7 |
| C | 15 | 178 | 789661 | 4734.81 | 610 | 604 | 166.7 |
| D | 3 | 12 | 745052 | 3599.93 | 725 | 693 | 206.8 |
| D | 8 | 176 | 186585 | 899.03 | 725 | 693 | 206.8 |
| D | 7 | 70 | 166645 | 802.59 | 725 | 693 | 206.8 |
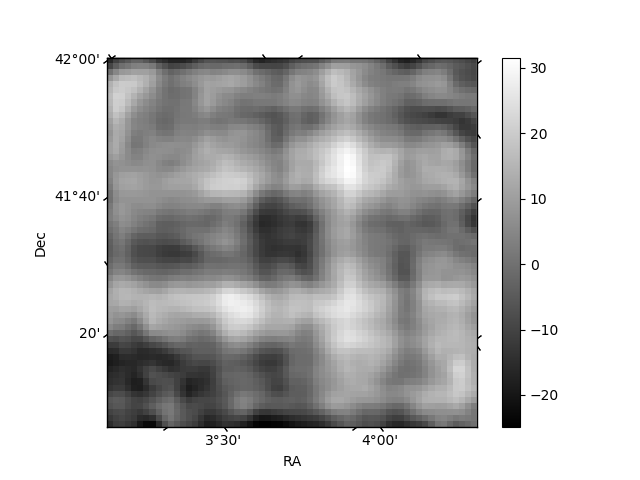
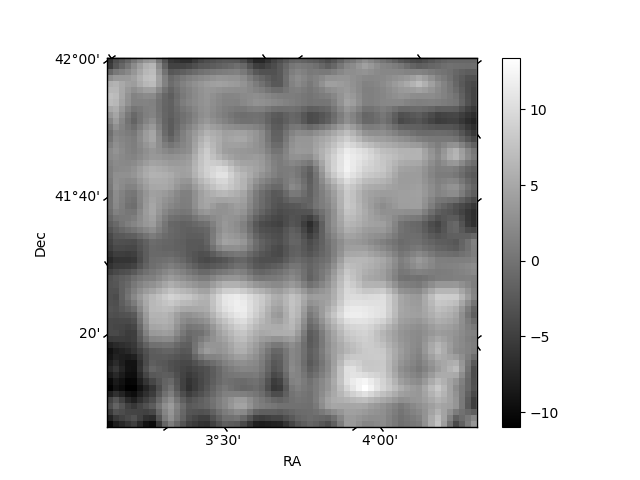
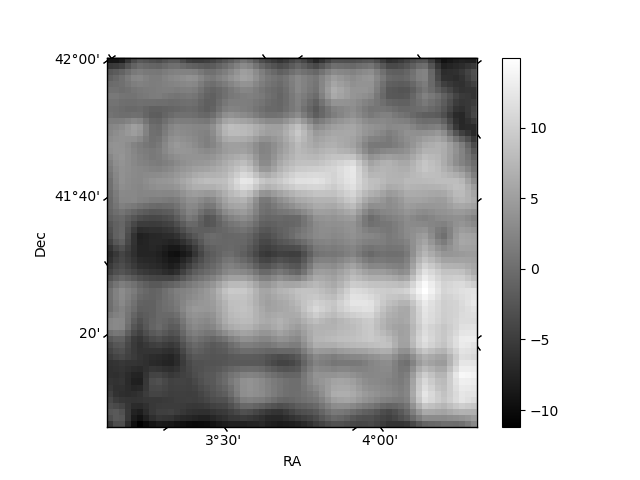
Histogram calculated using DETX and DETY for each event in the final _common_clean file
| Quadrant A | 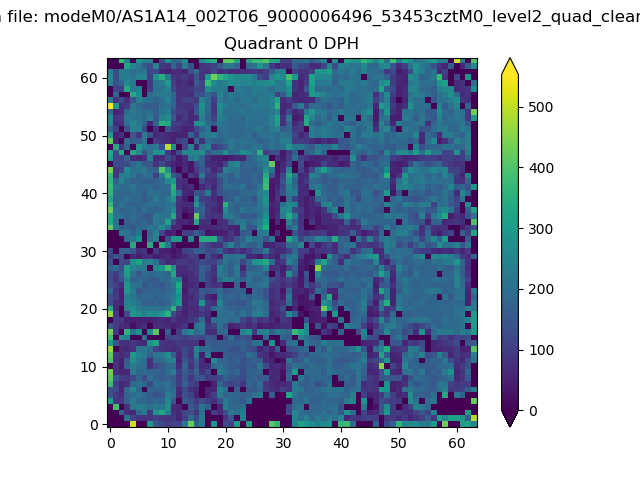 |
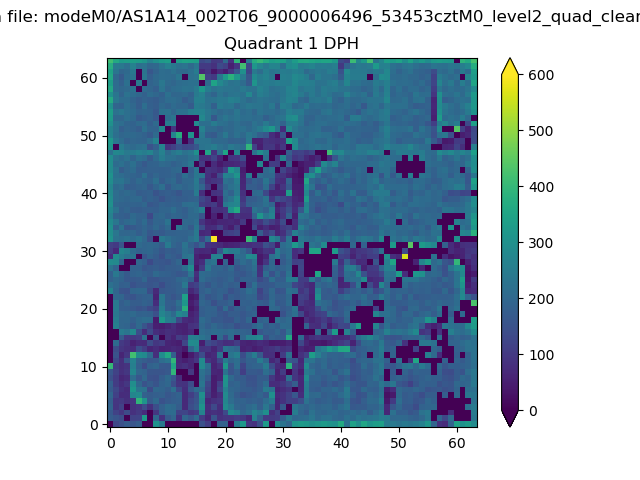 |
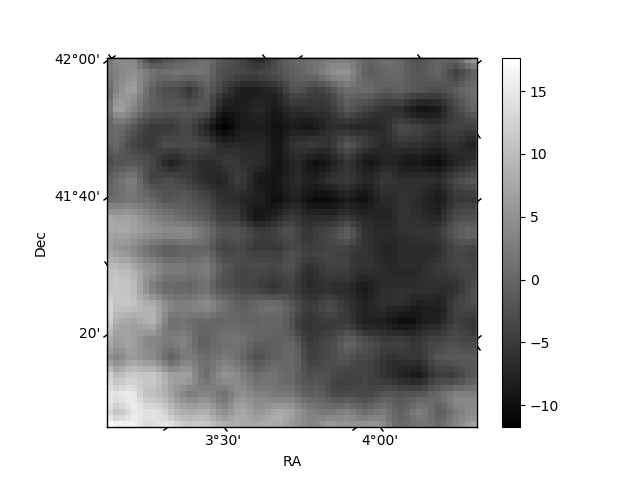
Quadrant B |
|---|---|---|---|
| Quadrant D | 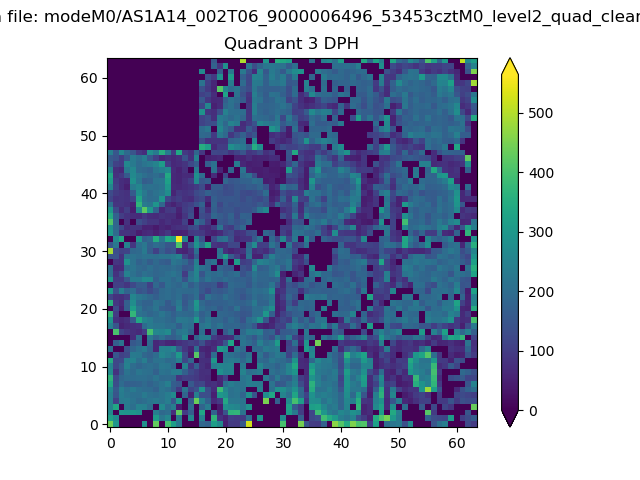 |
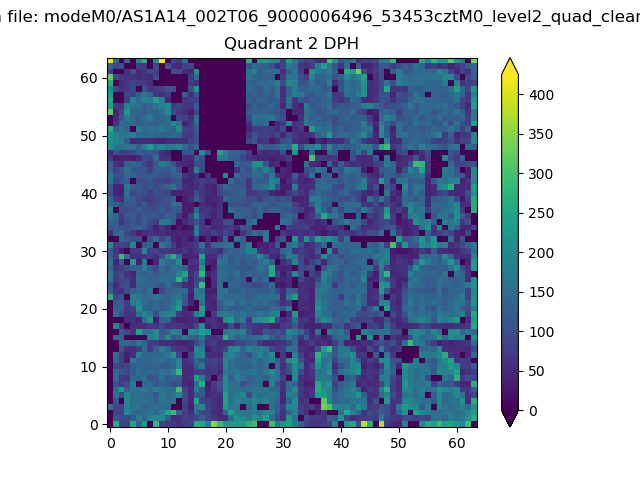 |
Quadrant C |
| Plot type | Count rate plots | Images |
|---|---|---|
| Comparison with Poisson distribution Blue bars denote a histogram of data divided into 1 sec bins. Red curve is a Poisson curve with rate = median count rate of data. |
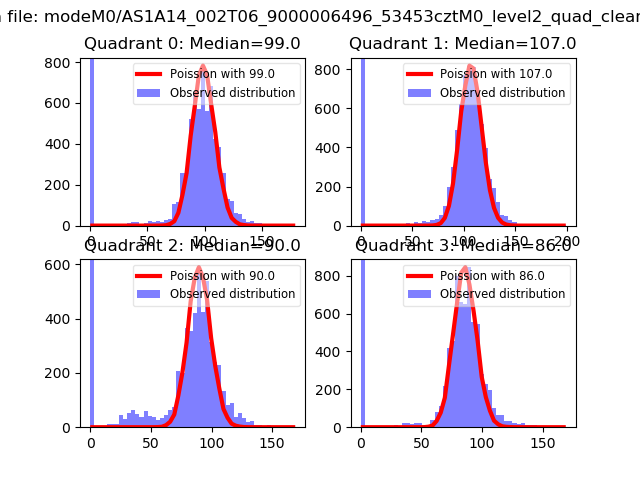 |
 |
| Quadrant-wise count rates Data is divided into 100 sec bins |
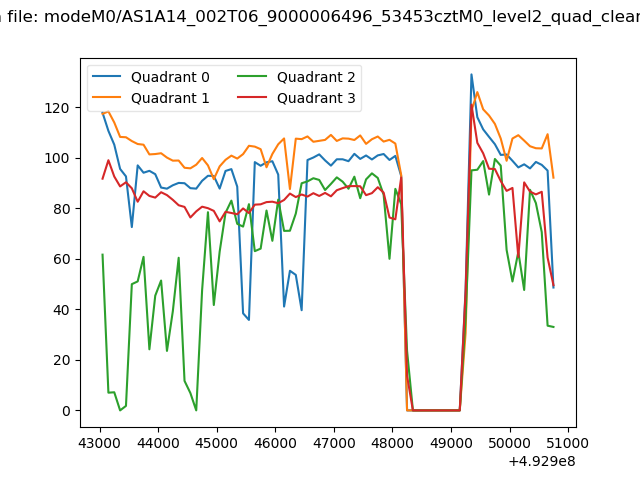 |
|
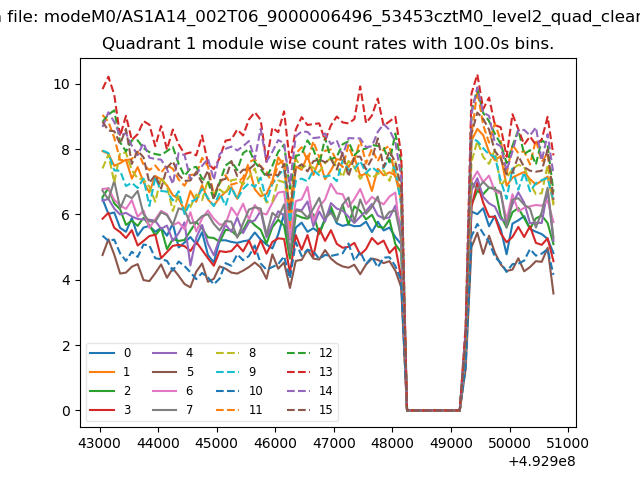
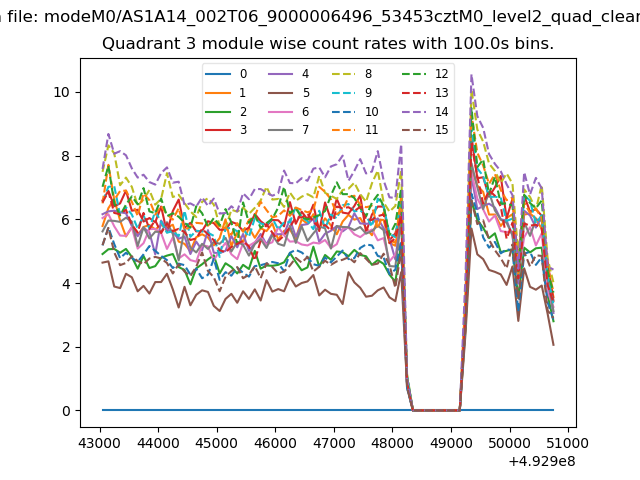
| Module-wise count rates for Quadrant A Data is divided into 100 sec bins |
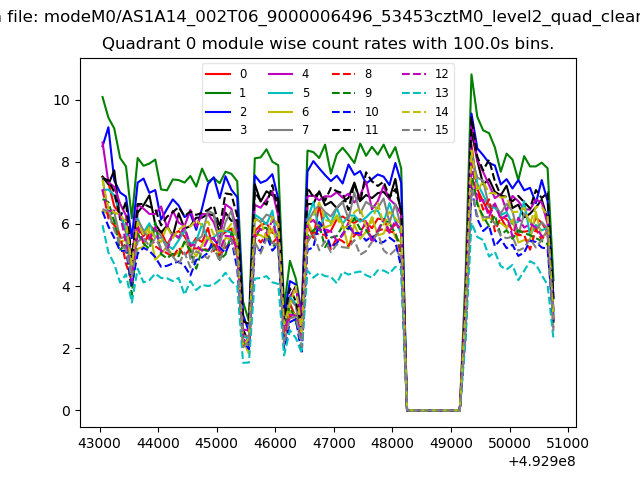 |
 |
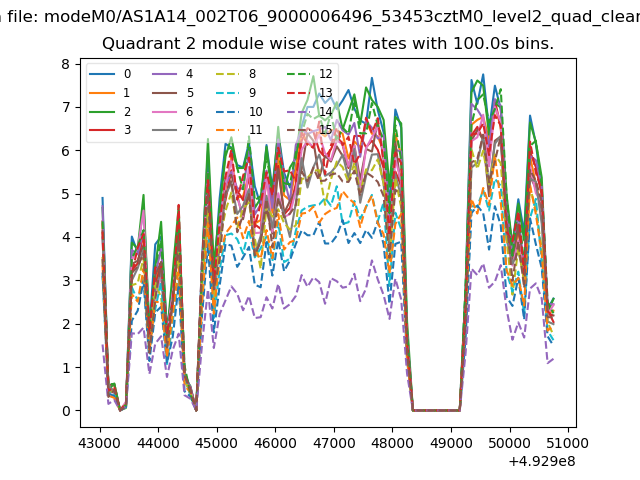
| Module-wise count rates for Quadrant B Data is divided into 100 sec bins |
 |
 |
| Module-wise count rates for Quadrant C Data is divided into 100 sec bins |
 |
 |
| Module-wise count rates for Quadrant D Data is divided into 100 sec bins |
 |
 |
| Parameter | Plot |
|---|---|
| CZT HV Monitor | 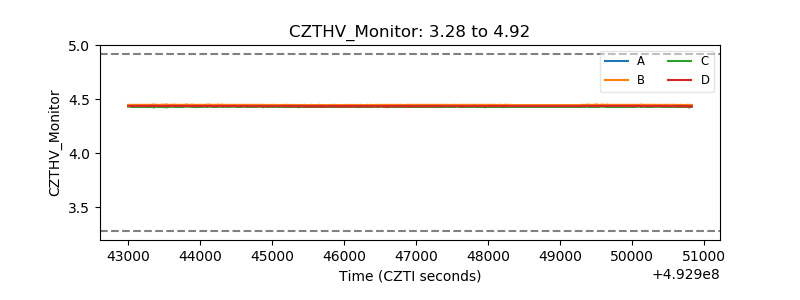 |
| D_VDD | 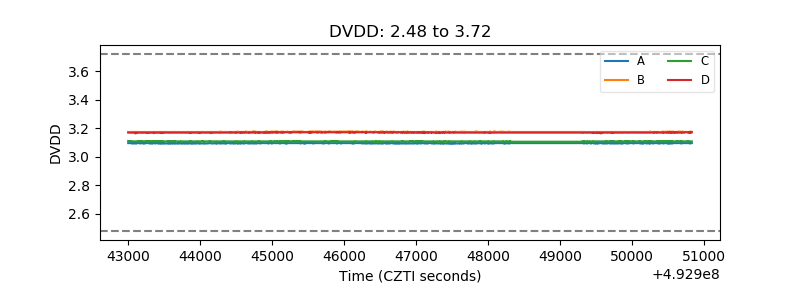 |
| Temperature 1 | 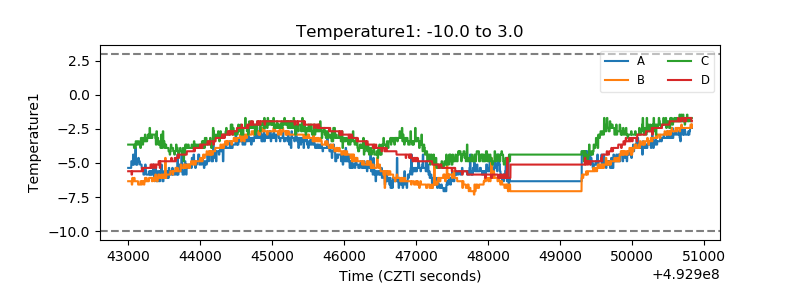 |
| Veto HV Monitor | 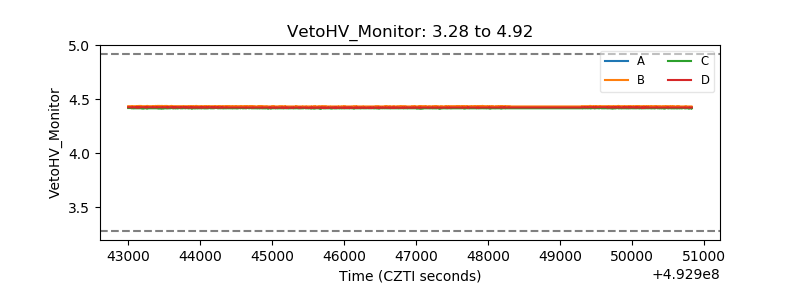 |
| Veto LLD | 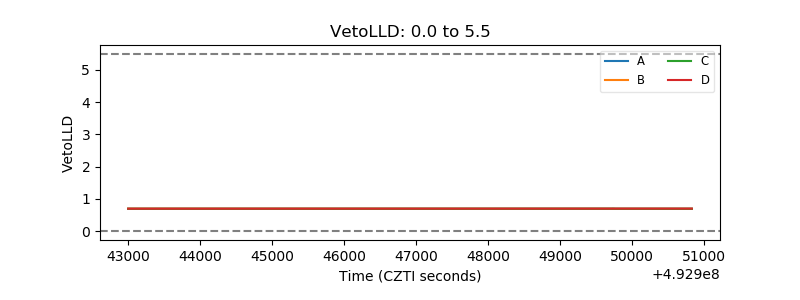 |
| Alpha Counter | 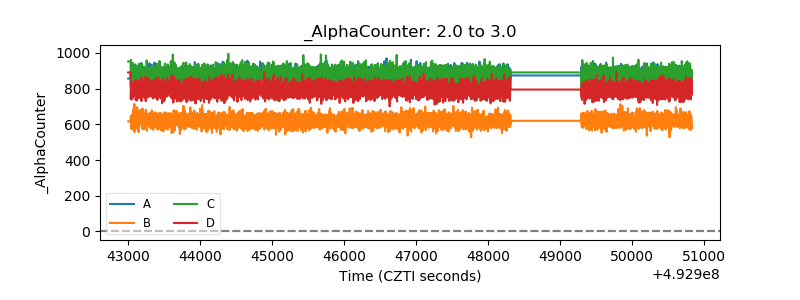 |
| _CPM_Rate | 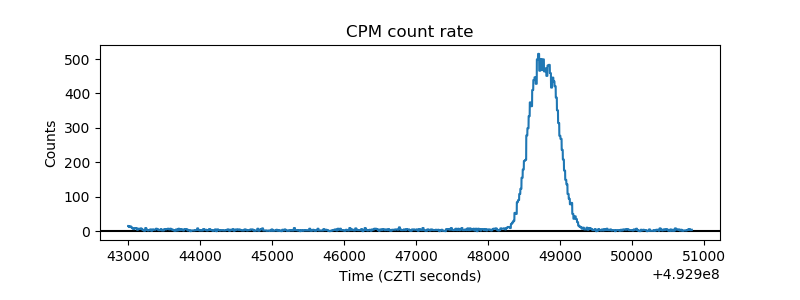 |
| CZT Counter | 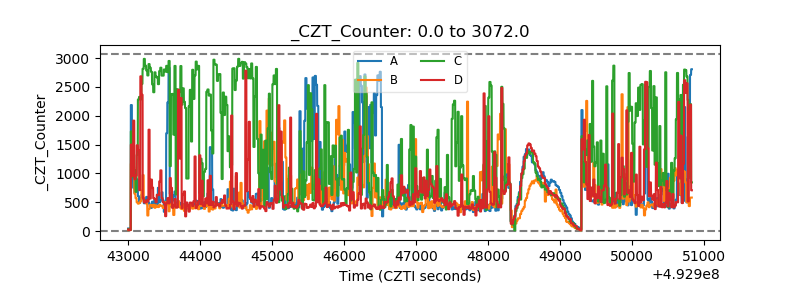 |
| +2.5 Volts monitor | 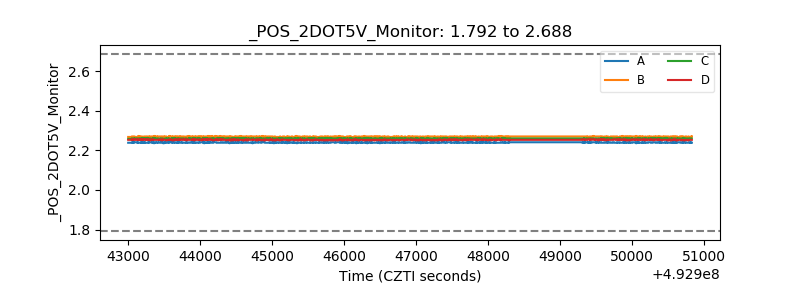 |
| +5 Volts monitor | 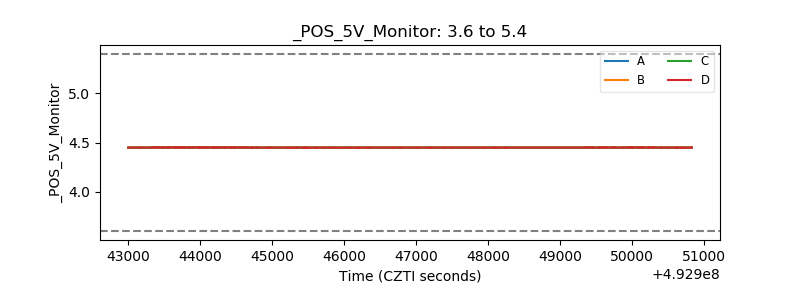 |
| _ROLL_ROT | 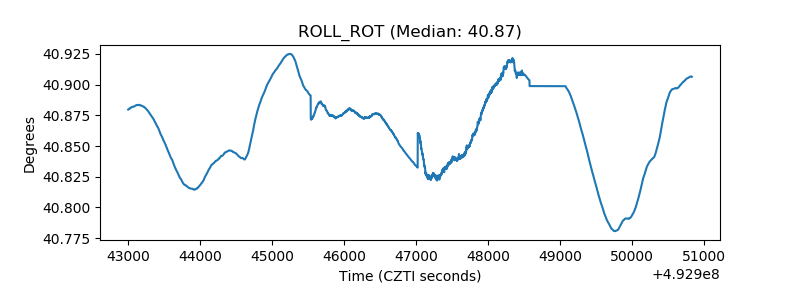 |
| _Roll_DEC | 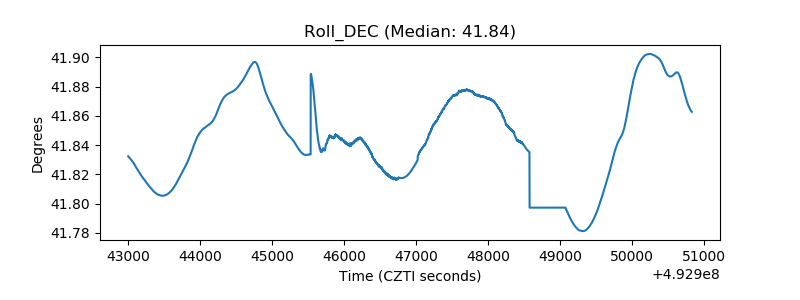 |
| _Roll_RA | 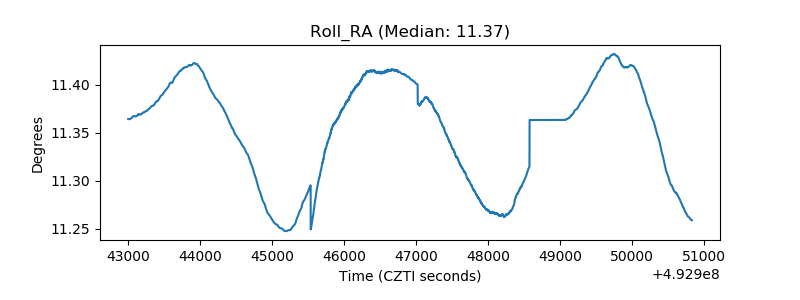 |
| Veto Counter | 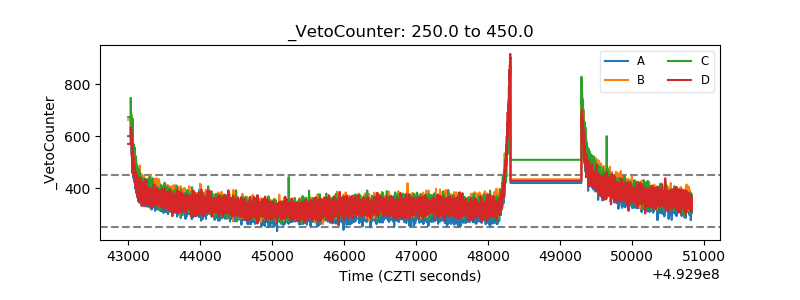 |