| Param | Original file | Final file |
|---|---|---|
| Filename | modeM0/AS1A14_002T06_9000006496_53454cztM0_level2.fits | modeM0/AS1A14_002T06_9000006496_53454cztM0_level2_quad_clean.evt |
| Size (bytes) | 672,030,720 | 94,446,720 |
| Size | 640.9 MB | 90.1 MB |
| Events in quadrant A | 6,424,828 | 603,173 |
| Events in quadrant B | 4,131,997 | 715,764 |
| Events in quadrant C | 8,117,914 | 520,378 |
| Events in quadrant D | 5,690,995 | 560,260 |
| Mode M9 | |||
|---|---|---|---|
| Quadrant | BADHDUFLAG | Total packets | Discarded packets |
| A | 0 | 12 | 0 |
| B | 0 | 13 | 0 |
| C | 0 | 13 | 0 |
| D | 0 | 13 | 0 |
| Mode SS | |||
|---|---|---|---|
| Quadrant | BADHDUFLAG | Total packets | Discarded packets |
| A | 0 | 134 | 0 |
| B | 0 | 134 | 0 |
| C | 0 | 134 | 0 |
| D | 0 | 134 | 0 |
| Mode M0 | |||
|---|---|---|---|
| Quadrant | BADHDUFLAG | Total packets | Discarded packets |
| A | 0 | 23481 | 2 |
| B | 0 | 16794 | 2 |
| C | 0 | 28679 | 2 |
| D | 0 | 21312 | 2 |
| Quadrant | Total seconds | Saturated seconds | Saturation percentage |
|---|---|---|---|
| A | 6596 | 1005 | 15.236507% |
| B | 6596 | 285 | 4.320800% |
| C | 6596 | 1497 | 22.695573% |
| D | 6596 | 602 | 9.126743% |
Noise dominated data is calculated using 1-second bins in cleaned event files. If a bin has >2000 counts, and if more than 50% of those come from <1% of pixels, then it is considered to be noise-dominated and hence unusable.
| Quadrant | # 1 sec bins | Bins with >0 counts | Bins with >2000 counts | High rate bins dominated by noise | Noise dominated (total time) | Noise dominated (detector-on time) | Marked lightcurve |
|---|---|---|---|---|---|---|---|
| A | 7686 | 6596 | 718 | 718 | 9.34% | 10.89% | 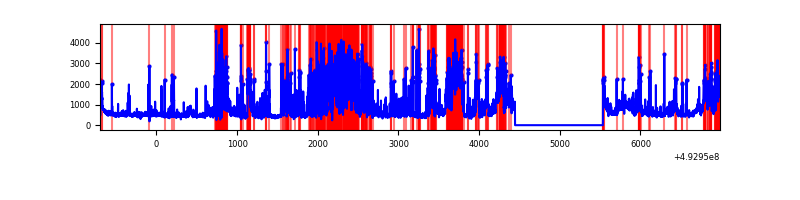 |
| B | 7686 | 6597 | 55 | 55 | 0.72% | 0.83% | 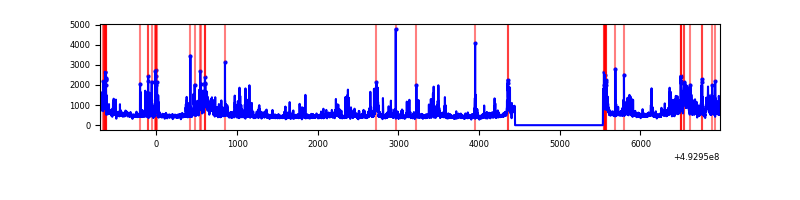 |
| C | 7686 | 6597 | 1156 | 1156 | 15.04% | 17.52% | 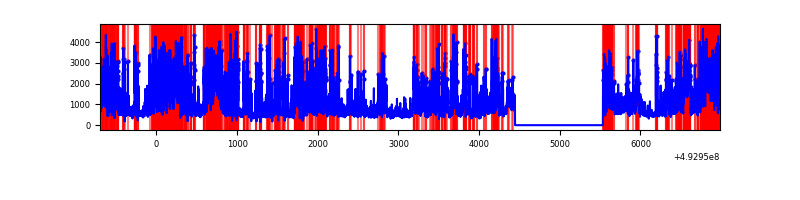 |
| D | 7686 | 6597 | 453 | 453 | 5.89% | 6.87% | 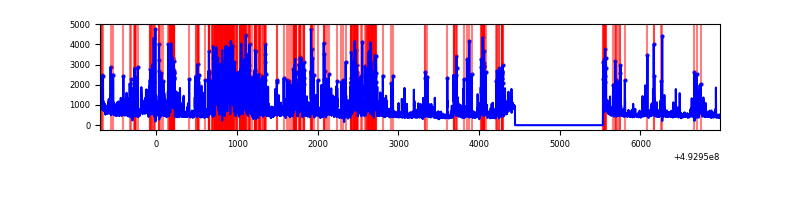 |
Top three noisy pixels from each quadrant. If the there are fewer than three noisy pixels in the level2.evt file, extra rows are filled as -1
| Pixel properties | Quadrant properties | ||||||
|---|---|---|---|---|---|---|---|
| Quadrant | DetID | PixID | Counts | Sigma | Mean | Median | Sigma |
| A | 3 | 63 | 1849621 | 10577.91 | 719 | 701 | 174.8 |
| A | 15 | 174 | 1624915 | 9292.34 | 719 | 701 | 174.8 |
| A | 12 | 80 | 52404 | 295.8 | 719 | 701 | 174.8 |
| B | 4 | 171 | 572819 | 3589.09 | 743 | 718 | 159.4 |
| B | 8 | 234 | 354880 | 2221.84 | 743 | 718 | 159.4 |
| B | 4 | 206 | 107129 | 667.57 | 743 | 718 | 159.4 |
| C | 15 | 224 | 2730141 | 15093.16 | 664 | 658 | 180.8 |
| C | 15 | 178 | 1147440 | 6341.33 | 664 | 658 | 180.8 |
| C | 1 | 241 | 902316 | 4985.88 | 664 | 658 | 180.8 |
| D | 8 | 176 | 1047780 | 5137.32 | 713 | 682 | 203.8 |
| D | 3 | 12 | 852774 | 4180.57 | 713 | 682 | 203.8 |
| D | 7 | 70 | 130163 | 635.27 | 713 | 682 | 203.8 |
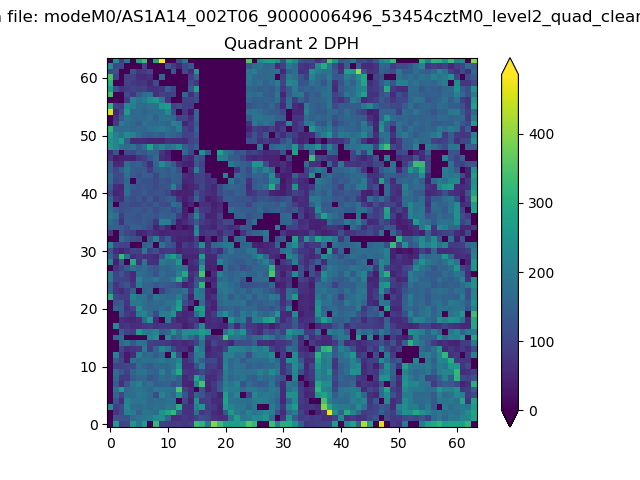
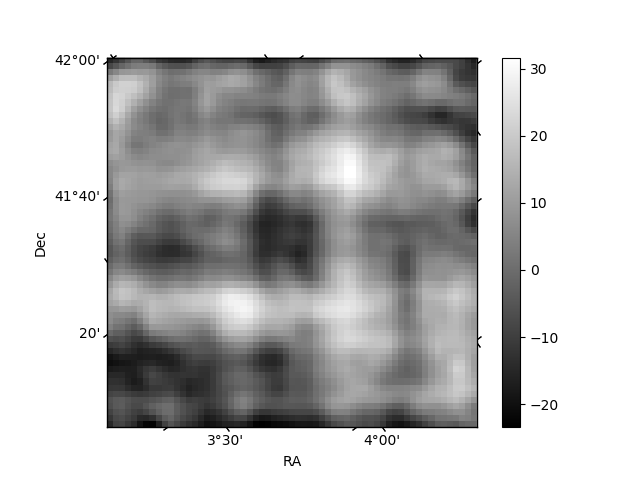
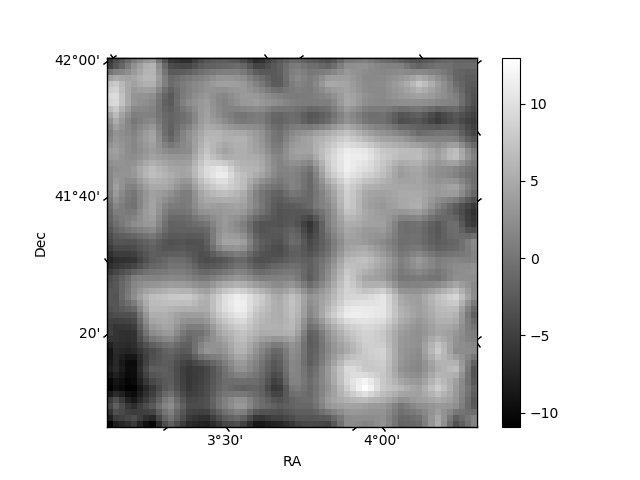
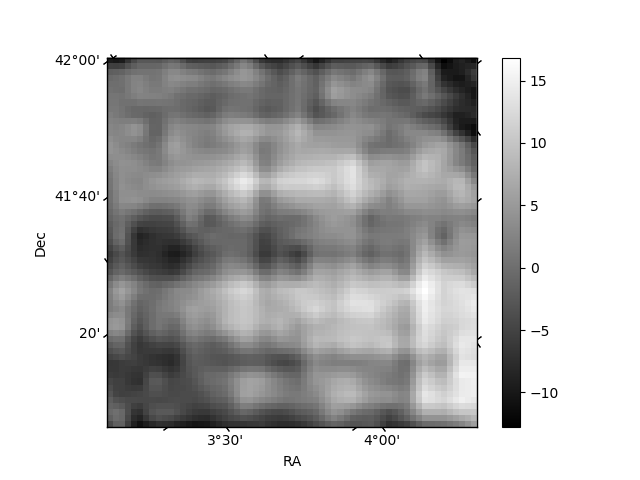
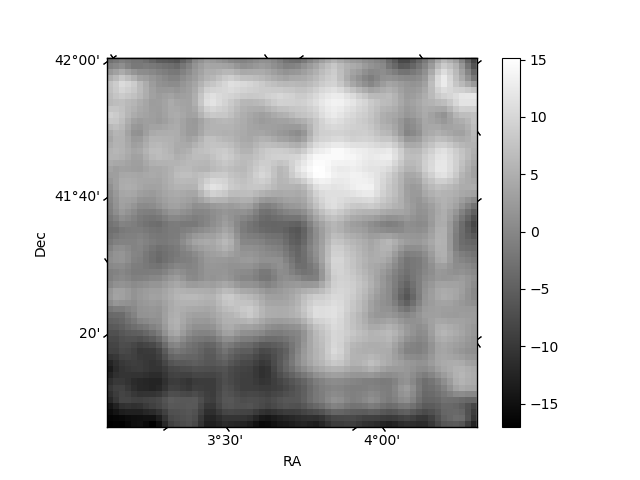
Histogram calculated using DETX and DETY for each event in the final _common_clean file
| Quadrant A | 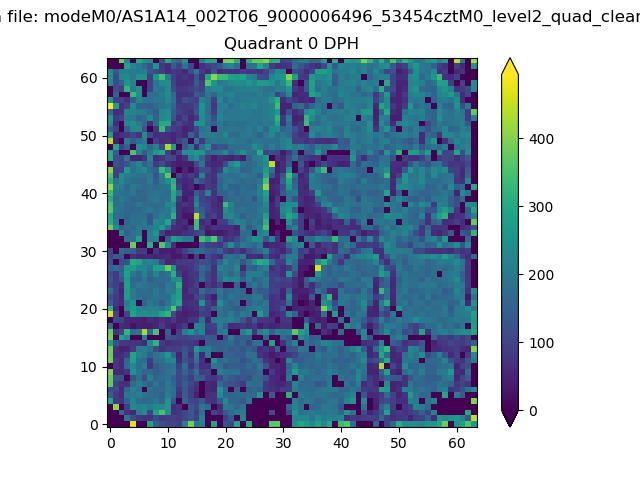 |
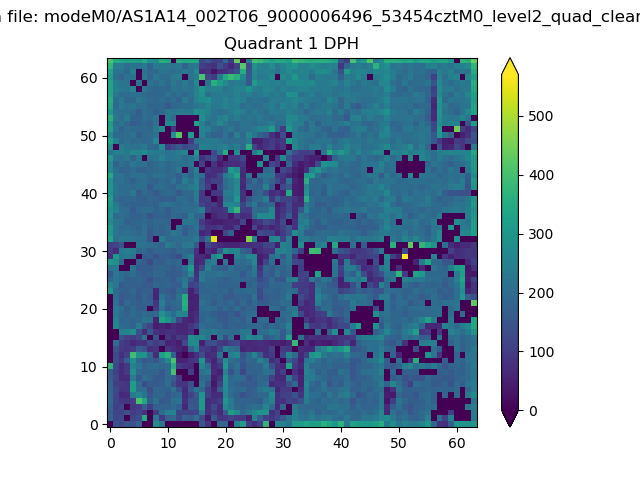 |
Quadrant B |
|---|---|---|---|
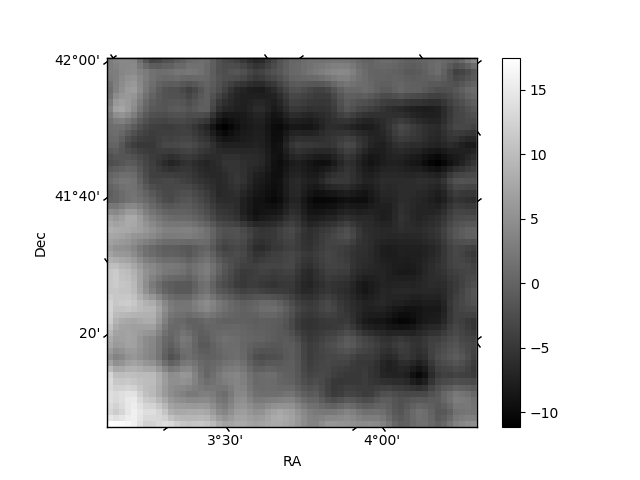
| Quadrant D | 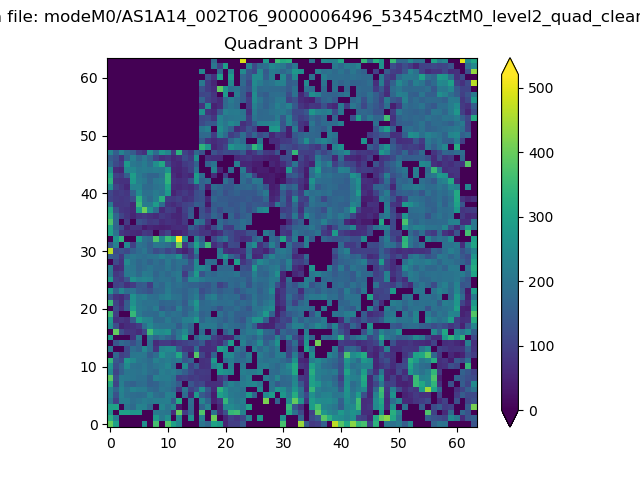 |
 |
Quadrant C |
| Plot type | Count rate plots | Images |
|---|---|---|
| Comparison with Poisson distribution Blue bars denote a histogram of data divided into 1 sec bins. Red curve is a Poisson curve with rate = median count rate of data. |
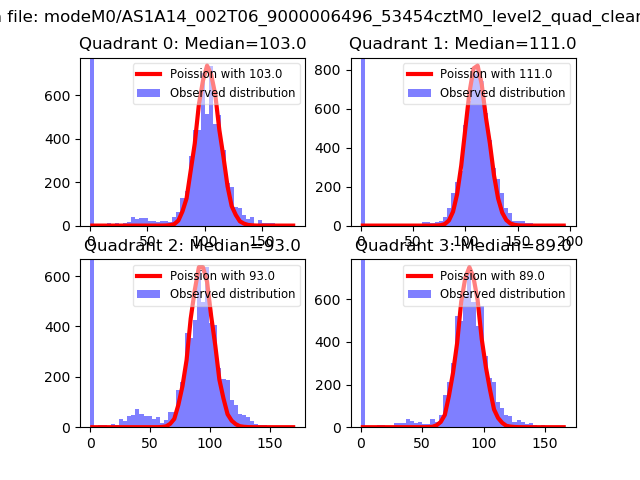 |
 |
| Quadrant-wise count rates Data is divided into 100 sec bins |
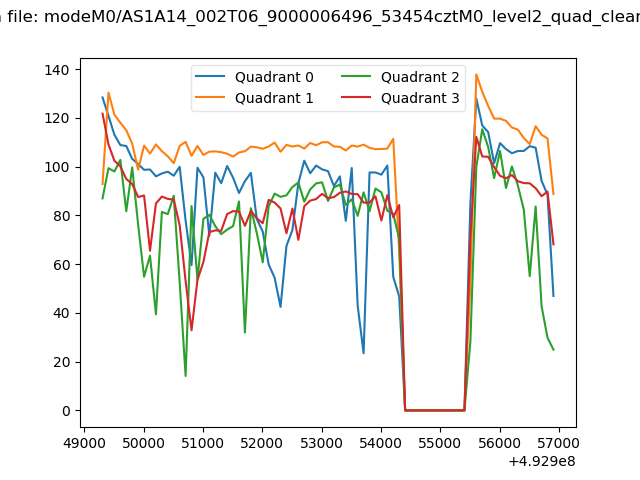 |
|
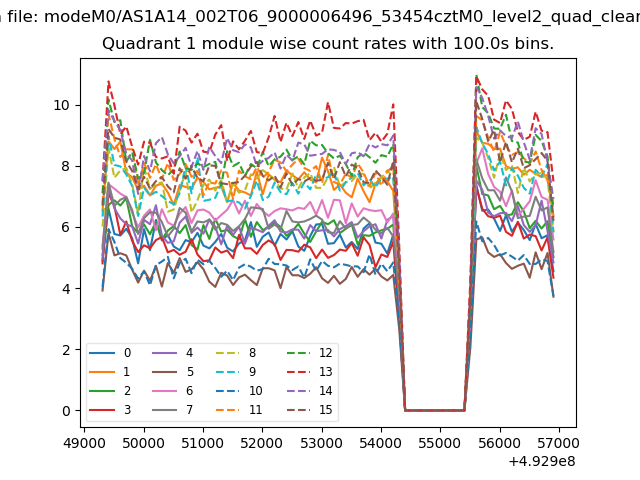
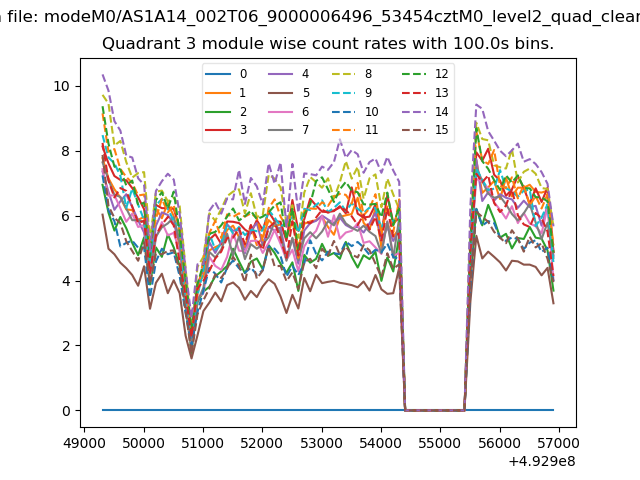
| Module-wise count rates for Quadrant A Data is divided into 100 sec bins |
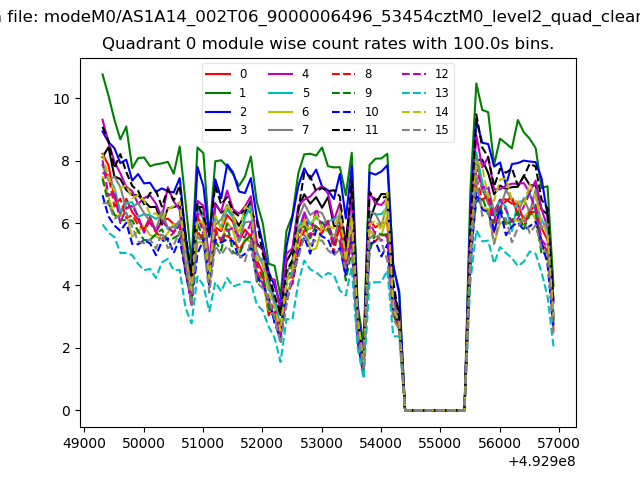 |
 |
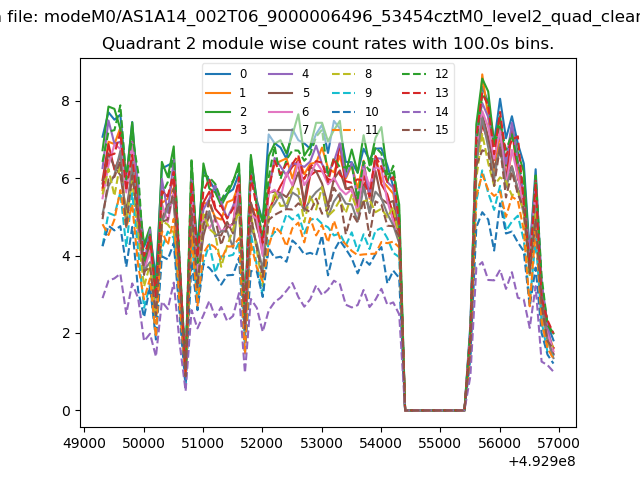
| Module-wise count rates for Quadrant B Data is divided into 100 sec bins |
 |
 |
| Module-wise count rates for Quadrant C Data is divided into 100 sec bins |
 |
 |
| Module-wise count rates for Quadrant D Data is divided into 100 sec bins |
 |
 |
| Parameter | Plot |
|---|---|
| CZT HV Monitor | 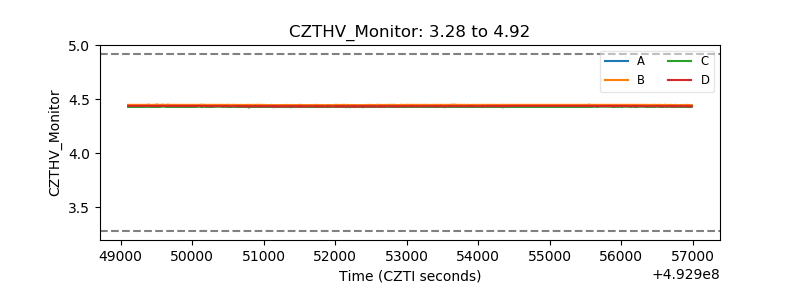 |
| D_VDD | 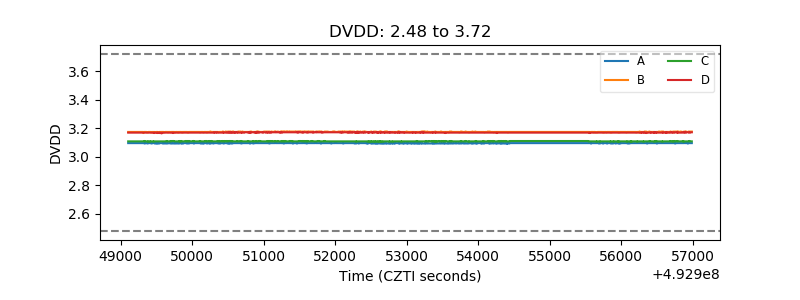 |
| Temperature 1 | 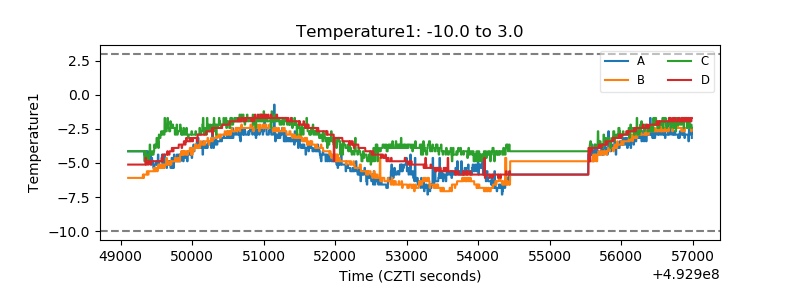 |
| Veto HV Monitor | 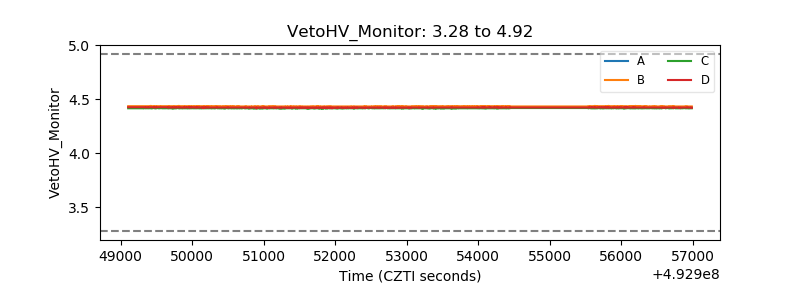 |
| Veto LLD | 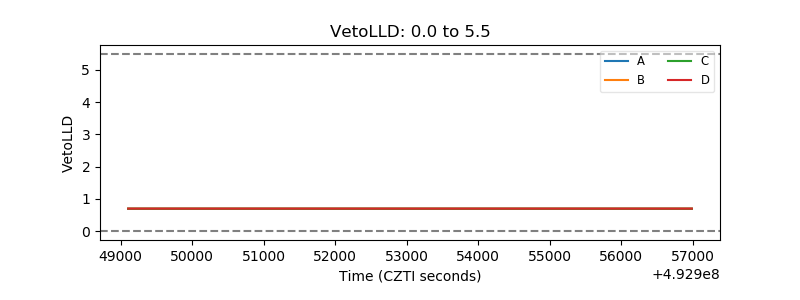 |
| Alpha Counter | 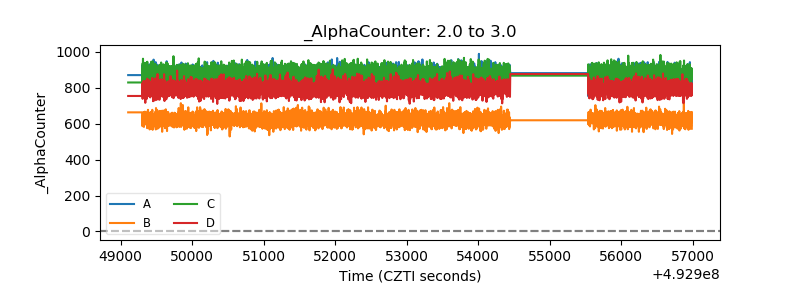 |
| _CPM_Rate | 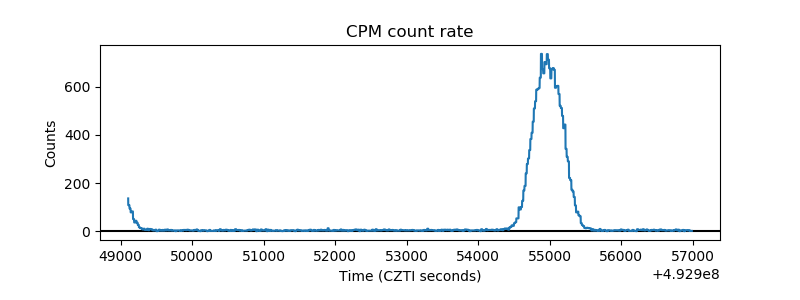 |
| CZT Counter | 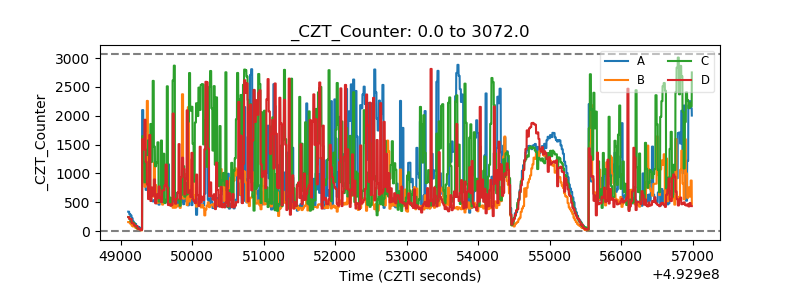 |
| +2.5 Volts monitor |  |
| +5 Volts monitor | 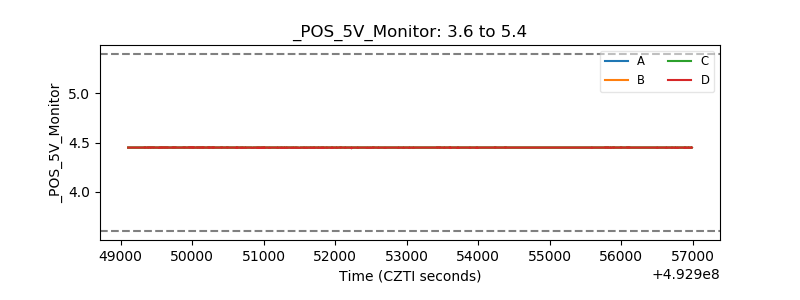 |
| _ROLL_ROT | 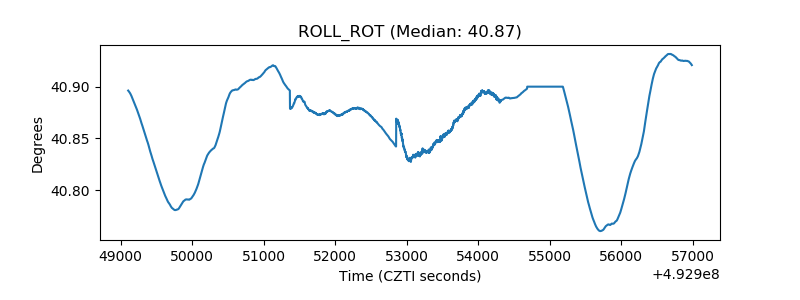 |
| _Roll_DEC | 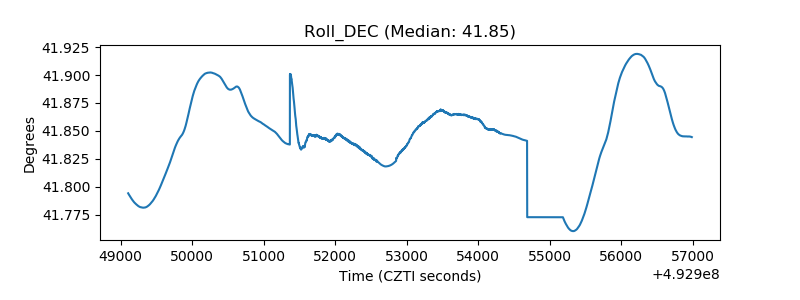 |
| _Roll_RA | 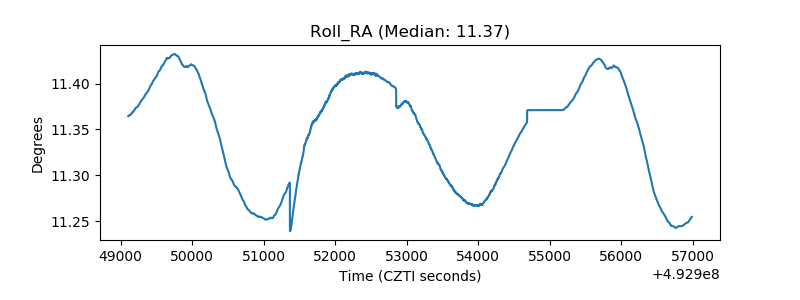 |
| Veto Counter | 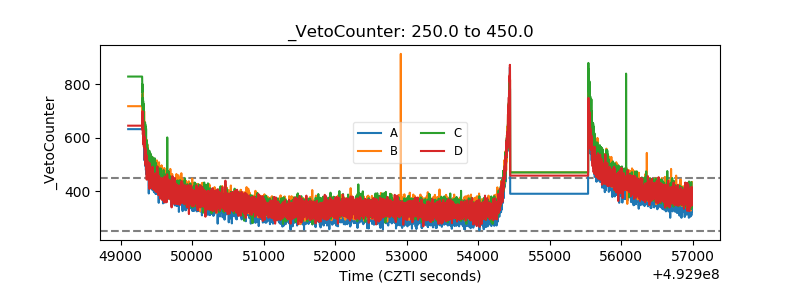 |