| Param | Original file | Final file |
|---|---|---|
| Filename | modeM0/AS1A14_002T06_9000006496_53455cztM0_level2.fits | modeM0/AS1A14_002T06_9000006496_53455cztM0_level2_quad_clean.evt |
| Size (bytes) | 699,010,560 | 94,147,200 |
| Size | 666.6 MB | 89.8 MB |
| Events in quadrant A | 5,200,303 | 662,683 |
| Events in quadrant B | 4,492,563 | 744,501 |
| Events in quadrant C | 10,712,634 | 399,782 |
| Events in quadrant D | 4,953,333 | 579,241 |
| Mode M9 | |||
|---|---|---|---|
| Quadrant | BADHDUFLAG | Total packets | Discarded packets |
| A | 0 | 14 | 0 |
| B | 0 | 15 | 0 |
| C | 0 | 15 | 0 |
| D | 0 | 15 | 0 |
| Mode SS | |||
|---|---|---|---|
| Quadrant | BADHDUFLAG | Total packets | Discarded packets |
| A | 0 | 136 | 0 |
| B | 0 | 136 | 0 |
| C | 0 | 136 | 0 |
| D | 0 | 136 | 0 |
| Mode M0 | |||
|---|---|---|---|
| Quadrant | BADHDUFLAG | Total packets | Discarded packets |
| A | 0 | 20006 | 2 |
| B | 0 | 17795 | 2 |
| C | 0 | 36284 | 2 |
| D | 0 | 19162 | 2 |
| Quadrant | Total seconds | Saturated seconds | Saturation percentage |
|---|---|---|---|
| A | 6661 | 588 | 8.827503% |
| B | 6661 | 334 | 5.014262% |
| C | 6661 | 2894 | 43.446930% |
| D | 6661 | 514 | 7.716559% |
Noise dominated data is calculated using 1-second bins in cleaned event files. If a bin has >2000 counts, and if more than 50% of those come from <1% of pixels, then it is considered to be noise-dominated and hence unusable.
| Quadrant | # 1 sec bins | Bins with >0 counts | Bins with >2000 counts | High rate bins dominated by noise | Noise dominated (total time) | Noise dominated (detector-on time) | Marked lightcurve |
|---|---|---|---|---|---|---|---|
| A | 7781 | 6662 | 372 | 372 | 4.78% | 5.58% | 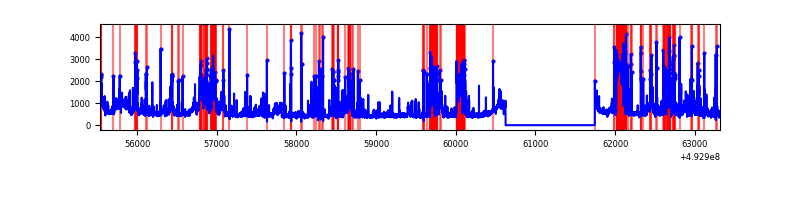 |
| B | 7781 | 6661 | 72 | 72 | 0.93% | 1.08% | 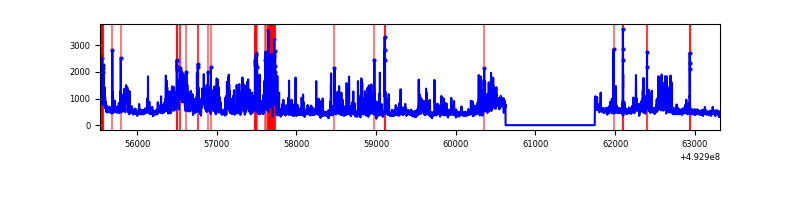 |
| C | 7781 | 6661 | 2558 | 2558 | 32.87% | 38.40% | 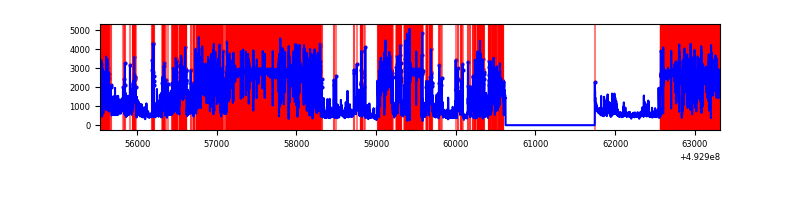 |
| D | 7781 | 6662 | 395 | 395 | 5.08% | 5.93% | 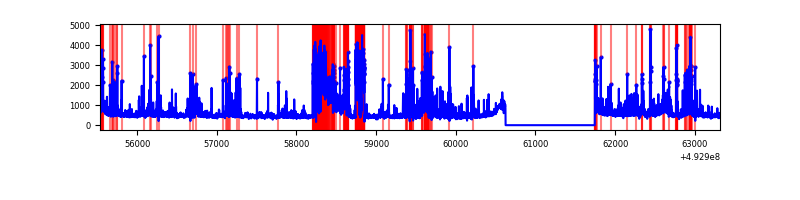 |
Top three noisy pixels from each quadrant. If the there are fewer than three noisy pixels in the level2.evt file, extra rows are filled as -1
| Pixel properties | Quadrant properties | ||||||
|---|---|---|---|---|---|---|---|
| Quadrant | DetID | PixID | Counts | Sigma | Mean | Median | Sigma |
| A | 15 | 174 | 1475774 | 7909.57 | 764 | 748 | 186.5 |
| A | 3 | 63 | 512950 | 2746.59 | 764 | 748 | 186.5 |
| A | 12 | 115 | 133279 | 710.67 | 764 | 748 | 186.5 |
| B | 4 | 171 | 755261 | 4592.97 | 767 | 741 | 164.3 |
| B | 8 | 234 | 337298 | 2048.71 | 767 | 741 | 164.3 |
| B | 4 | 206 | 111592 | 674.78 | 767 | 741 | 164.3 |
| C | 1 | 241 | 6548887 | 41600.38 | 573 | 569 | 157.4 |
| C | 15 | 178 | 871838 | 5535.03 | 573 | 569 | 157.4 |
| C | 15 | 224 | 524020 | 3325.4 | 573 | 569 | 157.4 |
| D | 3 | 12 | 1238081 | 5920.35 | 738 | 706 | 209.0 |
| D | 8 | 176 | 243595 | 1162.13 | 738 | 706 | 209.0 |
| D | 13 | 153 | 113585 | 540.08 | 738 | 706 | 209.0 |
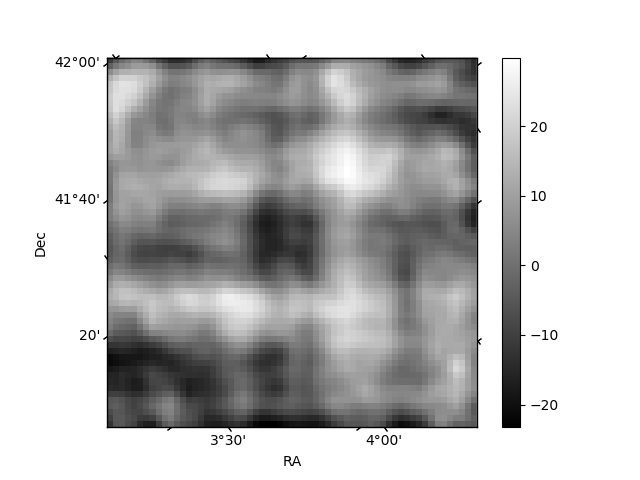
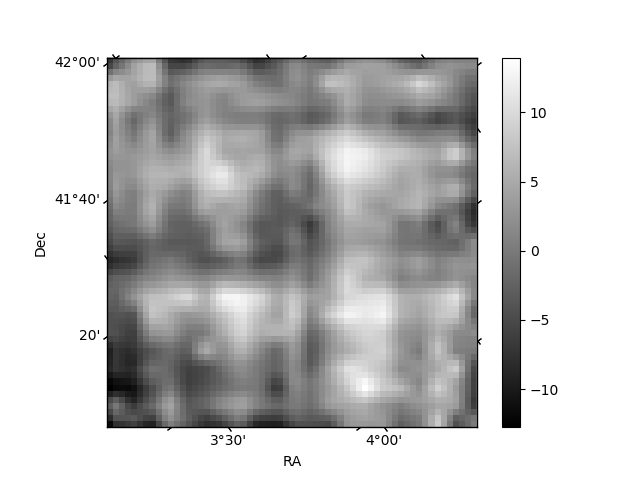
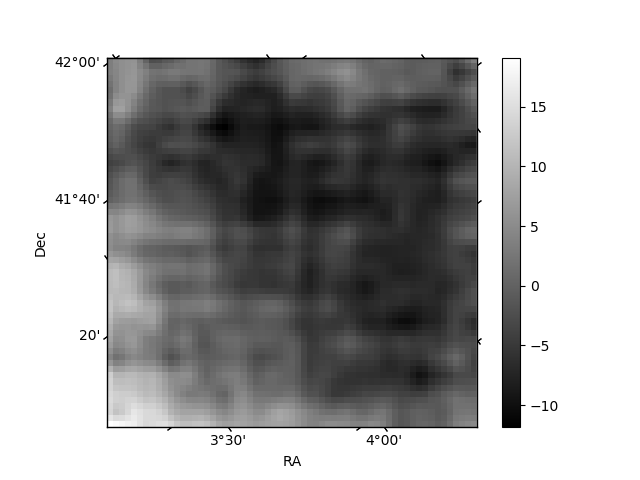
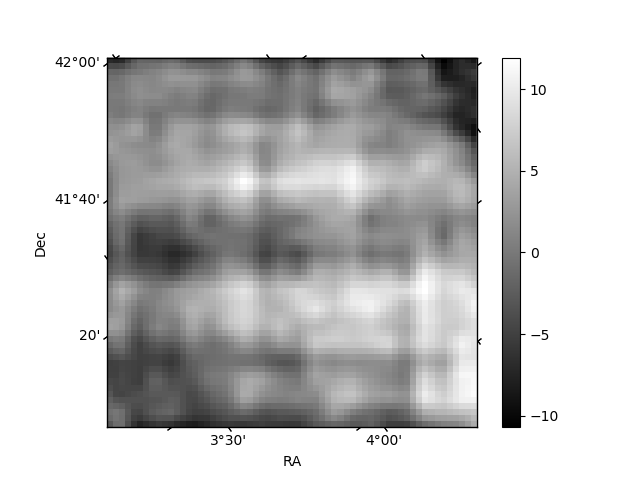
Histogram calculated using DETX and DETY for each event in the final _common_clean file
| Quadrant A | 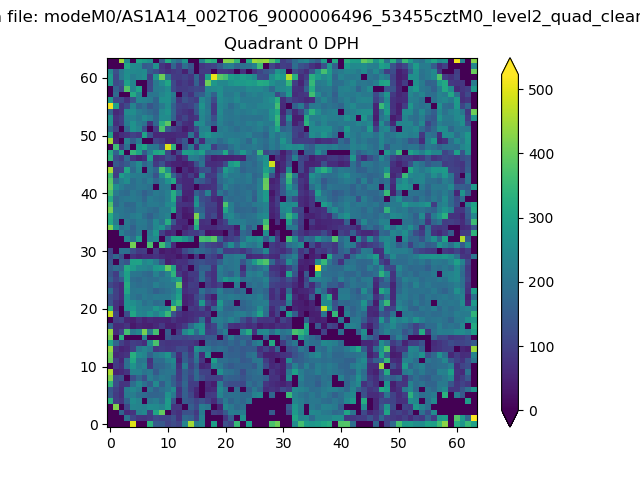 |
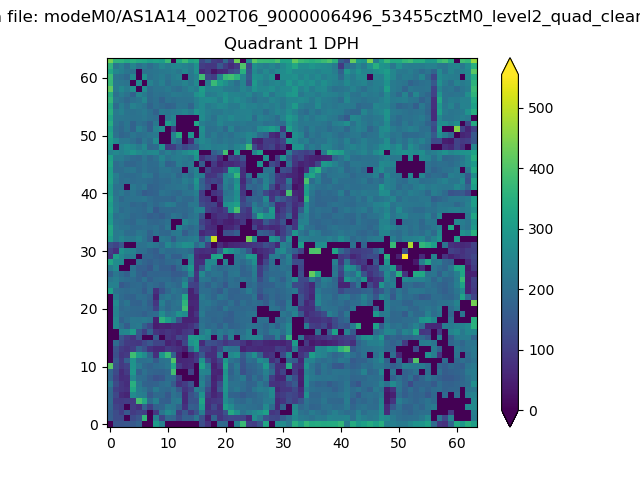 |
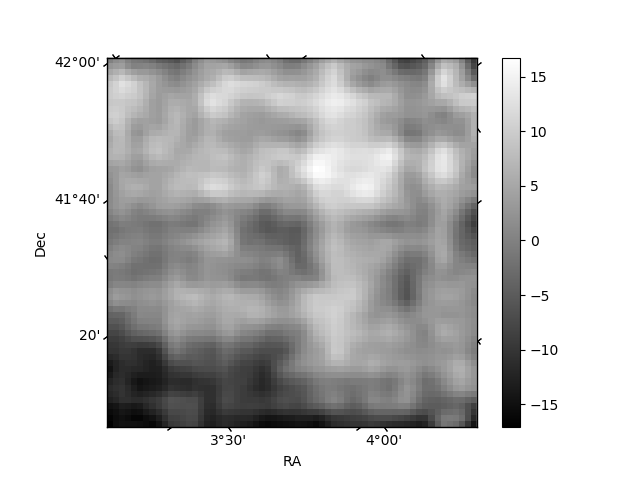
Quadrant B |
|---|---|---|---|
| Quadrant D | 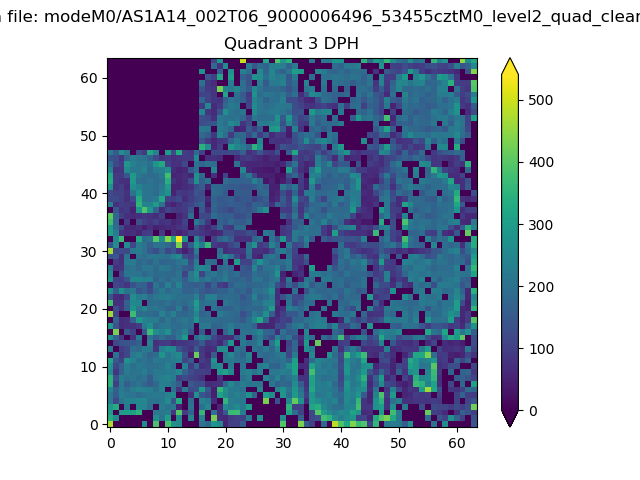 |
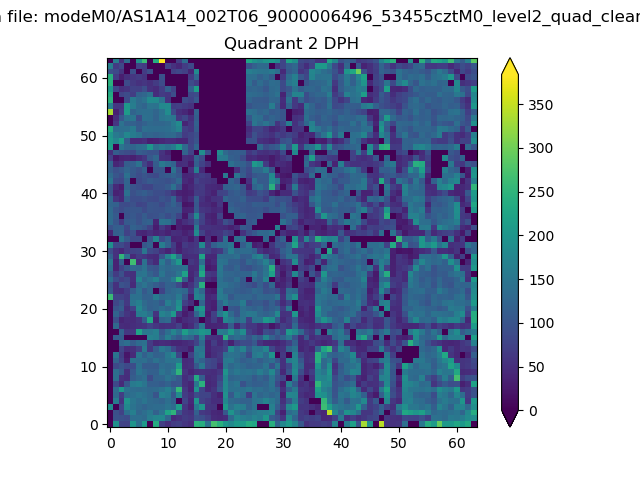 |
Quadrant C |
| Plot type | Count rate plots | Images |
|---|---|---|
| Comparison with Poisson distribution Blue bars denote a histogram of data divided into 1 sec bins. Red curve is a Poisson curve with rate = median count rate of data. |
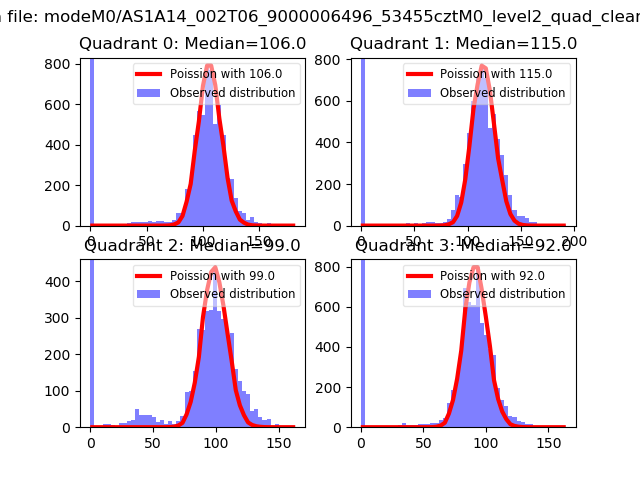 |
 |
| Quadrant-wise count rates Data is divided into 100 sec bins |
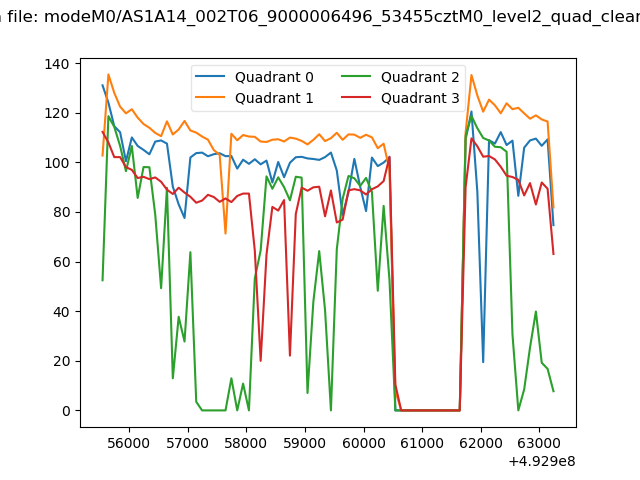 |
|
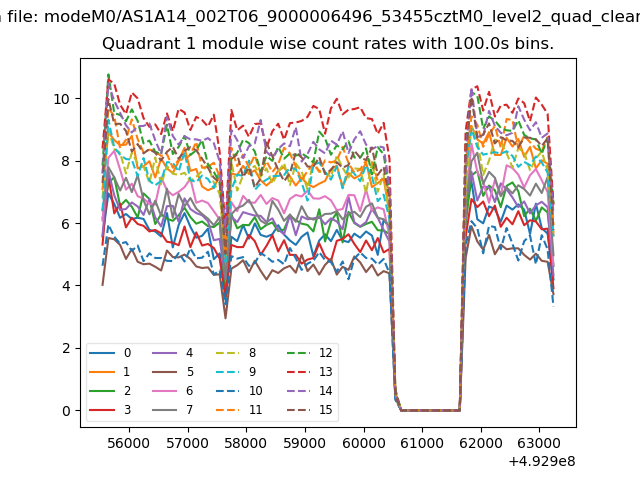
| Module-wise count rates for Quadrant A Data is divided into 100 sec bins |
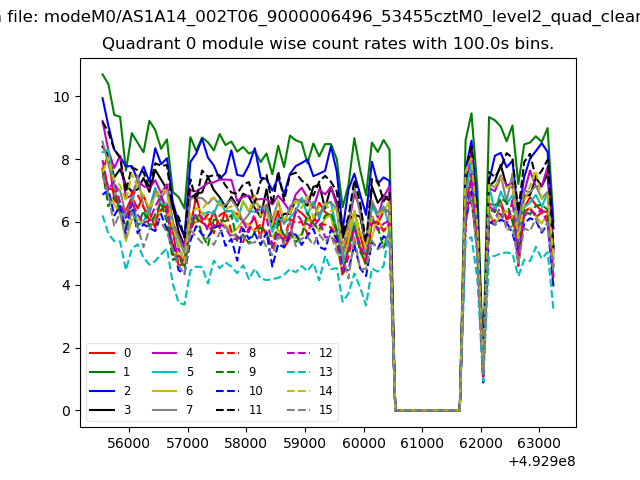 |
 |
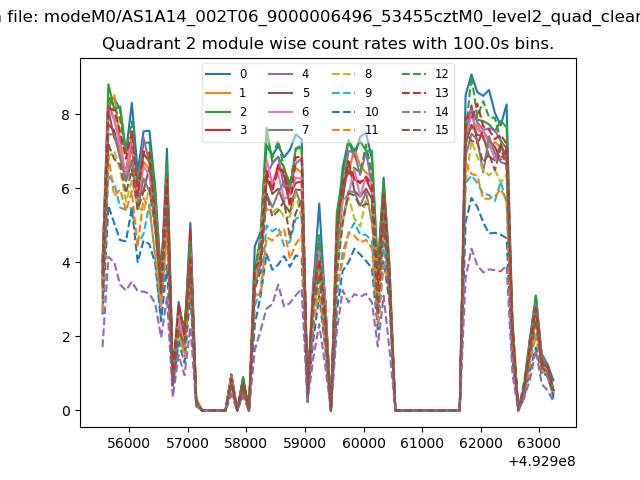
| Module-wise count rates for Quadrant B Data is divided into 100 sec bins |
 |
 |
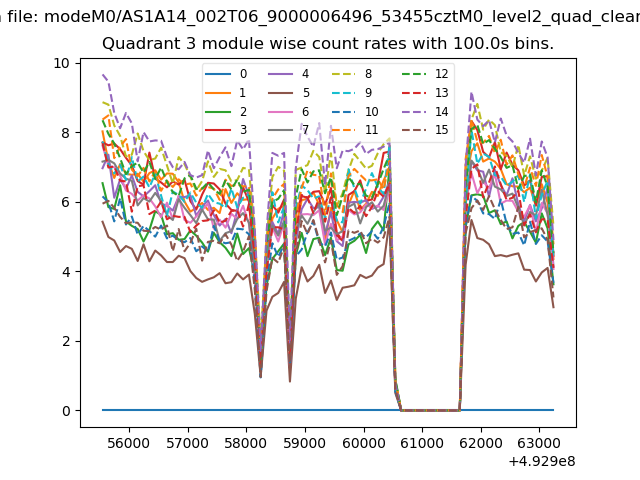
| Module-wise count rates for Quadrant C Data is divided into 100 sec bins |
 |
 |
| Module-wise count rates for Quadrant D Data is divided into 100 sec bins |
 |
 |
| Parameter | Plot |
|---|---|
| CZT HV Monitor | 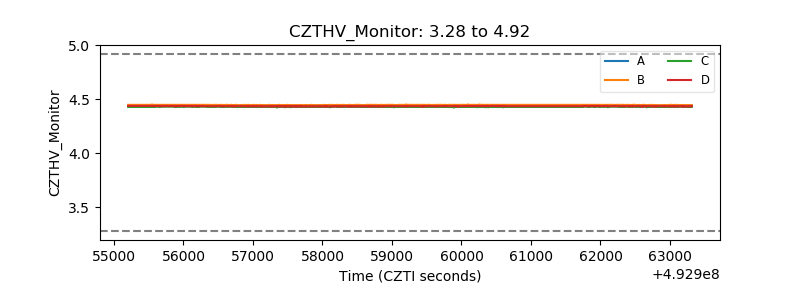 |
| D_VDD | 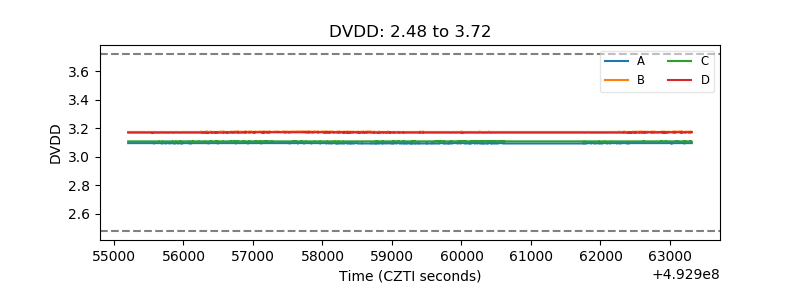 |
| Temperature 1 | 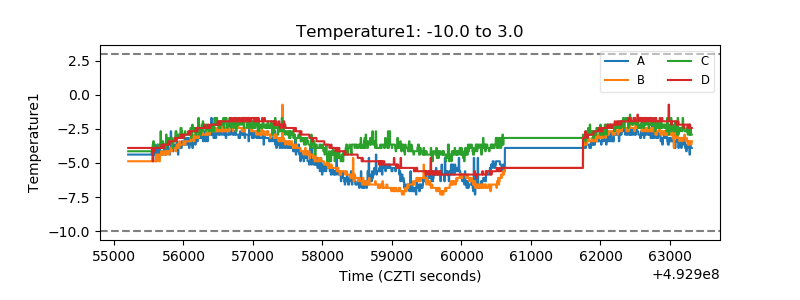 |
| Veto HV Monitor | 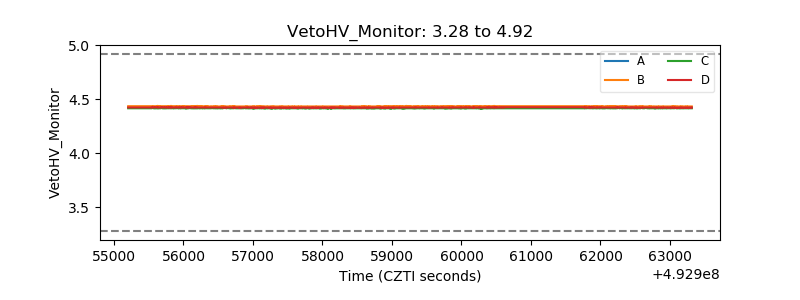 |
| Veto LLD | 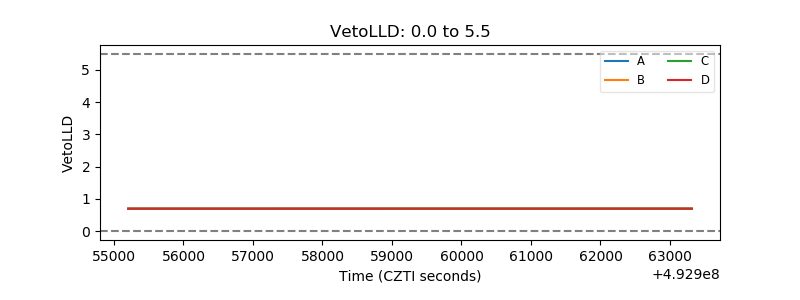 |
| Alpha Counter | 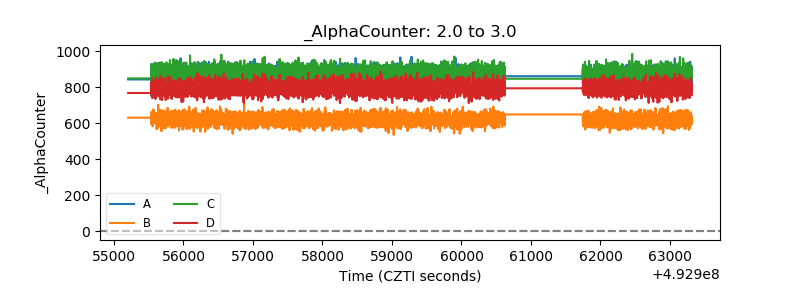 |
| _CPM_Rate | 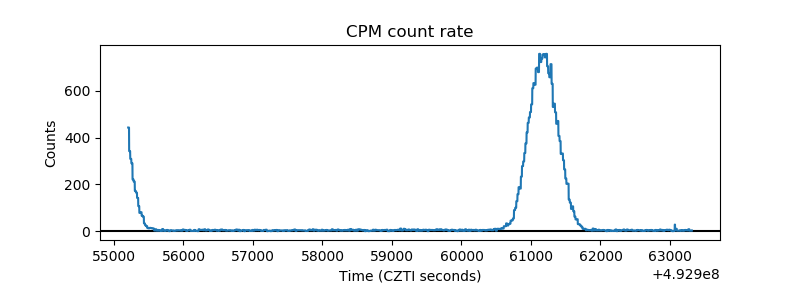 |
| CZT Counter | 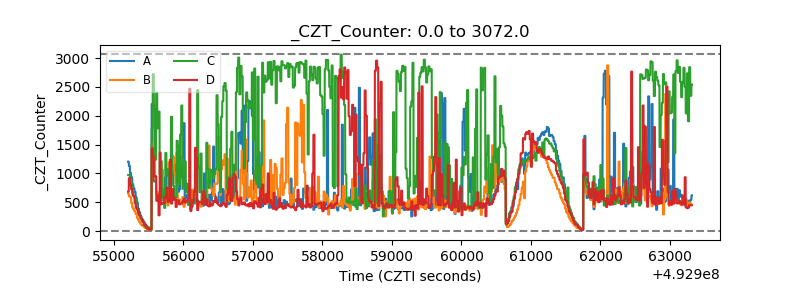 |
| +2.5 Volts monitor | 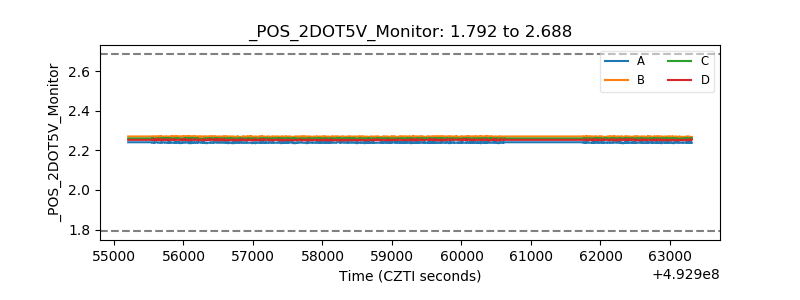 |
| +5 Volts monitor |  |
| _ROLL_ROT | 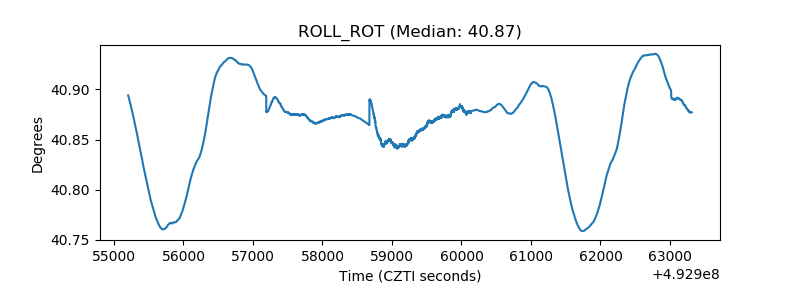 |
| _Roll_DEC | 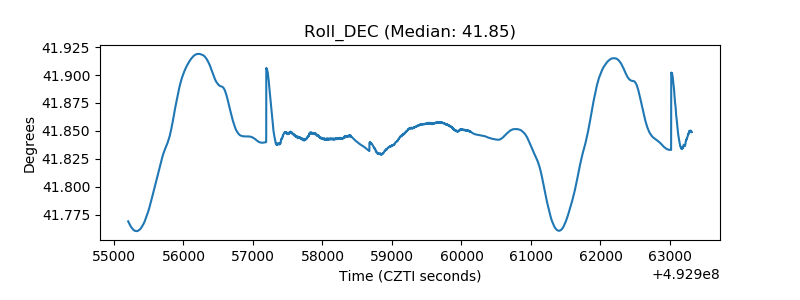 |
| _Roll_RA | 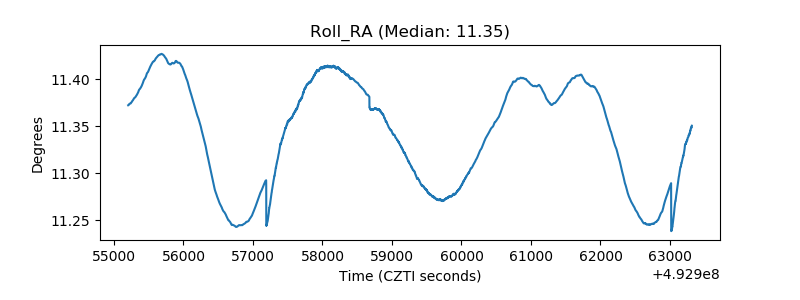 |
| Veto Counter | 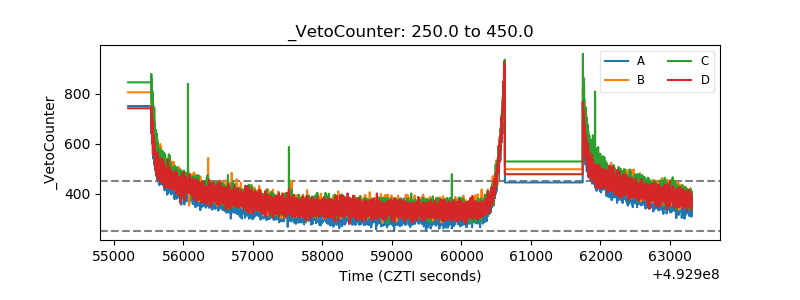 |