| Param | Original file | Final file |
|---|---|---|
| Filename | modeM0/AS1A14_002T06_9000006496_53456cztM0_level2.fits | modeM0/AS1A14_002T06_9000006496_53456cztM0_level2_quad_clean.evt |
| Size (bytes) | 790,395,840 | 84,015,360 |
| Size | 753.8 MB | 80.1 MB |
| Events in quadrant A | 5,127,826 | 646,117 |
| Events in quadrant B | 3,961,126 | 735,252 |
| Events in quadrant C | 15,404,840 | 123,902 |
| Events in quadrant D | 4,261,730 | 587,446 |
| Mode M9 | |||
|---|---|---|---|
| Quadrant | BADHDUFLAG | Total packets | Discarded packets |
| A | 0 | 16 | 0 |
| B | 0 | 17 | 0 |
| C | 0 | 17 | 0 |
| D | 0 | 17 | 0 |
| Mode SS | |||
|---|---|---|---|
| Quadrant | BADHDUFLAG | Total packets | Discarded packets |
| A | 0 | 130 | 0 |
| B | 0 | 130 | 0 |
| C | 0 | 130 | 0 |
| D | 0 | 130 | 0 |
| Mode M0 | |||
|---|---|---|---|
| Quadrant | BADHDUFLAG | Total packets | Discarded packets |
| A | 0 | 19644 | 2 |
| B | 0 | 16112 | 2 |
| C | 0 | 49994 | 3 |
| D | 0 | 17083 | 2 |
| Quadrant | Total seconds | Saturated seconds | Saturation percentage |
|---|---|---|---|
| A | 6474 | 587 | 9.067037% |
| B | 6474 | 233 | 3.599011% |
| C | 6473 | 5393 | 83.315310% |
| D | 6473 | 294 | 4.541943% |
Noise dominated data is calculated using 1-second bins in cleaned event files. If a bin has >2000 counts, and if more than 50% of those come from <1% of pixels, then it is considered to be noise-dominated and hence unusable.
| Quadrant | # 1 sec bins | Bins with >0 counts | Bins with >2000 counts | High rate bins dominated by noise | Noise dominated (total time) | Noise dominated (detector-on time) | Marked lightcurve |
|---|---|---|---|---|---|---|---|
| A | 7634 | 6475 | 394 | 394 | 5.16% | 6.08% | 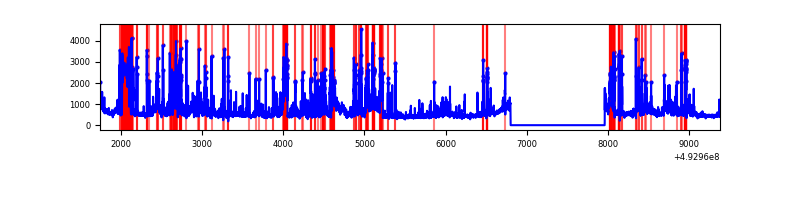 |
| B | 7634 | 6475 | 38 | 38 | 0.50% | 0.59% | 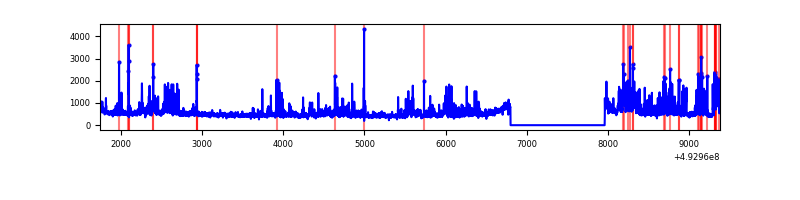 |
| C | 7632 | 6472 | 5150 | 5150 | 67.48% | 79.57% | 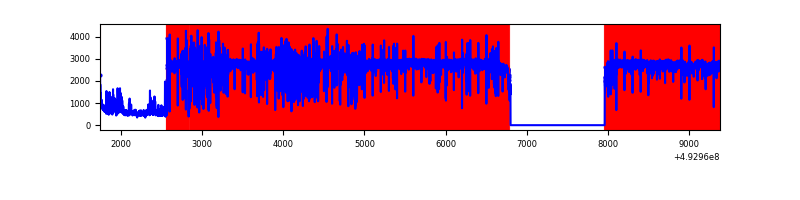 |
| D | 7633 | 6474 | 169 | 169 | 2.21% | 2.61% | 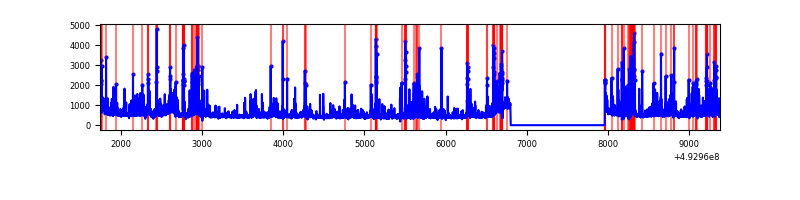 |
Top three noisy pixels from each quadrant. If the there are fewer than three noisy pixels in the level2.evt file, extra rows are filled as -1
| Pixel properties | Quadrant properties | ||||||
|---|---|---|---|---|---|---|---|
| Quadrant | DetID | PixID | Counts | Sigma | Mean | Median | Sigma |
| A | 15 | 174 | 1570766 | 8702.25 | 735 | 717 | 180.4 |
| A | 3 | 63 | 578167 | 3200.61 | 735 | 717 | 180.4 |
| A | 4 | 249 | 33593 | 182.22 | 735 | 717 | 180.4 |
| B | 4 | 171 | 529893 | 3344.76 | 749 | 724 | 158.2 |
| B | 0 | 213 | 152472 | 959.17 | 749 | 724 | 158.2 |
| B | 8 | 234 | 141636 | 890.67 | 749 | 724 | 158.2 |
| C | 1 | 241 | 10647240 | 118357.32 | 327 | 323 | 90.0 |
| C | 15 | 178 | 3067316 | 34094.48 | 327 | 323 | 90.0 |
| C | 15 | 224 | 256959 | 2852.91 | 327 | 323 | 90.0 |
| D | 8 | 176 | 443412 | 2184.95 | 721 | 687 | 202.6 |
| D | 3 | 12 | 436980 | 2153.2 | 721 | 687 | 202.6 |
| D | 3 | 224 | 126747 | 622.13 | 721 | 687 | 202.6 |
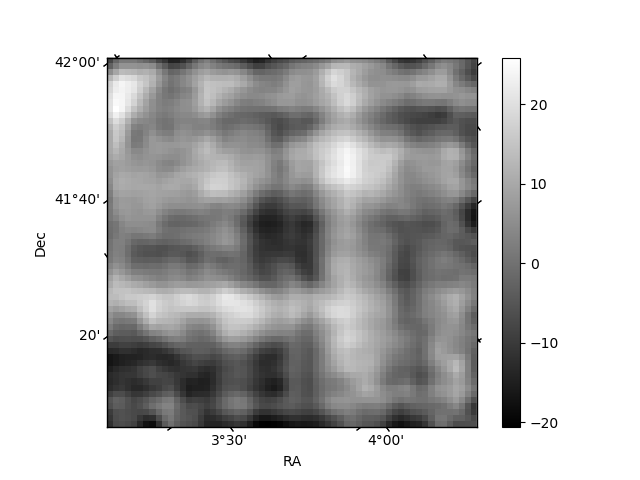
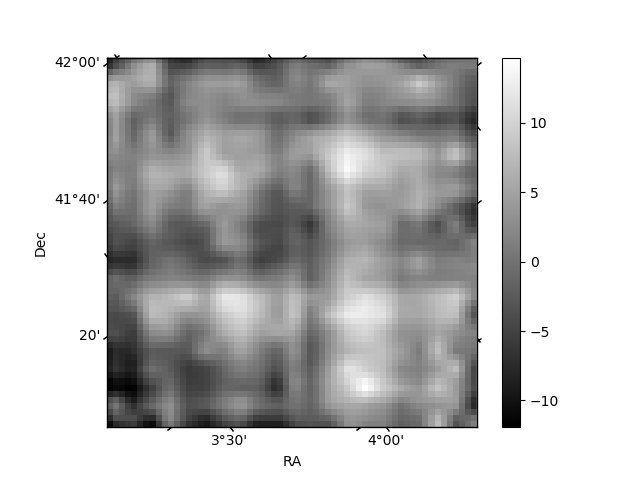
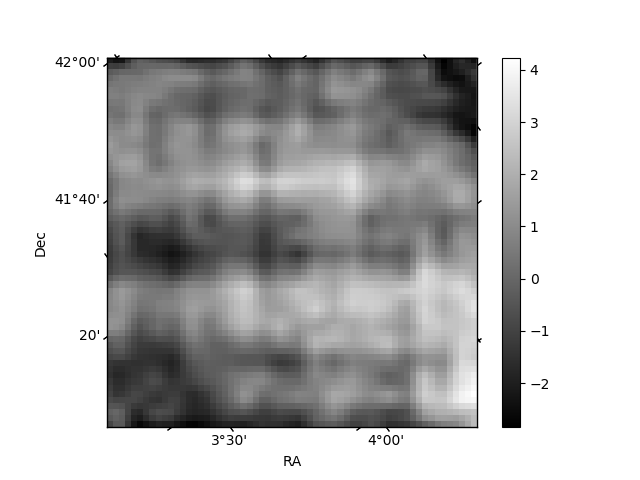
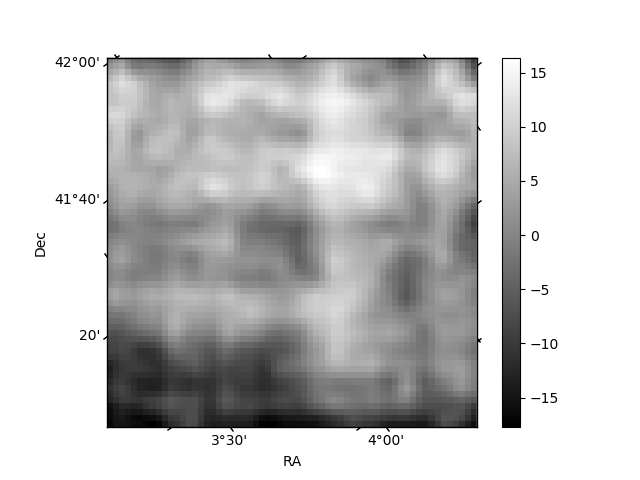
Histogram calculated using DETX and DETY for each event in the final _common_clean file
| Quadrant A | 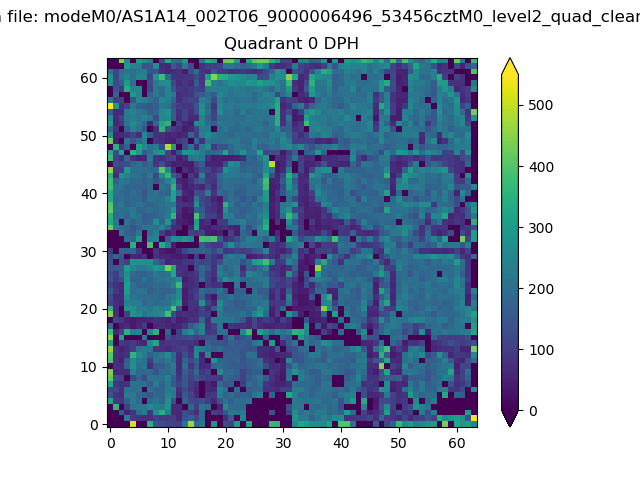 |
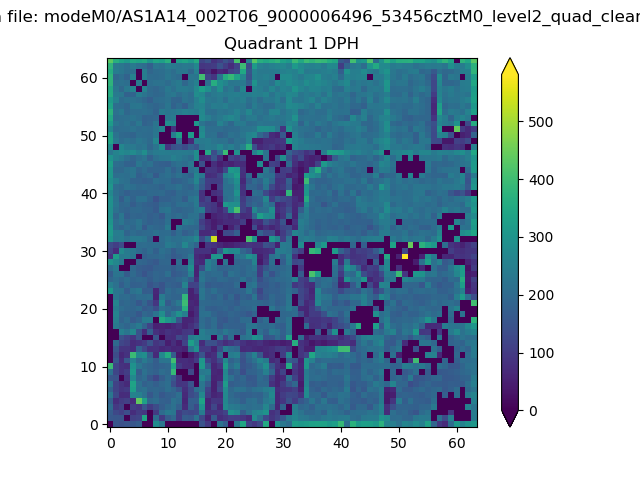 |
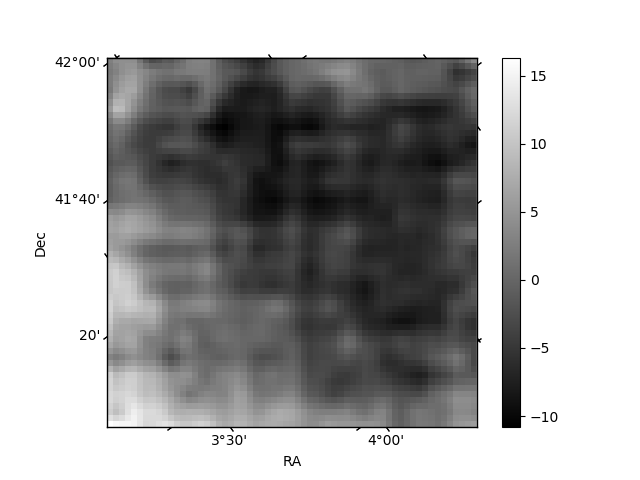
Quadrant B |
|---|---|---|---|
| Quadrant D | 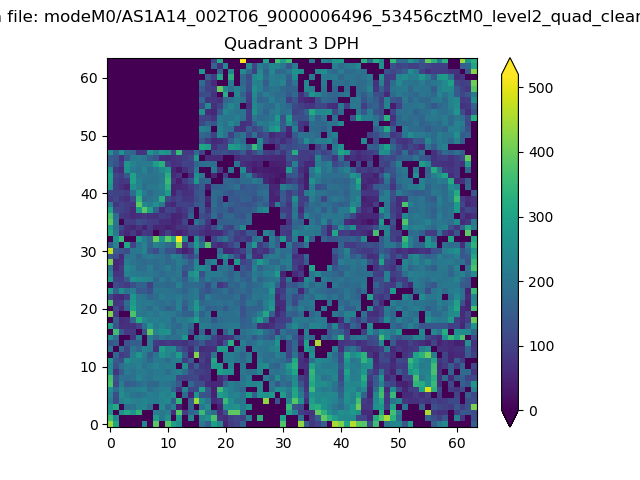 |
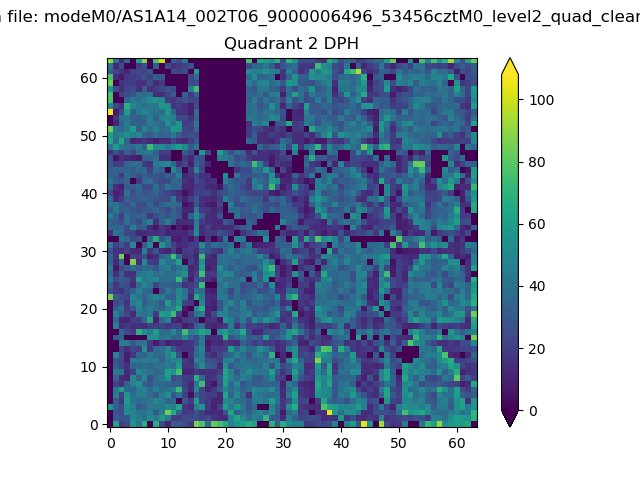 |
Quadrant C |
| Plot type | Count rate plots | Images |
|---|---|---|
| Comparison with Poisson distribution Blue bars denote a histogram of data divided into 1 sec bins. Red curve is a Poisson curve with rate = median count rate of data. |
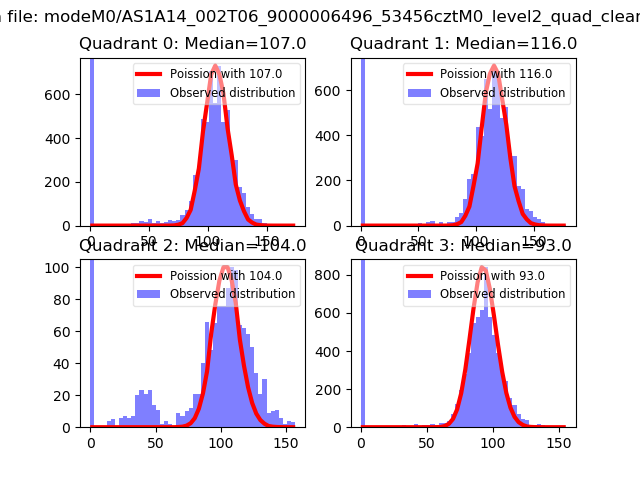 |
 |
| Quadrant-wise count rates Data is divided into 100 sec bins |
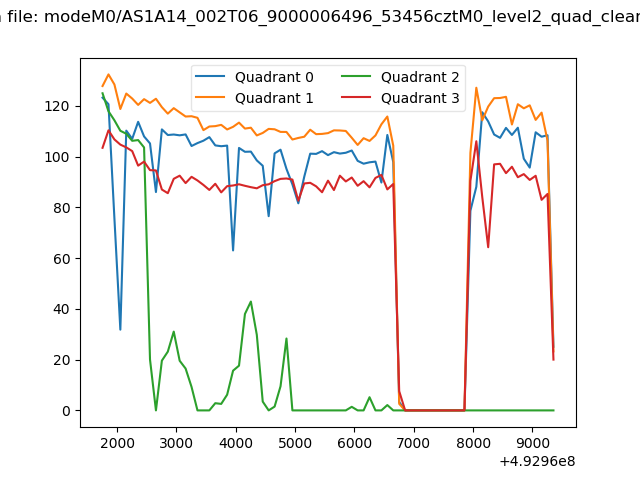 |
|
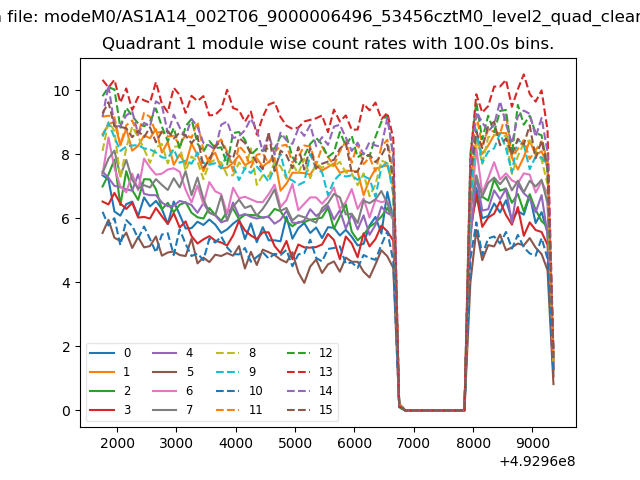
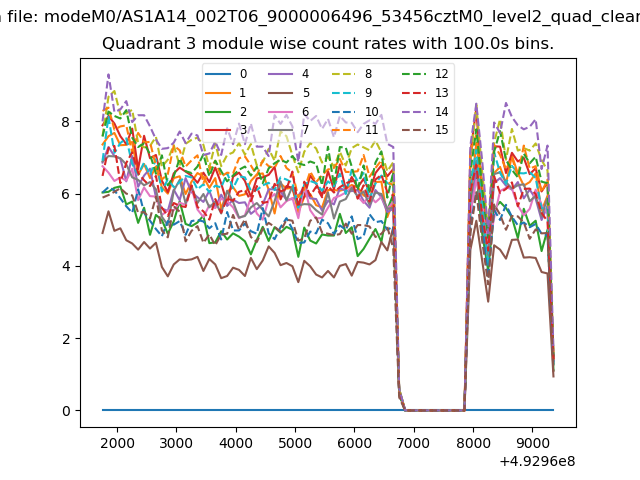
| Module-wise count rates for Quadrant A Data is divided into 100 sec bins |
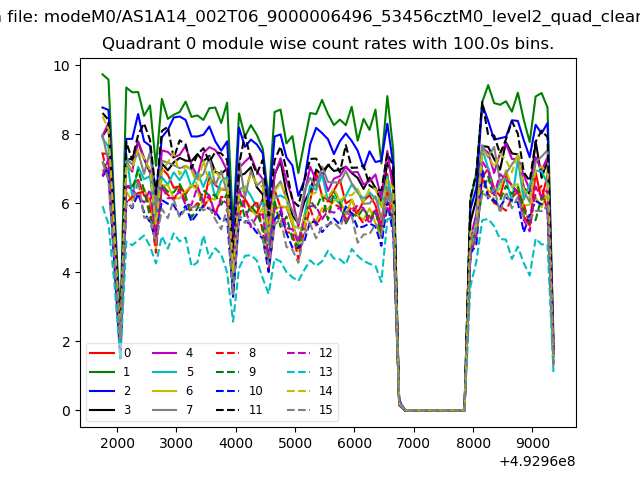 |
 |
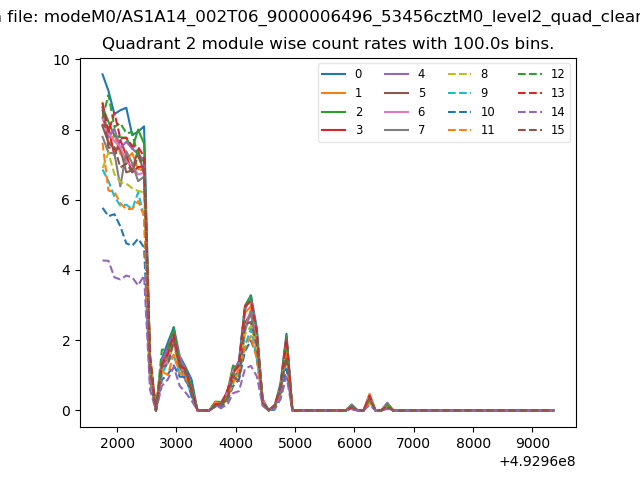
| Module-wise count rates for Quadrant B Data is divided into 100 sec bins |
 |
 |
| Module-wise count rates for Quadrant C Data is divided into 100 sec bins |
 |
 |
| Module-wise count rates for Quadrant D Data is divided into 100 sec bins |
 |
 |
| Parameter | Plot |
|---|---|
| CZT HV Monitor |  |
| D_VDD | 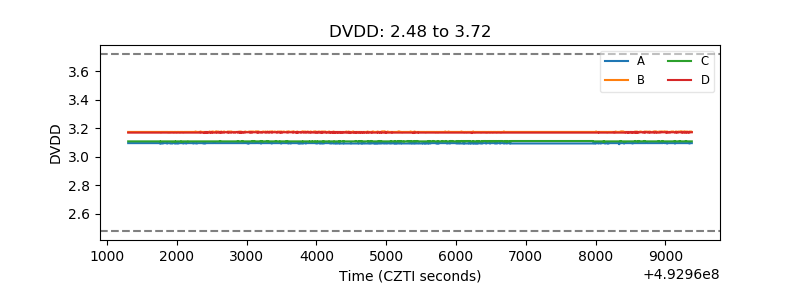 |
| Temperature 1 | 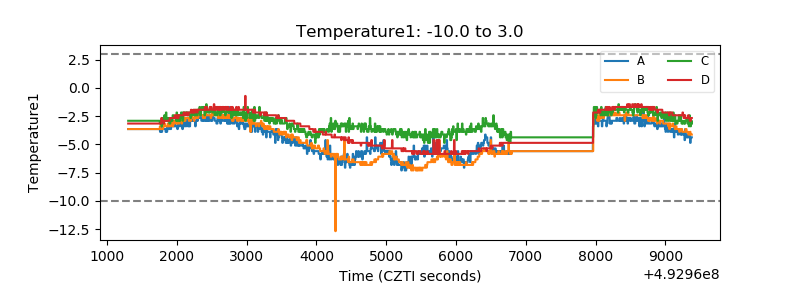 |
| Veto HV Monitor | 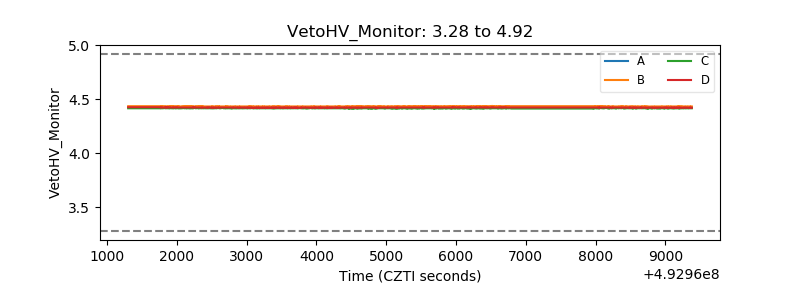 |
| Veto LLD | 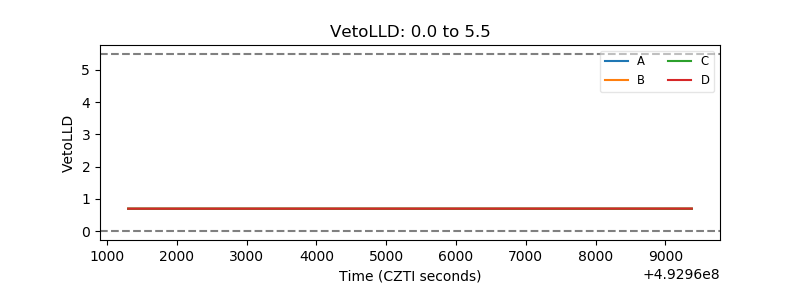 |
| Alpha Counter | 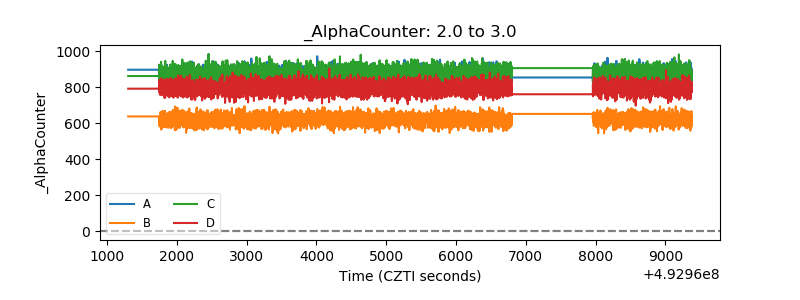 |
| _CPM_Rate | 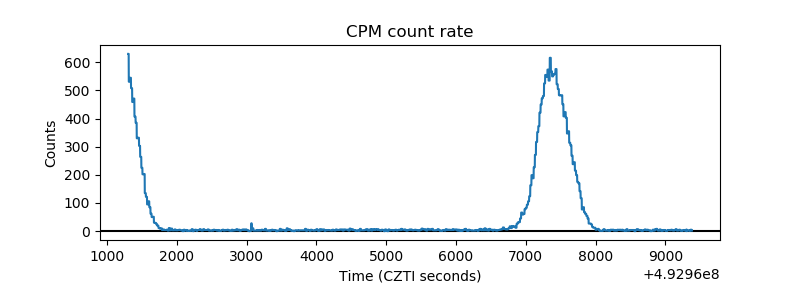 |
| CZT Counter | 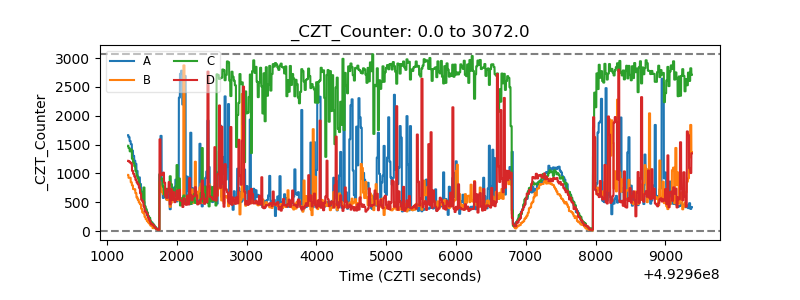 |
| +2.5 Volts monitor | 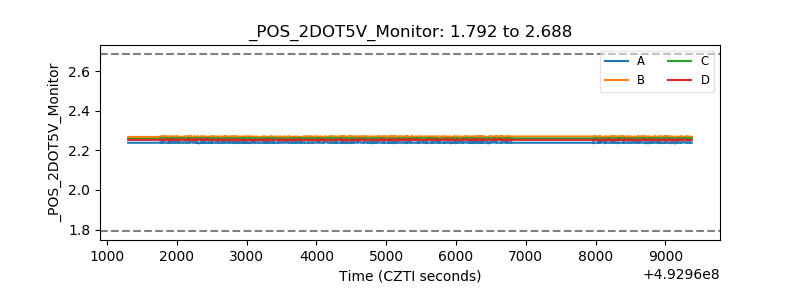 |
| +5 Volts monitor | 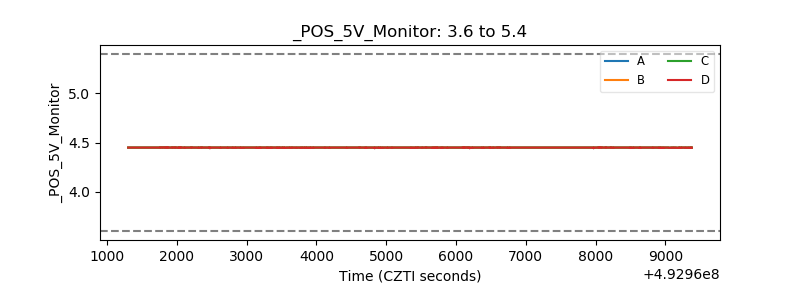 |
| _ROLL_ROT | 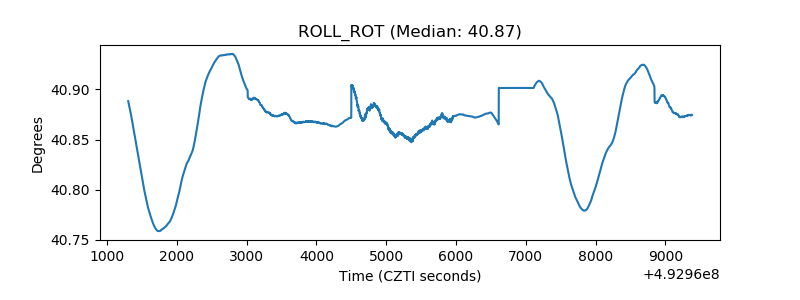 |
| _Roll_DEC | 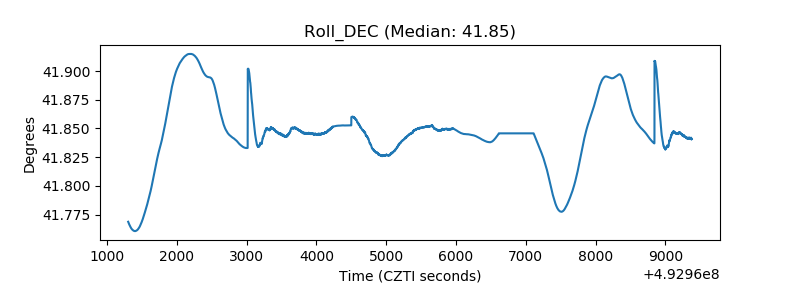 |
| _Roll_RA | 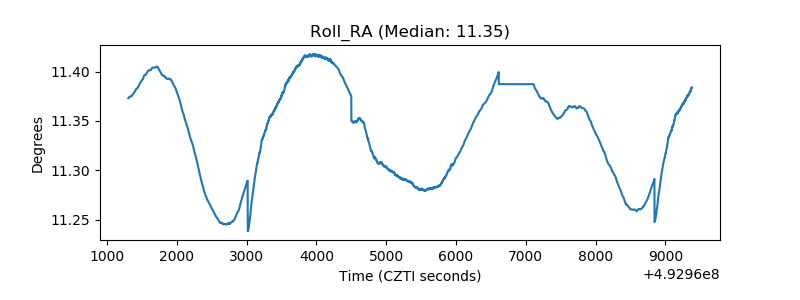 |
| Veto Counter | 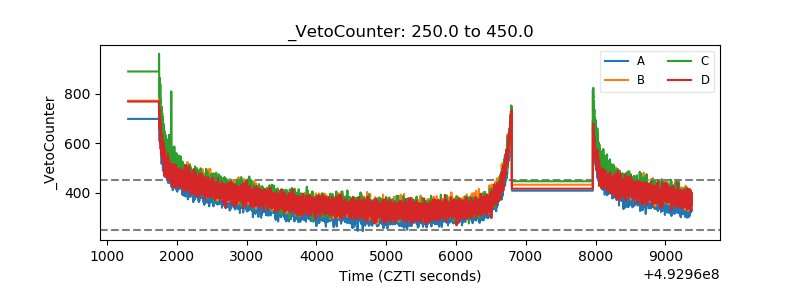 |