| Param | Original file | Final file |
|---|---|---|
| Filename | modeM0/AS1A14_002T06_9000006496_53457cztM0_level2.fits | modeM0/AS1A14_002T06_9000006496_53457cztM0_level2_quad_clean.evt |
| Size (bytes) | 835,770,240 | 79,482,240 |
| Size | 797.1 MB | 75.8 MB |
| Events in quadrant A | 4,985,806 | 625,549 |
| Events in quadrant B | 3,850,546 | 726,223 |
| Events in quadrant C | 17,572,101 | 15,669 |
| Events in quadrant D | 4,019,656 | 581,574 |
| Mode M9 | |||
|---|---|---|---|
| Quadrant | BADHDUFLAG | Total packets | Discarded packets |
| A | 0 | 18 | 0 |
| B | 0 | 19 | 0 |
| C | 0 | 19 | 0 |
| D | 0 | 19 | 0 |
| Mode SS | |||
|---|---|---|---|
| Quadrant | BADHDUFLAG | Total packets | Discarded packets |
| A | 0 | 134 | 0 |
| B | 0 | 134 | 0 |
| C | 0 | 134 | 0 |
| D | 0 | 134 | 0 |
| Mode M0 | |||
|---|---|---|---|
| Quadrant | BADHDUFLAG | Total packets | Discarded packets |
| A | 0 | 19312 | 3 |
| B | 0 | 15965 | 2 |
| C | 0 | 56549 | 2 |
| D | 0 | 16609 | 2 |
| Quadrant | Total seconds | Saturated seconds | Saturation percentage |
|---|---|---|---|
| A | 6562 | 679 | 10.347455% |
| B | 6562 | 219 | 3.337397% |
| C | 6562 | 6420 | 97.836026% |
| D | 6562 | 247 | 3.764096% |
Noise dominated data is calculated using 1-second bins in cleaned event files. If a bin has >2000 counts, and if more than 50% of those come from <1% of pixels, then it is considered to be noise-dominated and hence unusable.
| Quadrant | # 1 sec bins | Bins with >0 counts | Bins with >2000 counts | High rate bins dominated by noise | Noise dominated (total time) | Noise dominated (detector-on time) | Marked lightcurve |
|---|---|---|---|---|---|---|---|
| A | 7672 | 6563 | 438 | 438 | 5.71% | 6.67% | 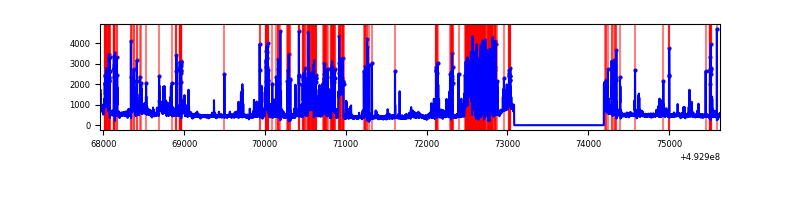 |
| B | 7672 | 6563 | 34 | 34 | 0.44% | 0.52% | 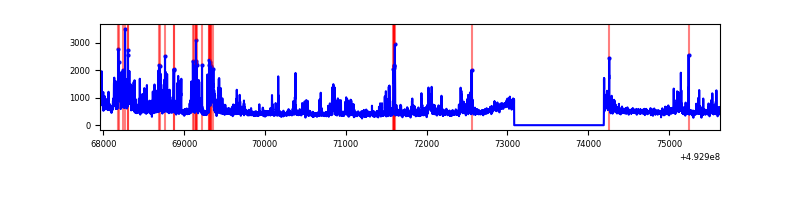 |
| C | 7671 | 6561 | 6273 | 6273 | 81.78% | 95.61% | 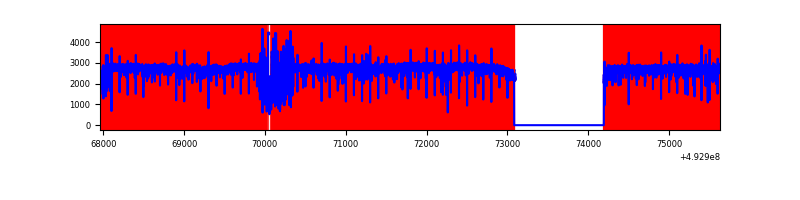 |
| D | 7672 | 6563 | 125 | 125 | 1.63% | 1.90% | 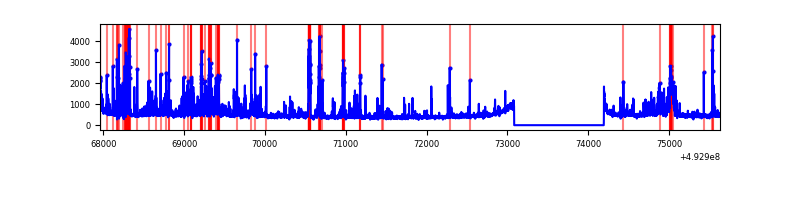 |
Top three noisy pixels from each quadrant. If the there are fewer than three noisy pixels in the level2.evt file, extra rows are filled as -1
| Pixel properties | Quadrant properties | ||||||
|---|---|---|---|---|---|---|---|
| Quadrant | DetID | PixID | Counts | Sigma | Mean | Median | Sigma |
| A | 15 | 174 | 1329644 | 7460.36 | 721 | 702 | 178.1 |
| A | 3 | 63 | 675467 | 3787.97 | 721 | 702 | 178.1 |
| A | 7 | 30 | 72139 | 401.03 | 721 | 702 | 178.1 |
| B | 4 | 171 | 667751 | 4181.29 | 743 | 720 | 159.5 |
| B | 8 | 234 | 79169 | 491.76 | 743 | 720 | 159.5 |
| B | 0 | 213 | 50560 | 312.42 | 743 | 720 | 159.5 |
| C | 1 | 241 | 12729498 | 246381.25 | 186 | 185 | 51.7 |
| C | 15 | 178 | 2678861 | 51846.91 | 186 | 185 | 51.7 |
| C | 15 | 224 | 1079367 | 20888.03 | 186 | 185 | 51.7 |
| D | 3 | 12 | 293433 | 1443.34 | 721 | 687 | 202.8 |
| D | 7 | 70 | 191473 | 940.64 | 721 | 687 | 202.8 |
| D | 3 | 224 | 184957 | 908.51 | 721 | 687 | 202.8 |
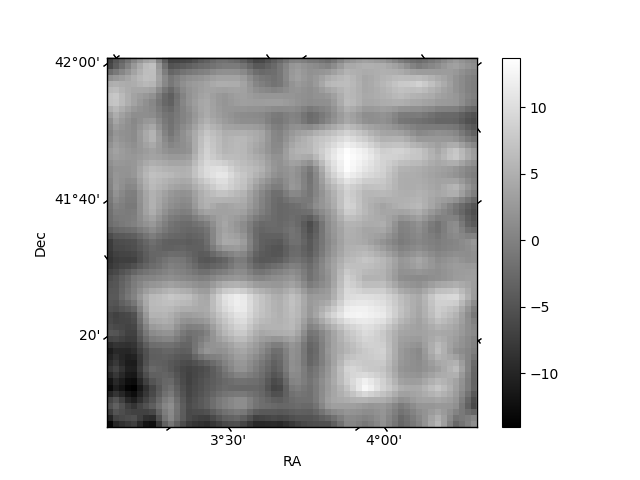
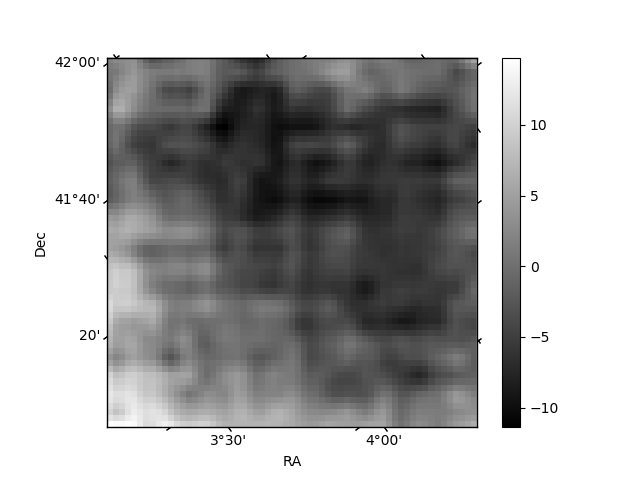
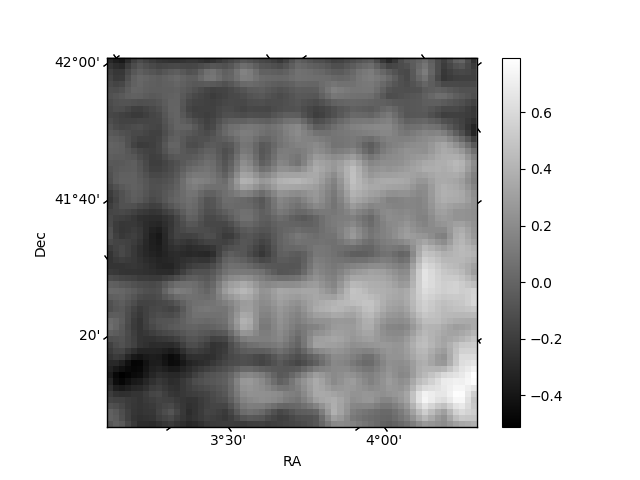
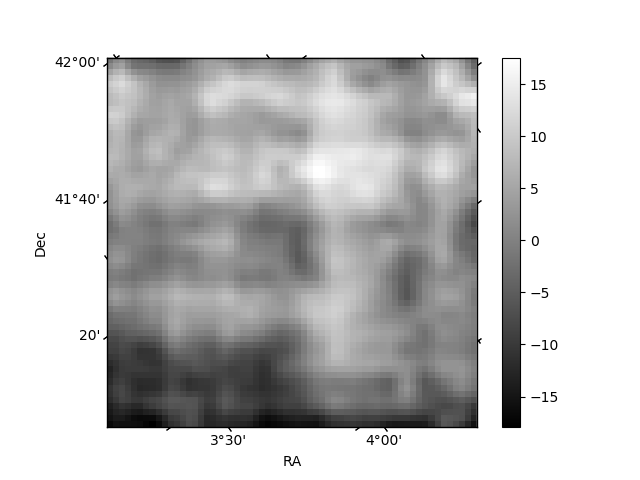
Histogram calculated using DETX and DETY for each event in the final _common_clean file
| Quadrant A | 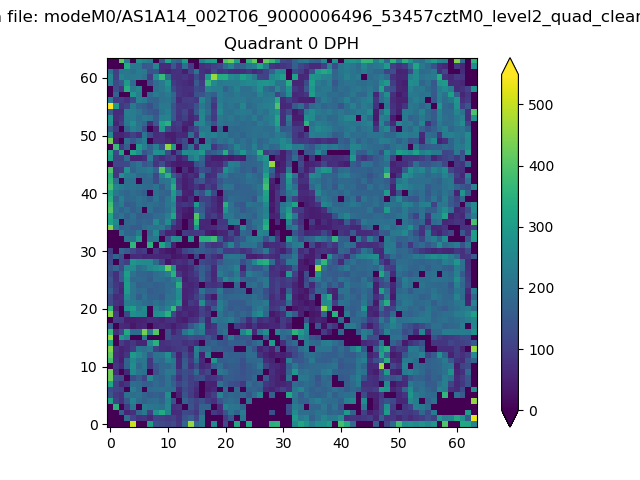 |
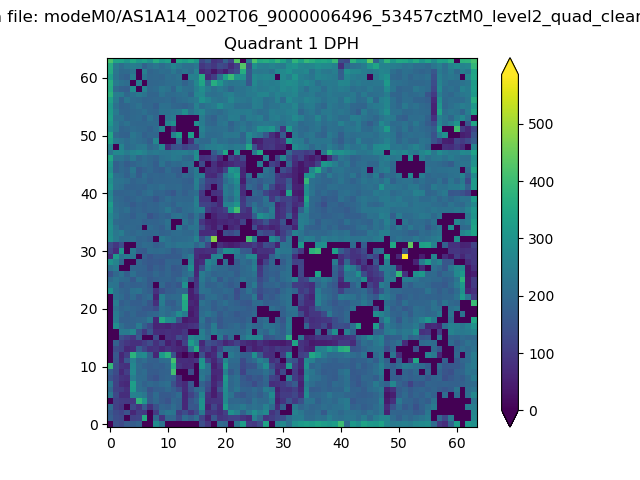 |
Quadrant B |
|---|---|---|---|
| Quadrant D | 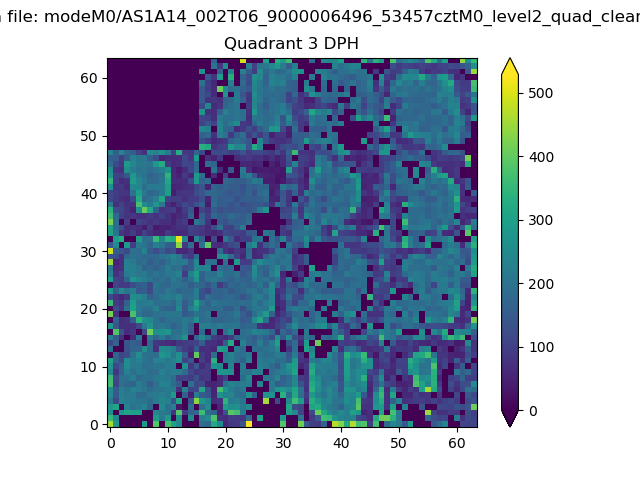 |
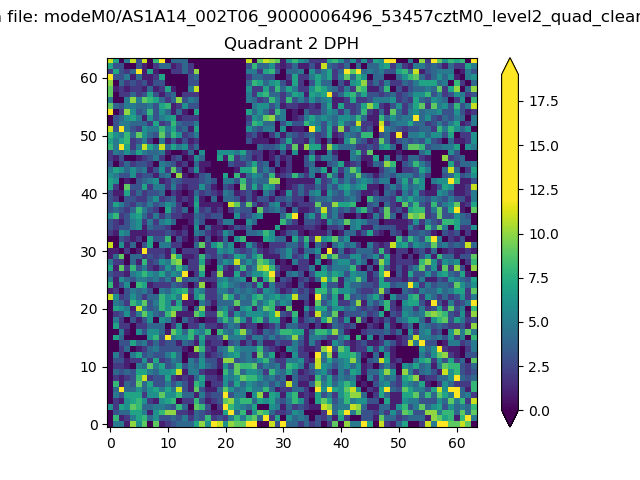 |
Quadrant C |
| Plot type | Count rate plots | Images |
|---|---|---|
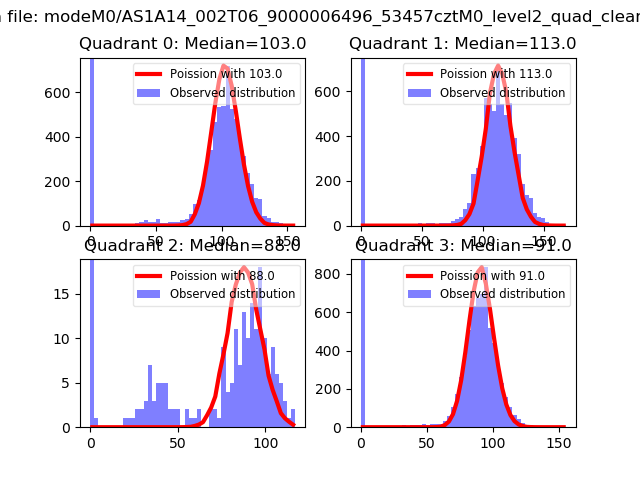
| Comparison with Poisson distribution Blue bars denote a histogram of data divided into 1 sec bins. Red curve is a Poisson curve with rate = median count rate of data. |
 |
 |
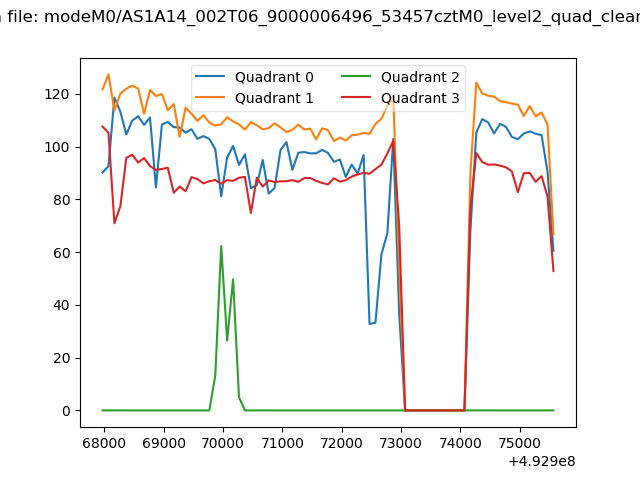
| Quadrant-wise count rates Data is divided into 100 sec bins |
 |
|
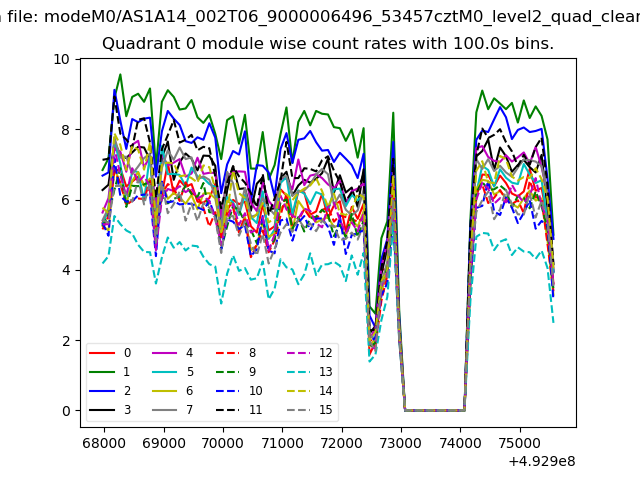
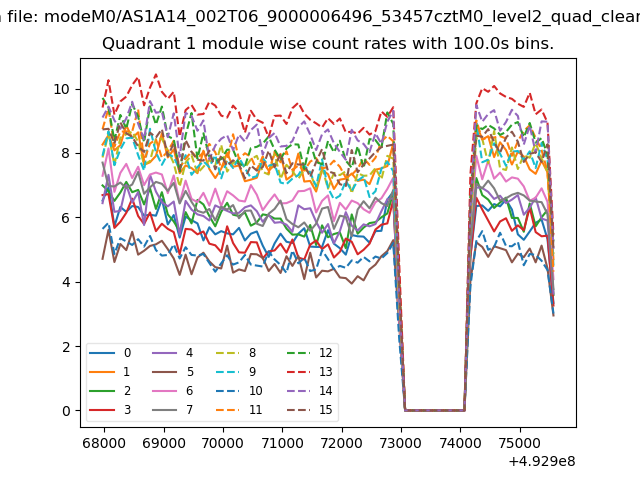
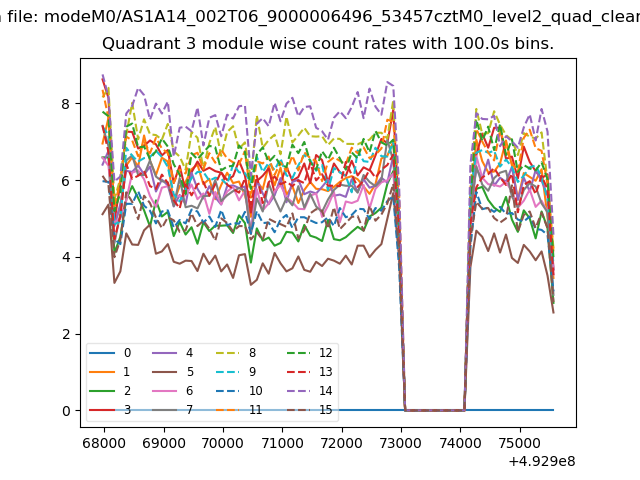
| Module-wise count rates for Quadrant A Data is divided into 100 sec bins |
 |
 |
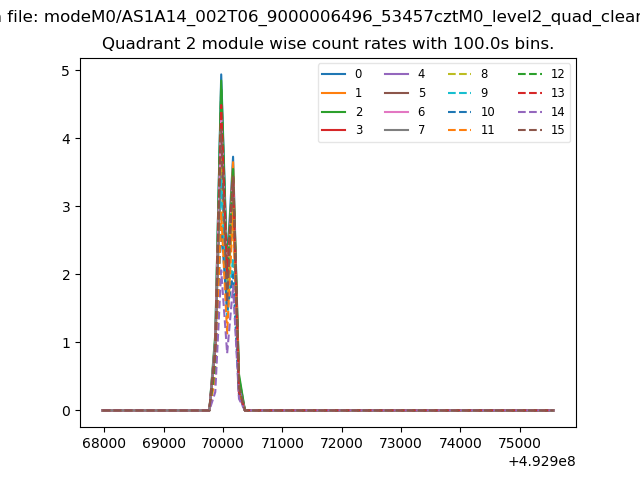
| Module-wise count rates for Quadrant B Data is divided into 100 sec bins |
 |
 |
| Module-wise count rates for Quadrant C Data is divided into 100 sec bins |
 |
 |
| Module-wise count rates for Quadrant D Data is divided into 100 sec bins |
 |
 |
| Parameter | Plot |
|---|---|
| CZT HV Monitor | 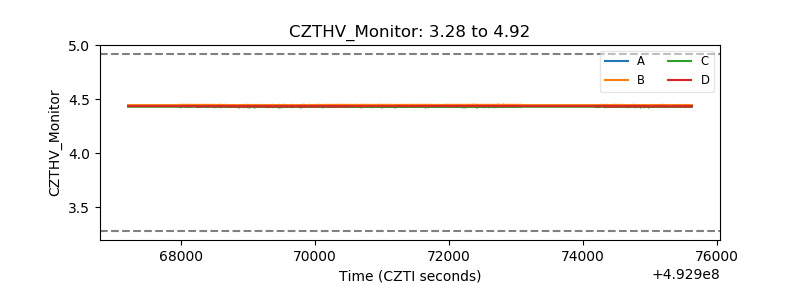 |
| D_VDD | 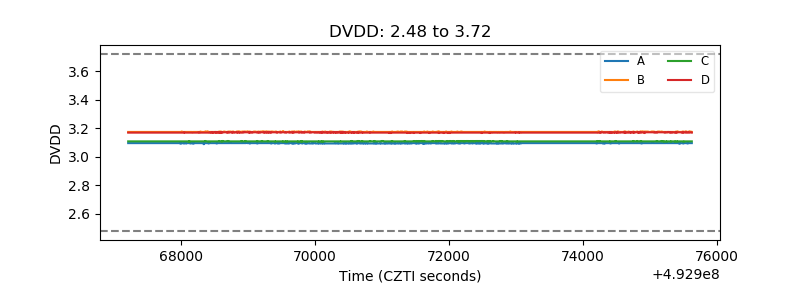 |
| Temperature 1 | 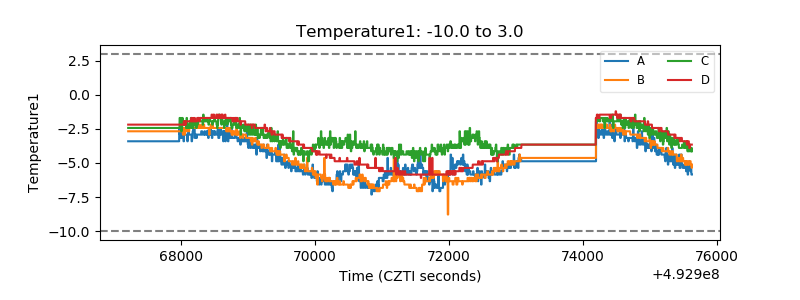 |
| Veto HV Monitor | 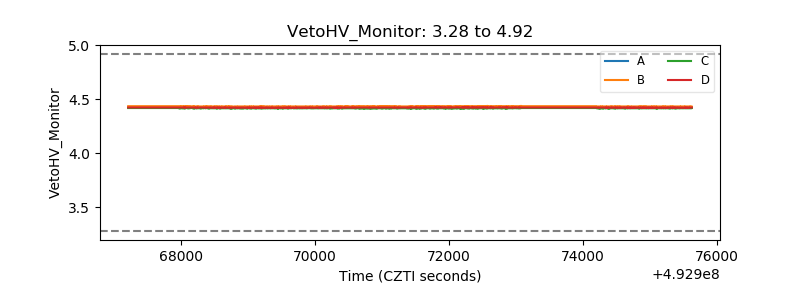 |
| Veto LLD | 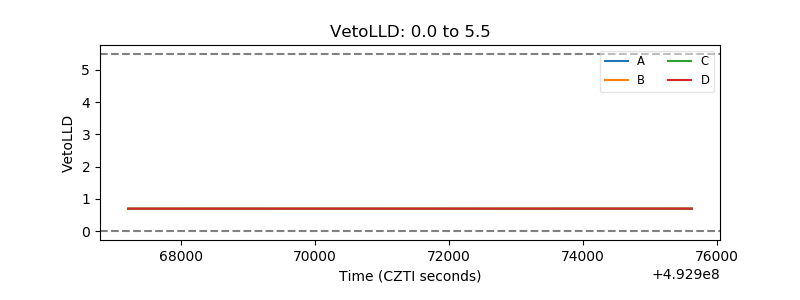 |
| Alpha Counter | 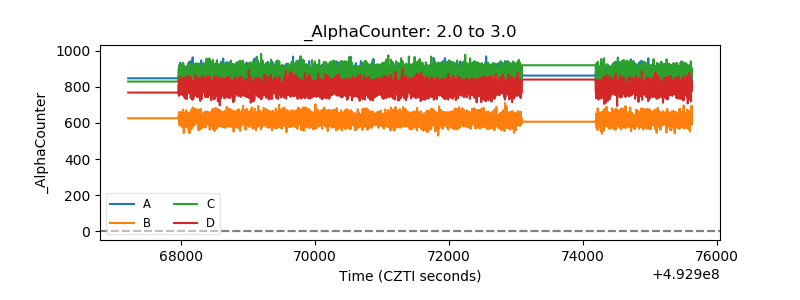 |
| _CPM_Rate | 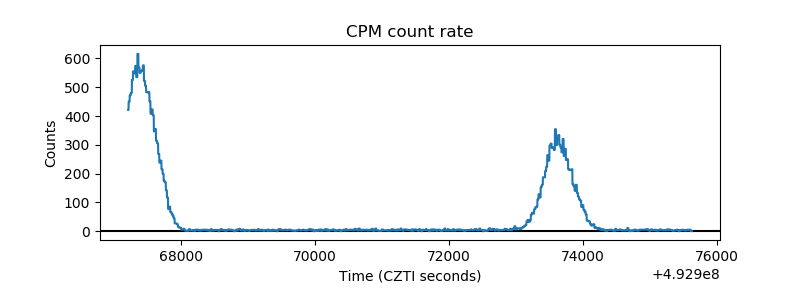 |
| CZT Counter | 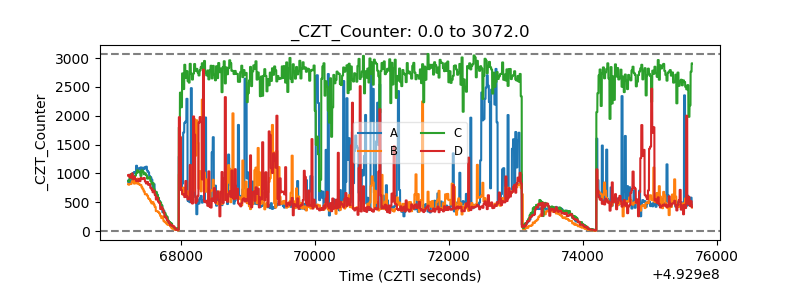 |
| +2.5 Volts monitor | 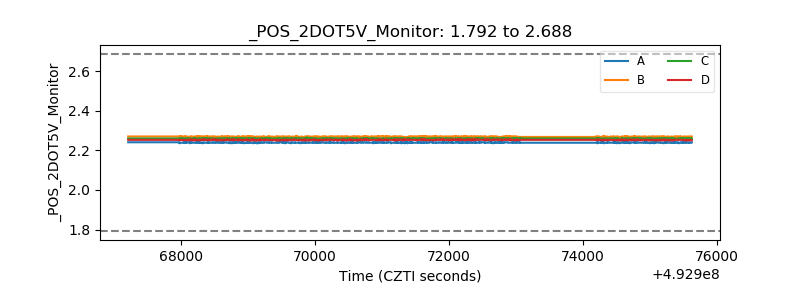 |
| +5 Volts monitor | 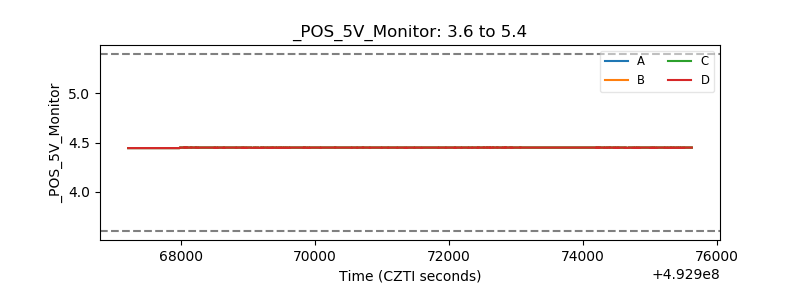 |
| _ROLL_ROT | 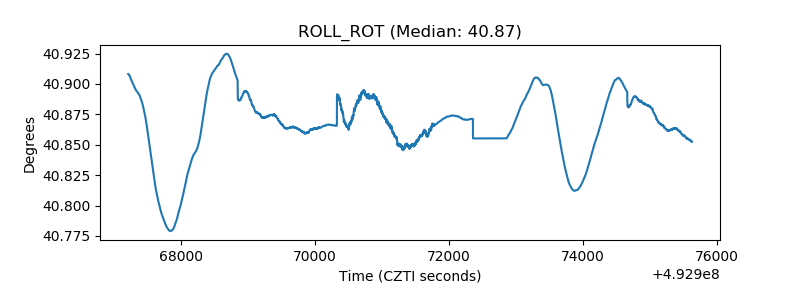 |
| _Roll_DEC | 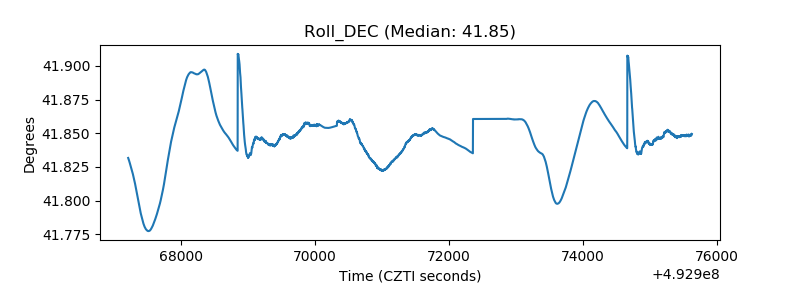 |
| _Roll_RA | 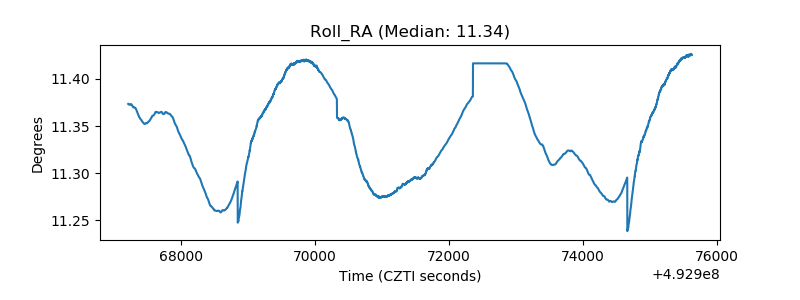 |
| Veto Counter | 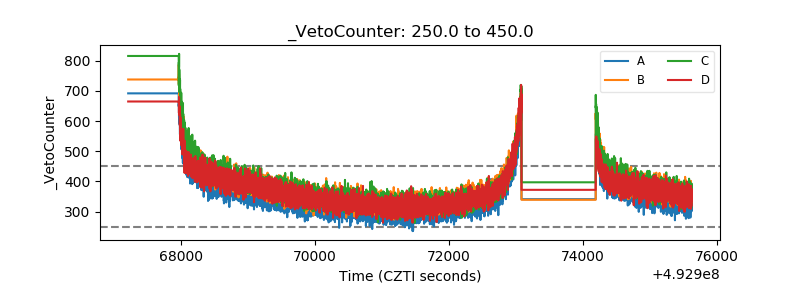 |