| Param | Original file | Final file |
|---|---|---|
| Filename | modeM0/AS1A14_002T06_9000006496_53459cztM0_level2.fits | modeM0/AS1A14_002T06_9000006496_53459cztM0_level2_quad_clean.evt |
| Size (bytes) | 844,470,720 | 86,137,920 |
| Size | 805.4 MB | 82.1 MB |
| Events in quadrant A | 4,752,094 | 661,756 |
| Events in quadrant B | 4,714,537 | 722,018 |
| Events in quadrant C | 17,233,140 | 121,671 |
| Events in quadrant D | 4,011,597 | 610,157 |
| Mode M9 | |||
|---|---|---|---|
| Quadrant | BADHDUFLAG | Total packets | Discarded packets |
| A | 0 | 4 | 0 |
| B | 0 | 4 | 0 |
| C | 0 | 4 | 0 |
| D | 0 | 4 | 0 |
| Mode SS | |||
|---|---|---|---|
| Quadrant | BADHDUFLAG | Total packets | Discarded packets |
| A | 0 | 144 | 0 |
| B | 0 | 144 | 0 |
| C | 0 | 144 | 0 |
| D | 0 | 144 | 0 |
| Mode M0 | |||
|---|---|---|---|
| Quadrant | BADHDUFLAG | Total packets | Discarded packets |
| A | 0 | 19091 | 2 |
| B | 0 | 18769 | 2 |
| C | 0 | 56018 | 2 |
| D | 0 | 17183 | 2 |
| Quadrant | Total seconds | Saturated seconds | Saturation percentage |
|---|---|---|---|
| A | 7068 | 438 | 6.196944% |
| B | 7067 | 358 | 5.065799% |
| C | 7068 | 5954 | 84.238823% |
| D | 7068 | 133 | 1.881720% |
Noise dominated data is calculated using 1-second bins in cleaned event files. If a bin has >2000 counts, and if more than 50% of those come from <1% of pixels, then it is considered to be noise-dominated and hence unusable.
| Quadrant | # 1 sec bins | Bins with >0 counts | Bins with >2000 counts | High rate bins dominated by noise | Noise dominated (total time) | Noise dominated (detector-on time) | Marked lightcurve |
|---|---|---|---|---|---|---|---|
| A | 7493 | 7070 | 341 | 341 | 4.55% | 4.82% | 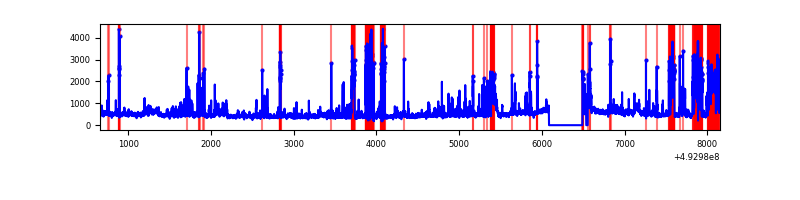 |
| B | 7492 | 7069 | 164 | 164 | 2.19% | 2.32% | 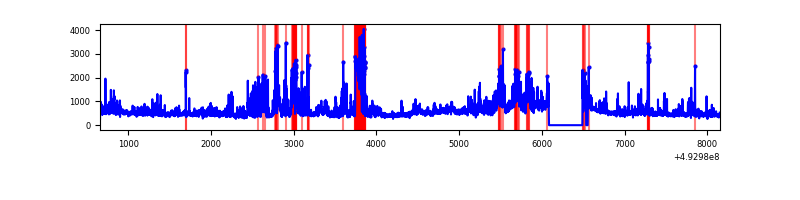 |
| C | 7492 | 7067 | 5695 | 5695 | 76.01% | 80.59% | 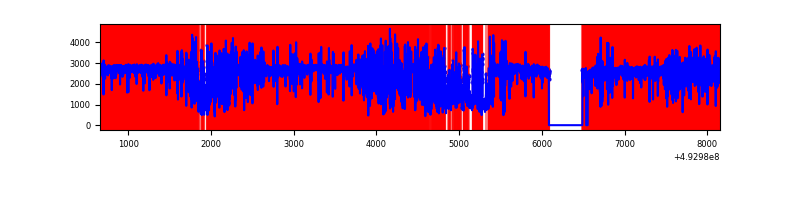 |
| D | 7493 | 7070 | 103 | 103 | 1.37% | 1.46% | 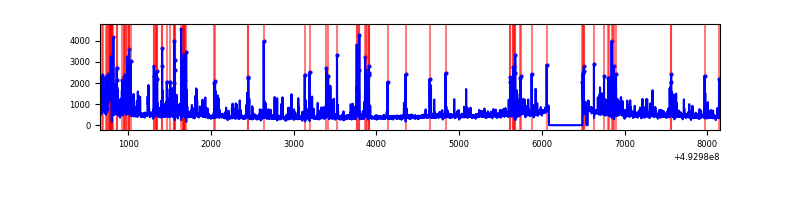 |
Top three noisy pixels from each quadrant. If the there are fewer than three noisy pixels in the level2.evt file, extra rows are filled as -1
| Pixel properties | Quadrant properties | ||||||
|---|---|---|---|---|---|---|---|
| Quadrant | DetID | PixID | Counts | Sigma | Mean | Median | Sigma |
| A | 15 | 174 | 696468 | 3708.76 | 754 | 735 | 187.6 |
| A | 3 | 63 | 578783 | 3081.41 | 754 | 735 | 187.6 |
| A | 8 | 249 | 375191 | 1996.12 | 754 | 735 | 187.6 |
| B | 4 | 171 | 479417 | 2975.66 | 754 | 727 | 160.9 |
| B | 7 | 0 | 318288 | 1974.04 | 754 | 727 | 160.9 |
| B | 2 | 249 | 275140 | 1705.82 | 754 | 727 | 160.9 |
| C | 1 | 241 | 9542652 | 99843.37 | 347 | 343 | 95.6 |
| C | 15 | 178 | 2949377 | 30856.42 | 347 | 343 | 95.6 |
| C | 4 | 5 | 1036105 | 10837.42 | 347 | 343 | 95.6 |
| D | 8 | 176 | 232633 | 1095.26 | 745 | 711 | 211.7 |
| D | 3 | 12 | 195255 | 918.74 | 745 | 711 | 211.7 |
| D | 13 | 153 | 156779 | 737.04 | 745 | 711 | 211.7 |
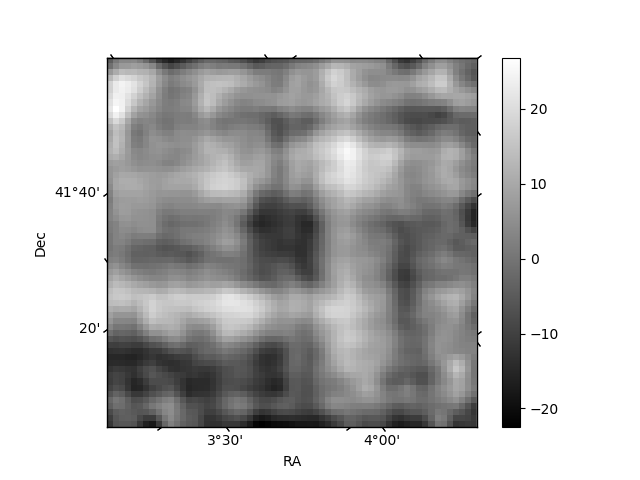
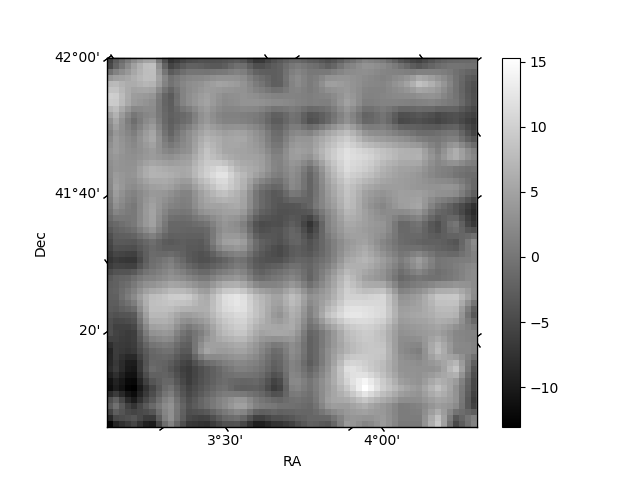
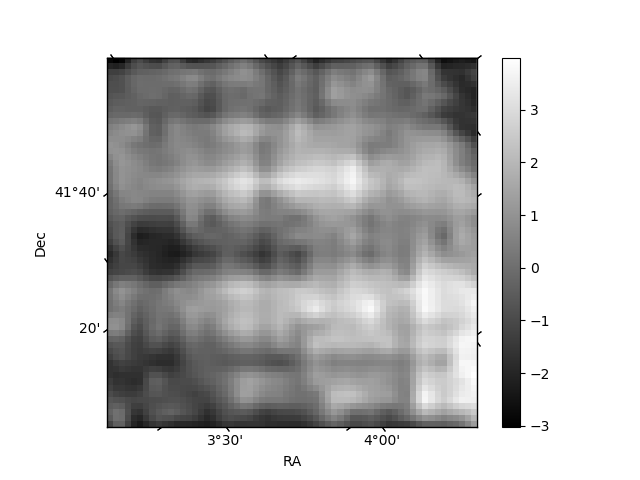
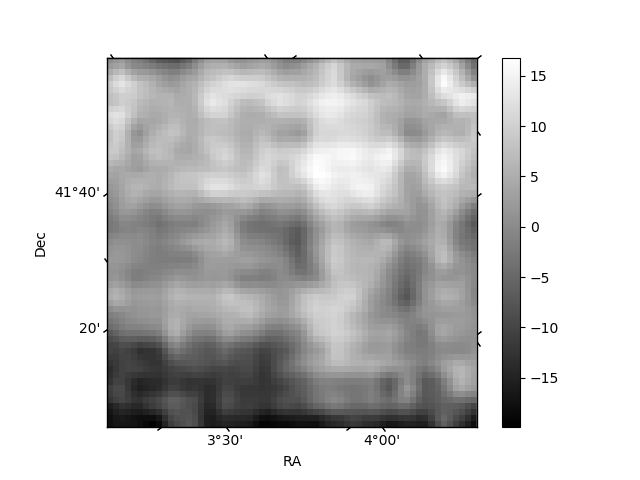
Histogram calculated using DETX and DETY for each event in the final _common_clean file
| Quadrant A | 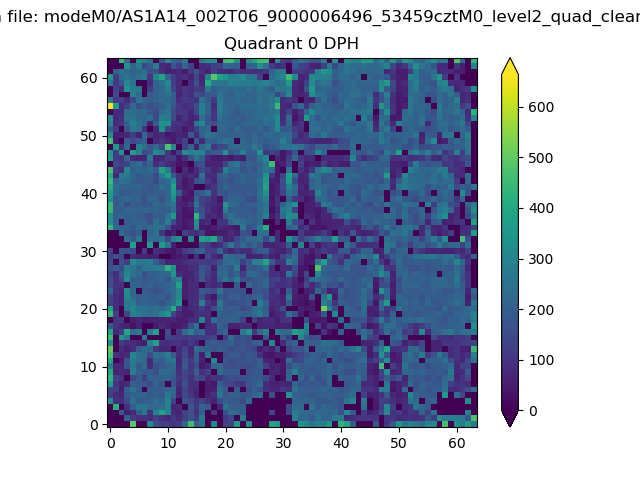 |
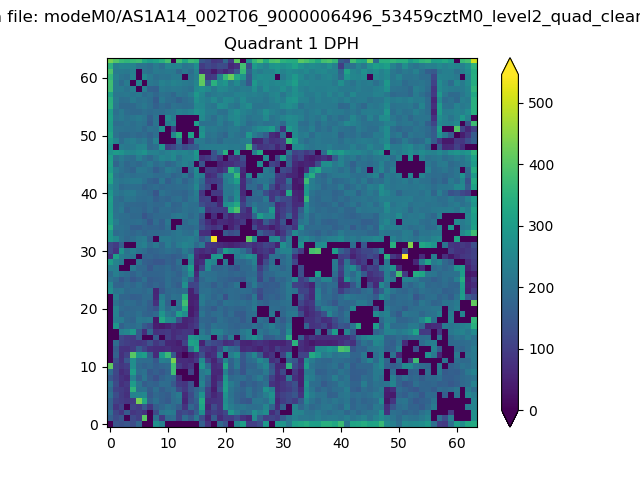 |
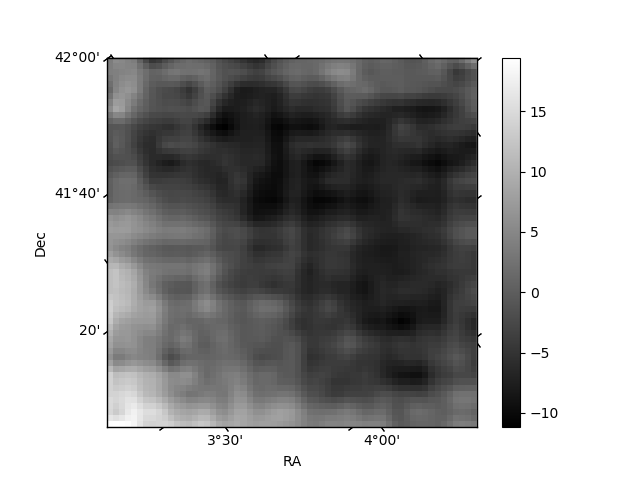
Quadrant B |
|---|---|---|---|
| Quadrant D | 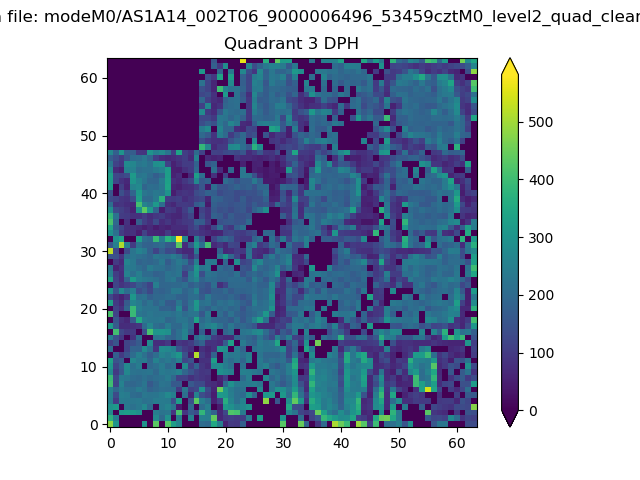 |
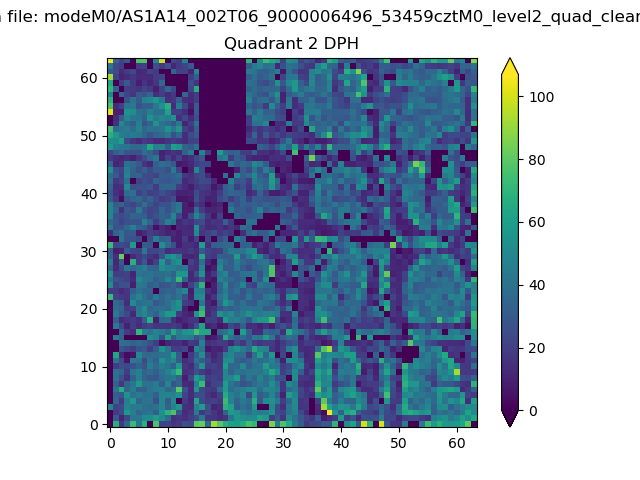 |
Quadrant C |
| Plot type | Count rate plots | Images |
|---|---|---|
| Comparison with Poisson distribution Blue bars denote a histogram of data divided into 1 sec bins. Red curve is a Poisson curve with rate = median count rate of data. |
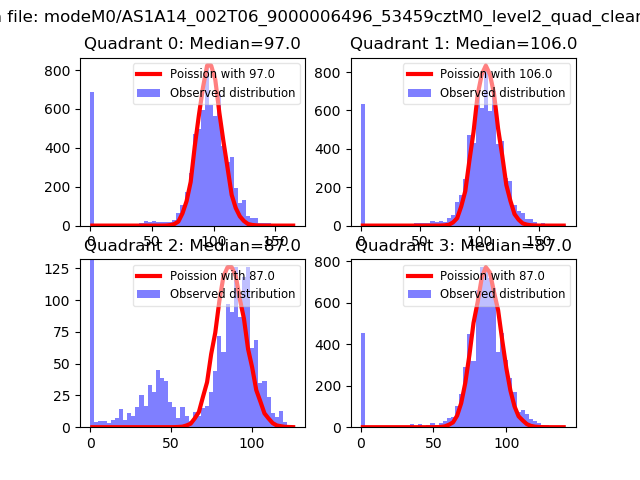 |
 |
| Quadrant-wise count rates Data is divided into 100 sec bins |
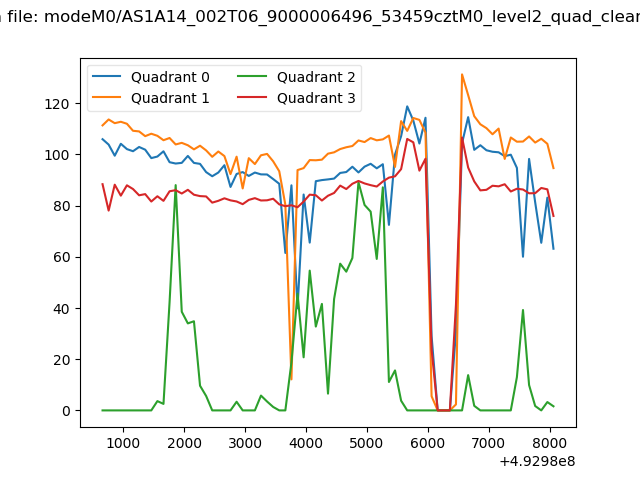 |
|
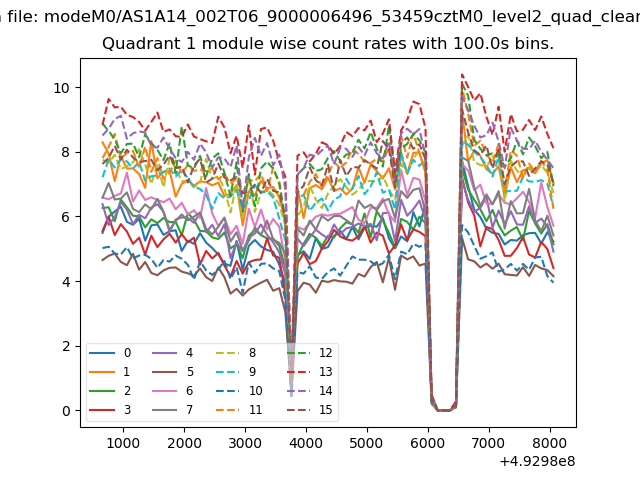
| Module-wise count rates for Quadrant A Data is divided into 100 sec bins |
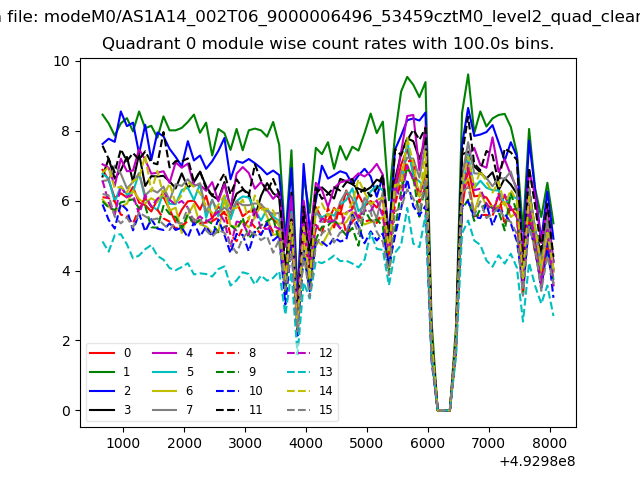 |
 |
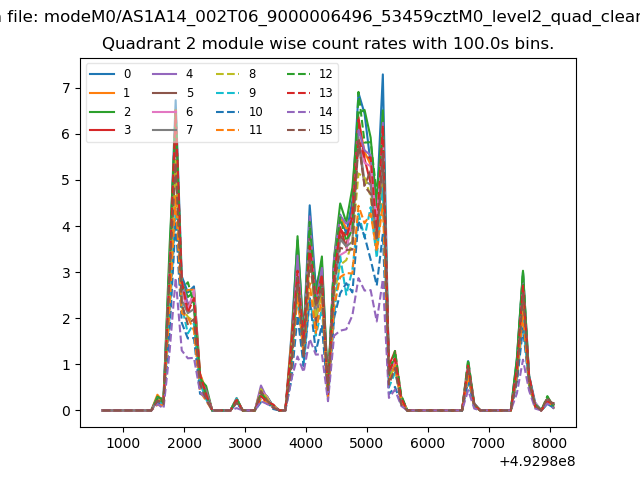
| Module-wise count rates for Quadrant B Data is divided into 100 sec bins |
 |
 |
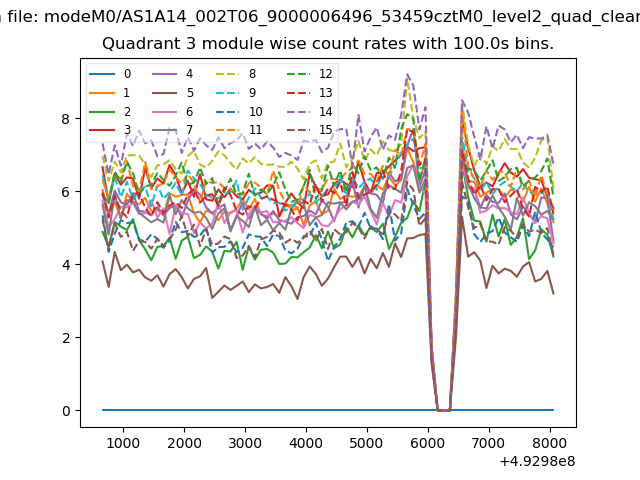
| Module-wise count rates for Quadrant C Data is divided into 100 sec bins |
 |
 |
| Module-wise count rates for Quadrant D Data is divided into 100 sec bins |
 |
 |
| Parameter | Plot |
|---|---|
| CZT HV Monitor | 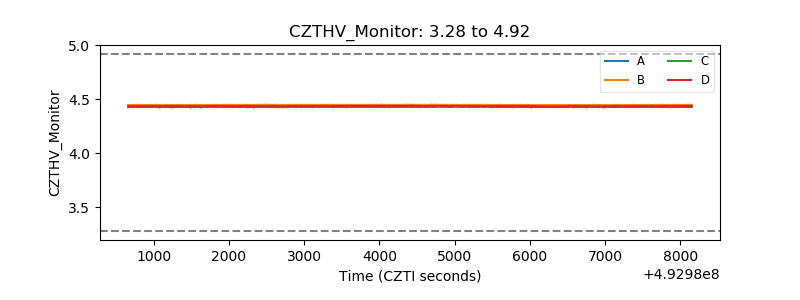 |
| D_VDD | 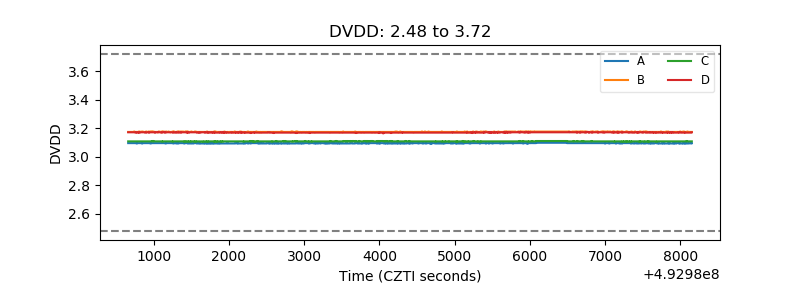 |
| Temperature 1 | 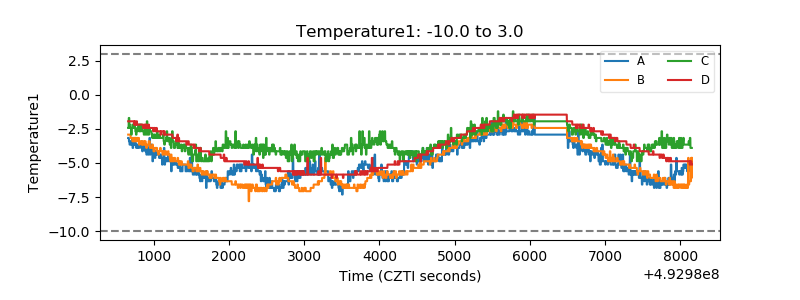 |
| Veto HV Monitor | 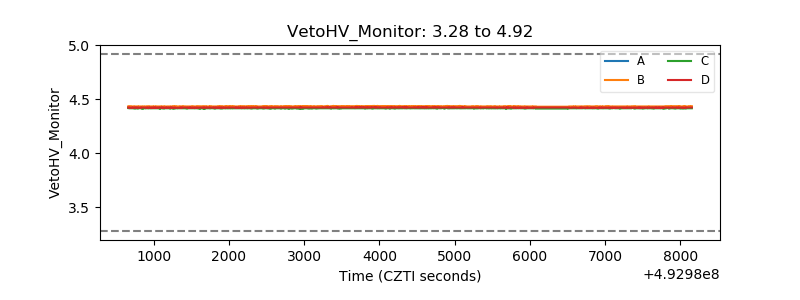 |
| Veto LLD | 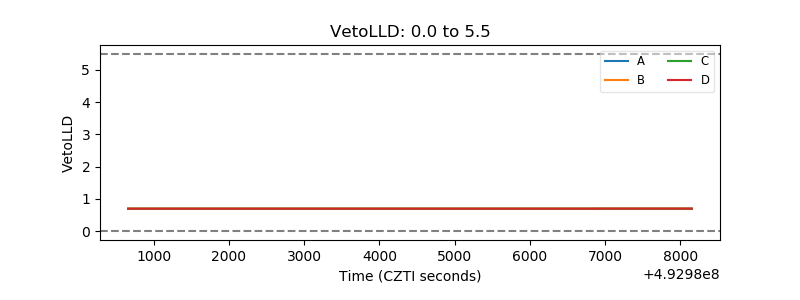 |
| Alpha Counter | 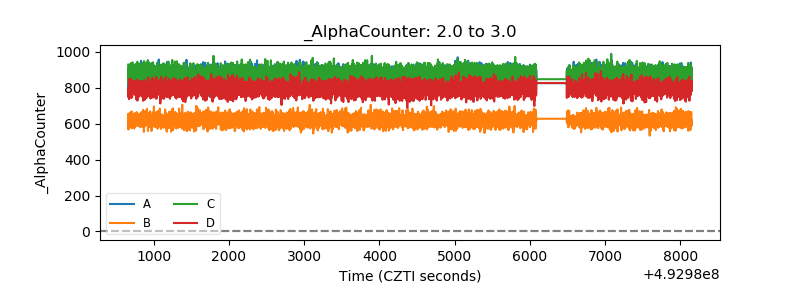 |
| _CPM_Rate |  |
| CZT Counter | 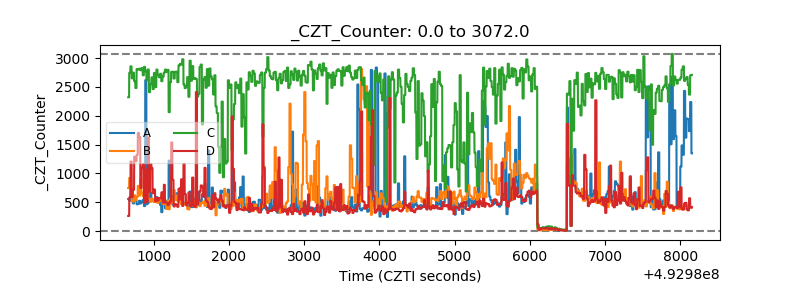 |
| +2.5 Volts monitor |  |
| +5 Volts monitor |  |
| _ROLL_ROT | 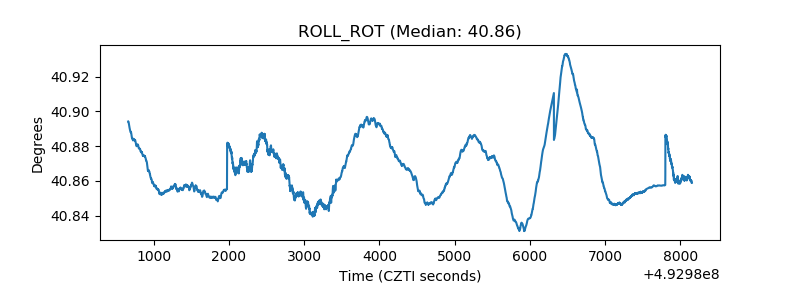 |
| _Roll_DEC | 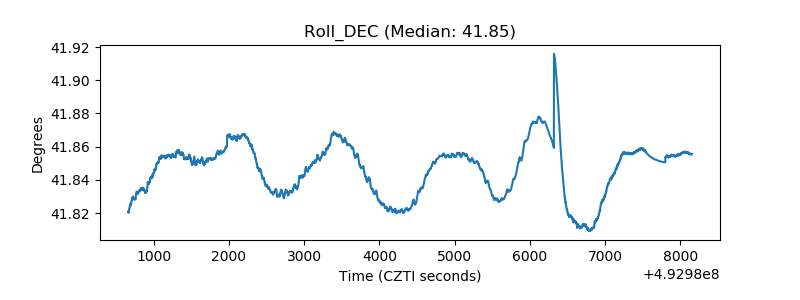 |
| _Roll_RA | 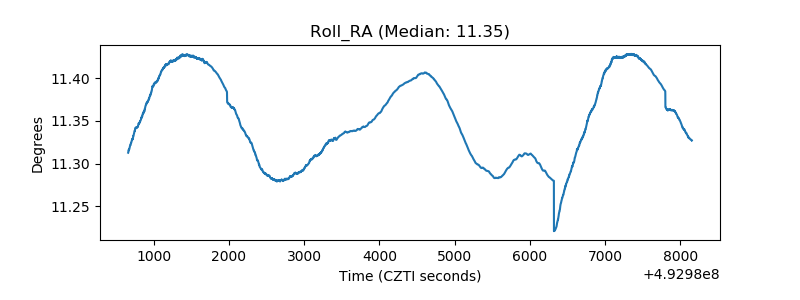 |
| Veto Counter | 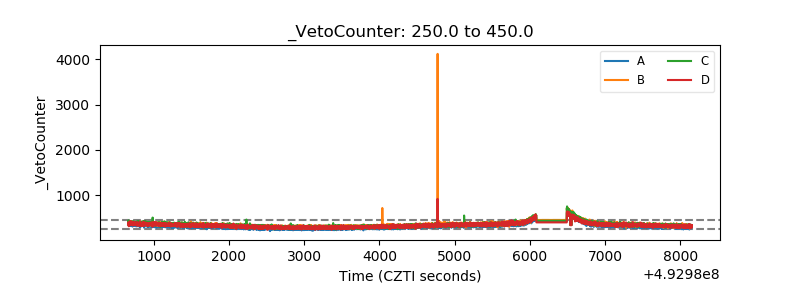 |