| Param | Original file | Final file |
|---|---|---|
| Filename | modeM0/AS1A14_002T06_9000006496_53460cztM0_level2.fits | modeM0/AS1A14_002T06_9000006496_53460cztM0_level2_quad_clean.evt |
| Size (bytes) | 909,374,400 | 97,862,400 |
| Size | 867.2 MB | 93.3 MB |
| Events in quadrant A | 5,421,263 | 734,211 |
| Events in quadrant B | 4,735,149 | 823,050 |
| Events in quadrant C | 18,119,870 | 181,353 |
| Events in quadrant D | 4,773,367 | 675,338 |
| Mode M9 | |||
|---|---|---|---|
| Quadrant | BADHDUFLAG | Total packets | Discarded packets |
| A | 0 | 4 | 0 |
| B | 0 | 4 | 0 |
| C | 0 | 4 | 0 |
| D | 0 | 4 | 0 |
| Mode SS | |||
|---|---|---|---|
| Quadrant | BADHDUFLAG | Total packets | Discarded packets |
| A | 0 | 160 | 0 |
| B | 0 | 160 | 0 |
| C | 0 | 160 | 0 |
| D | 0 | 160 | 0 |
| Mode M0 | |||
|---|---|---|---|
| Quadrant | BADHDUFLAG | Total packets | Discarded packets |
| A | 0 | 21786 | 2 |
| B | 0 | 19640 | 2 |
| C | 0 | 59222 | 2 |
| D | 0 | 19916 | 2 |
| Quadrant | Total seconds | Saturated seconds | Saturation percentage |
|---|---|---|---|
| A | 7896 | 544 | 6.889564% |
| B | 7896 | 283 | 3.584093% |
| C | 7896 | 6205 | 78.584093% |
| D | 7896 | 208 | 2.634245% |
Noise dominated data is calculated using 1-second bins in cleaned event files. If a bin has >2000 counts, and if more than 50% of those come from <1% of pixels, then it is considered to be noise-dominated and hence unusable.
| Quadrant | # 1 sec bins | Bins with >0 counts | Bins with >2000 counts | High rate bins dominated by noise | Noise dominated (total time) | Noise dominated (detector-on time) | Marked lightcurve |
|---|---|---|---|---|---|---|---|
| A | 8321 | 7898 | 445 | 445 | 5.35% | 5.63% | 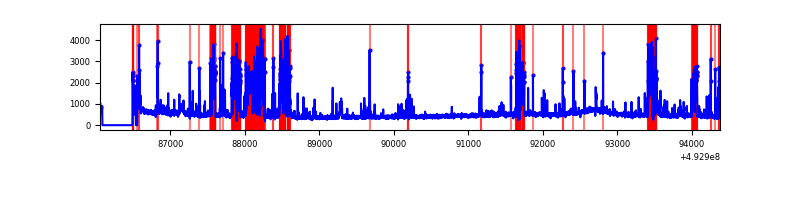 |
| B | 8321 | 7898 | 70 | 70 | 0.84% | 0.89% | 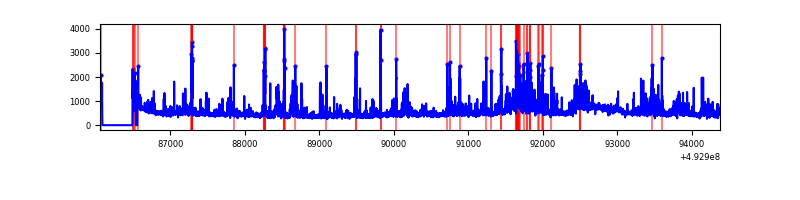 |
| C | 8321 | 7896 | 5611 | 5611 | 67.43% | 71.06% | 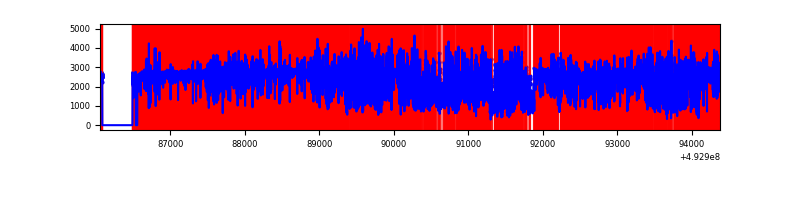 |
| D | 8321 | 7898 | 158 | 158 | 1.90% | 2.00% | 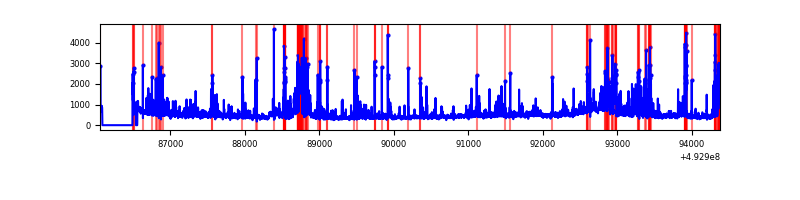 |
Top three noisy pixels from each quadrant. If the there are fewer than three noisy pixels in the level2.evt file, extra rows are filled as -1
| Pixel properties | Quadrant properties | ||||||
|---|---|---|---|---|---|---|---|
| Quadrant | DetID | PixID | Counts | Sigma | Mean | Median | Sigma |
| A | 15 | 174 | 1487928 | 7026.41 | 857 | 833 | 211.6 |
| A | 3 | 63 | 345866 | 1630.26 | 857 | 833 | 211.6 |
| A | 0 | 8 | 63015 | 293.81 | 857 | 833 | 211.6 |
| B | 4 | 171 | 576560 | 3068.22 | 868 | 835 | 187.6 |
| B | 8 | 234 | 130692 | 692.05 | 868 | 835 | 187.6 |
| B | 5 | 185 | 122857 | 650.29 | 868 | 835 | 187.6 |
| C | 1 | 241 | 7466296 | 59014.8 | 462 | 457 | 126.5 |
| C | 7 | 64 | 2884912 | 22800.59 | 462 | 457 | 126.5 |
| C | 9 | 38 | 2189455 | 17303.25 | 462 | 457 | 126.5 |
| D | 2 | 153 | 420905 | 1759.33 | 847 | 810 | 238.8 |
| D | 8 | 176 | 244819 | 1021.89 | 847 | 810 | 238.8 |
| D | 3 | 12 | 198006 | 825.84 | 847 | 810 | 238.8 |
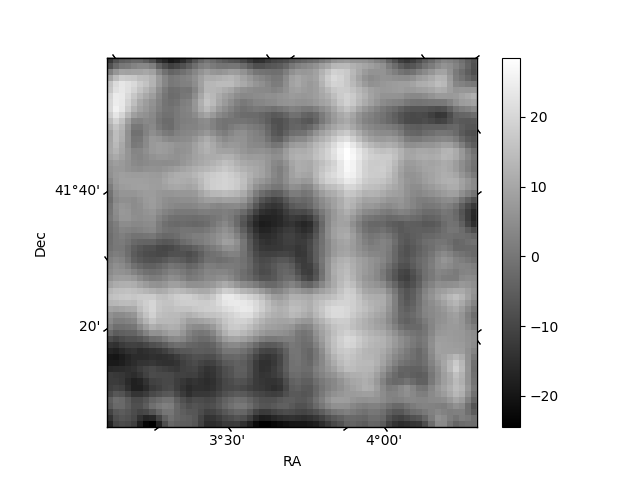
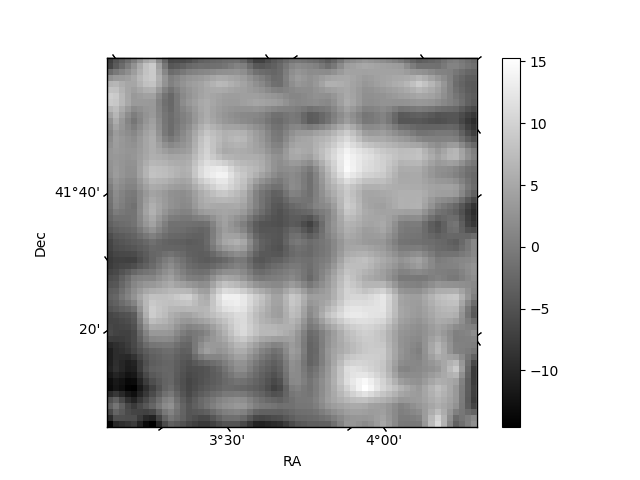
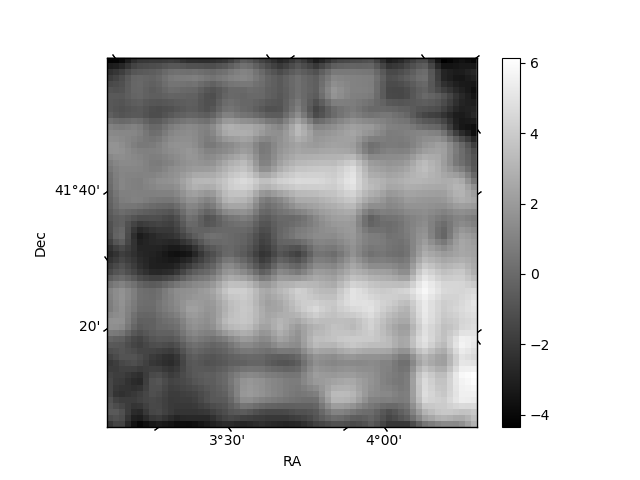
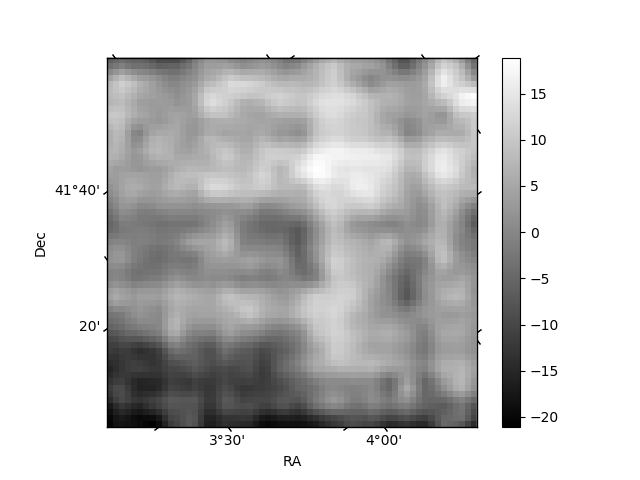
Histogram calculated using DETX and DETY for each event in the final _common_clean file
| Quadrant A | 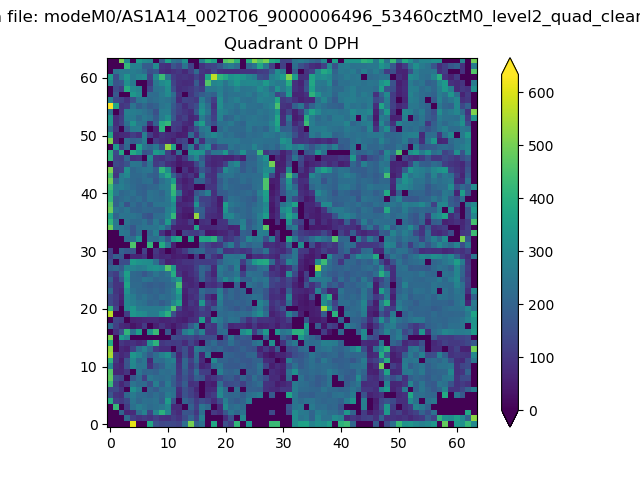 |
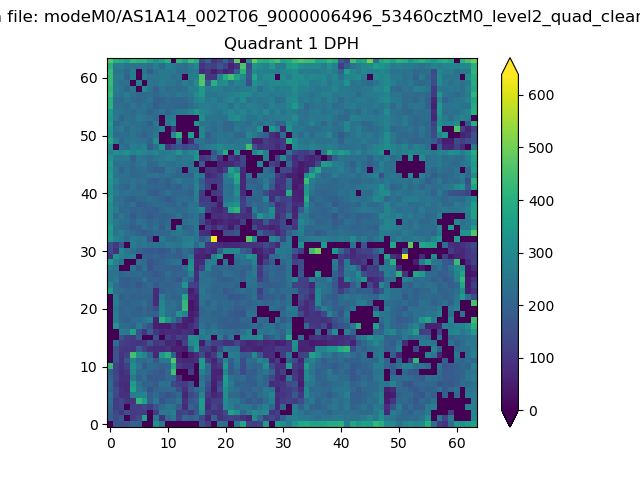 |
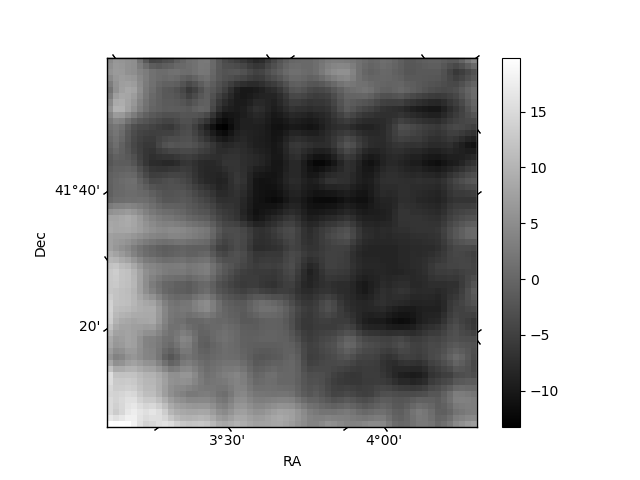
Quadrant B |
|---|---|---|---|
| Quadrant D | 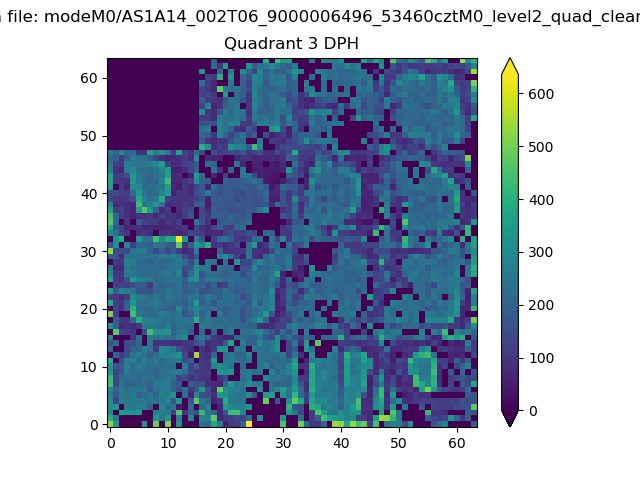 |
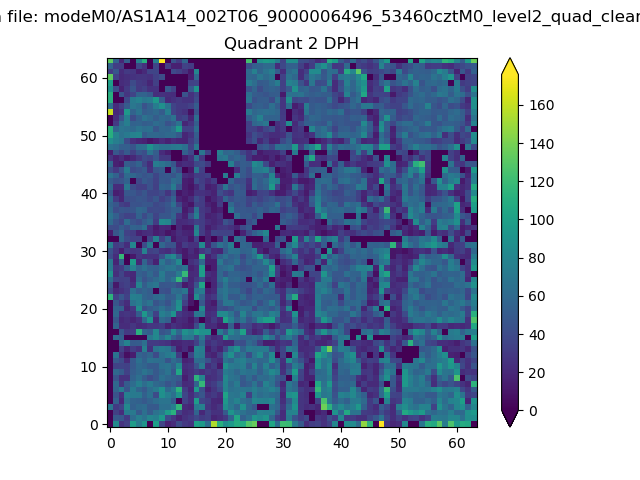 |
Quadrant C |
| Plot type | Count rate plots | Images |
|---|---|---|
| Comparison with Poisson distribution Blue bars denote a histogram of data divided into 1 sec bins. Red curve is a Poisson curve with rate = median count rate of data. |
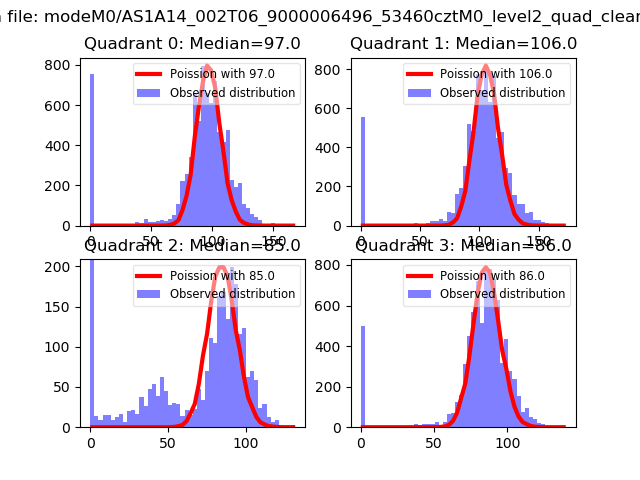 |
 |
| Quadrant-wise count rates Data is divided into 100 sec bins |
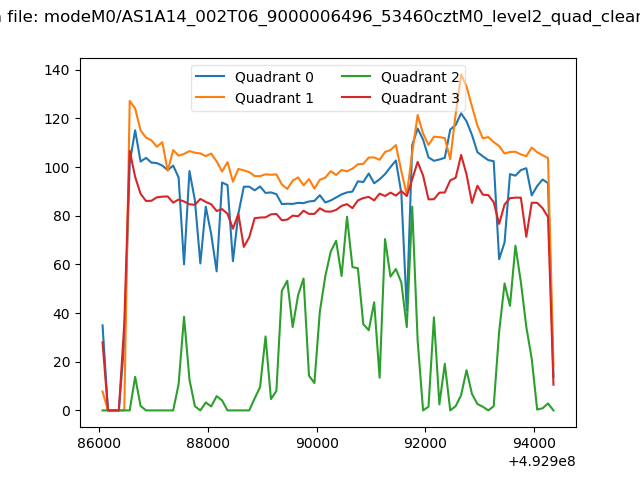 |
|
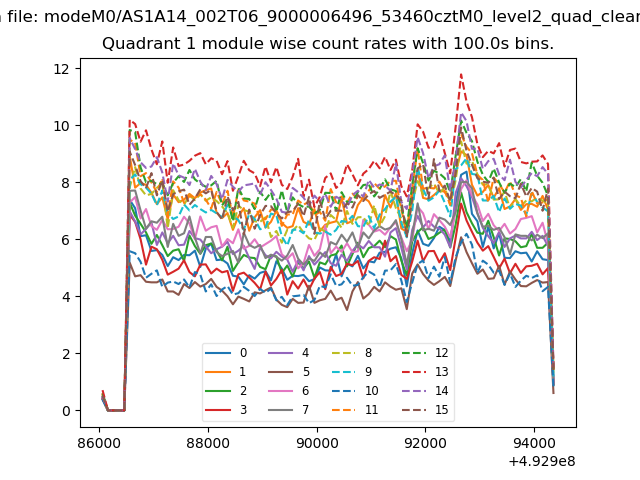
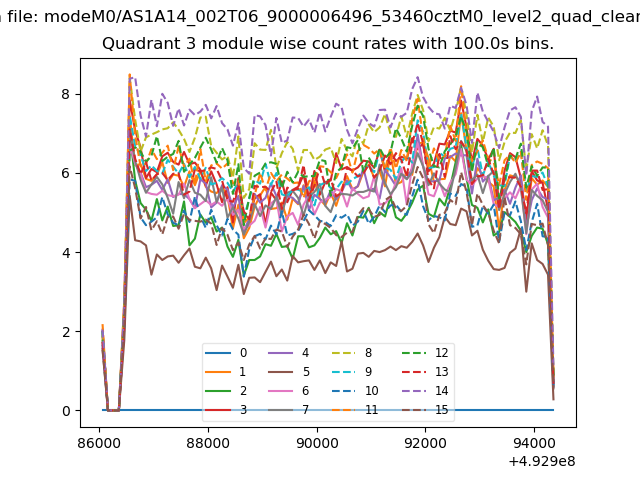
| Module-wise count rates for Quadrant A Data is divided into 100 sec bins |
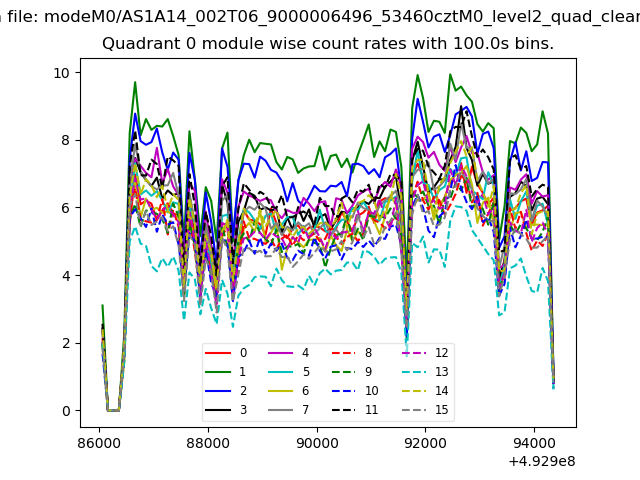 |
 |
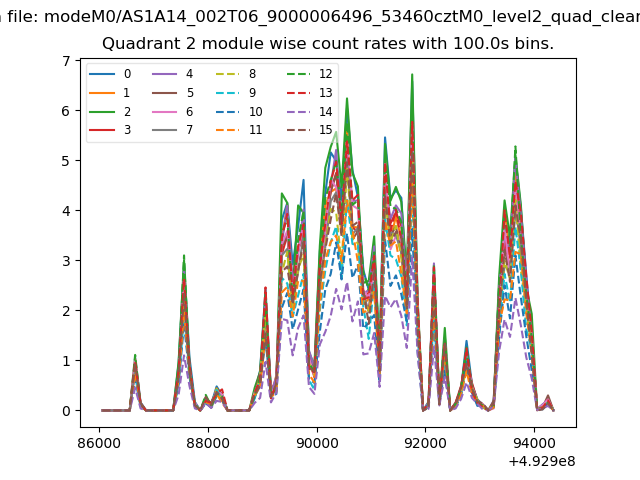
| Module-wise count rates for Quadrant B Data is divided into 100 sec bins |
 |
 |
| Module-wise count rates for Quadrant C Data is divided into 100 sec bins |
 |
 |
| Module-wise count rates for Quadrant D Data is divided into 100 sec bins |
 |
 |
| Parameter | Plot |
|---|---|
| CZT HV Monitor | 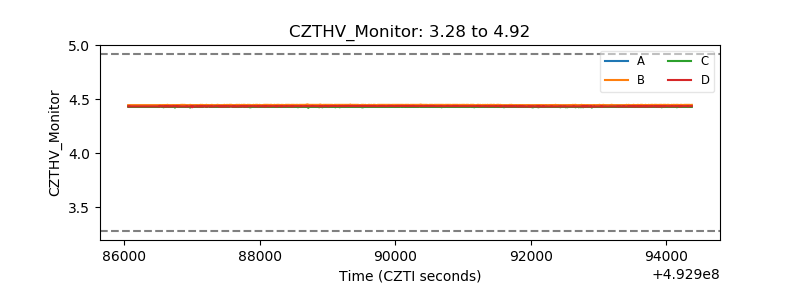 |
| D_VDD | 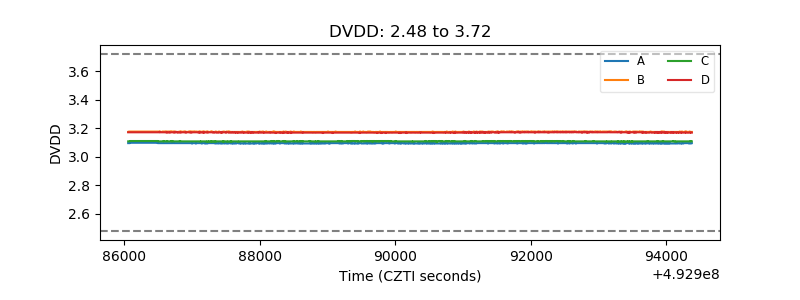 |
| Temperature 1 | 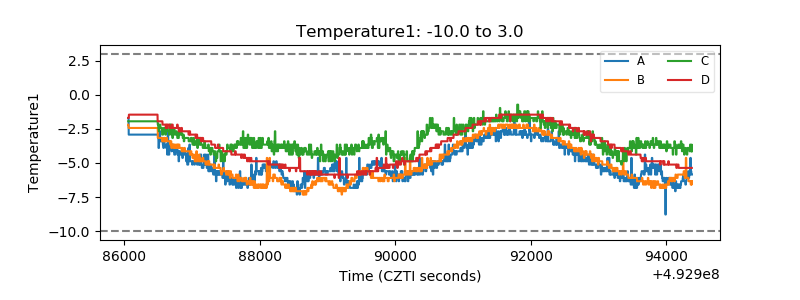 |
| Veto HV Monitor | 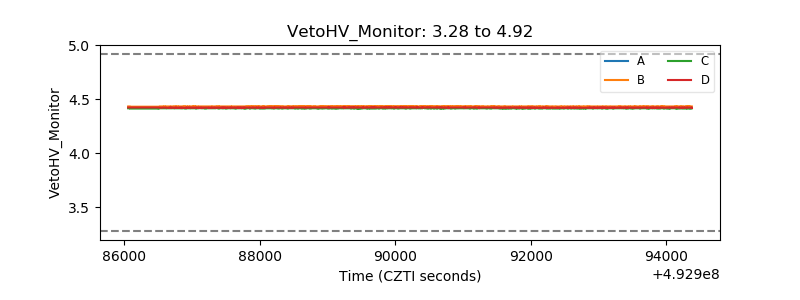 |
| Veto LLD | 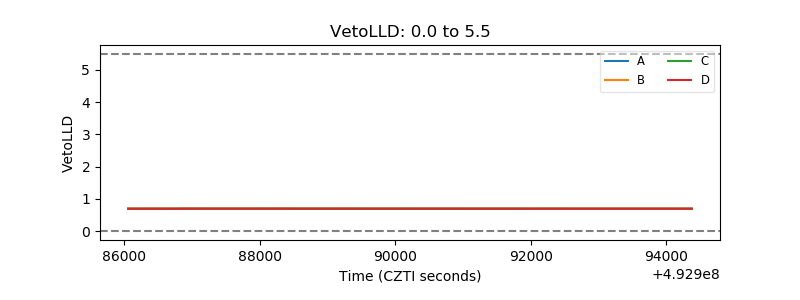 |
| Alpha Counter | 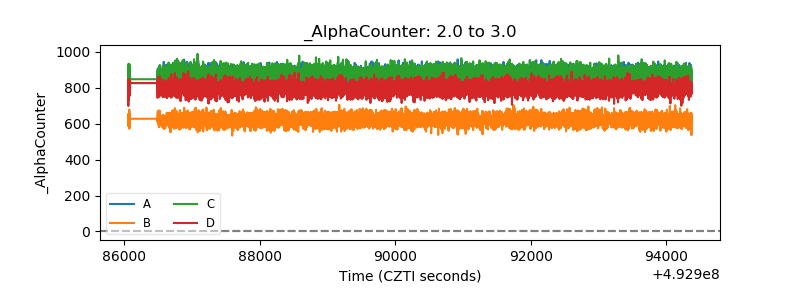 |
| _CPM_Rate | 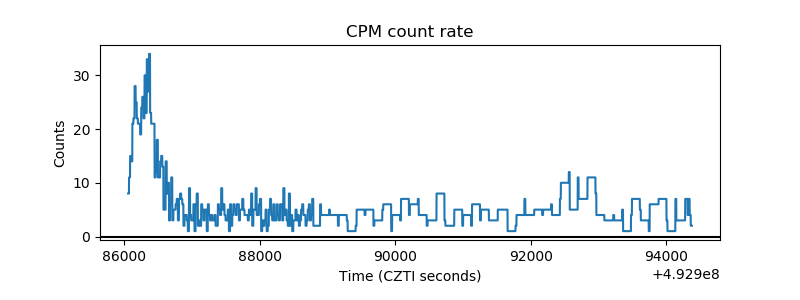 |
| CZT Counter | 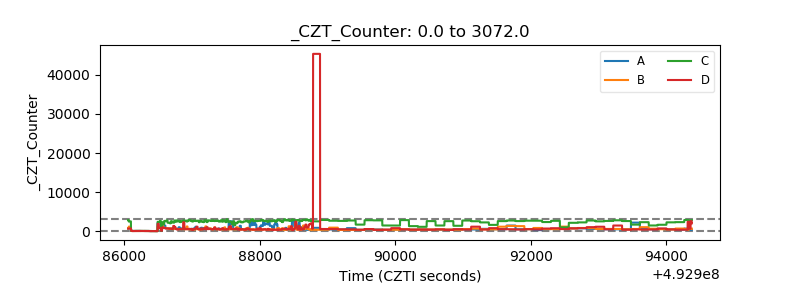 |
| +2.5 Volts monitor | 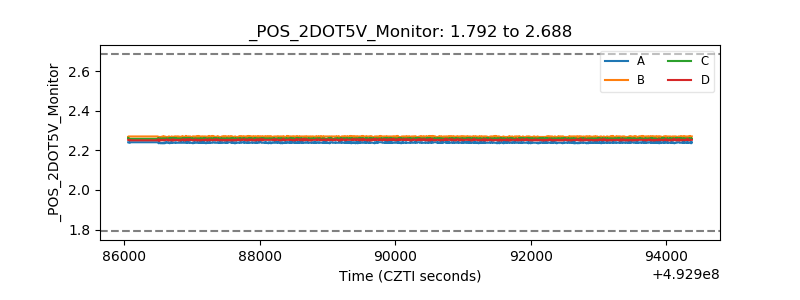 |
| +5 Volts monitor | 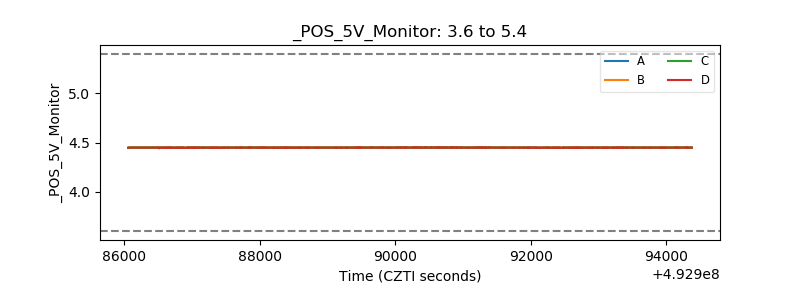 |
| _ROLL_ROT | 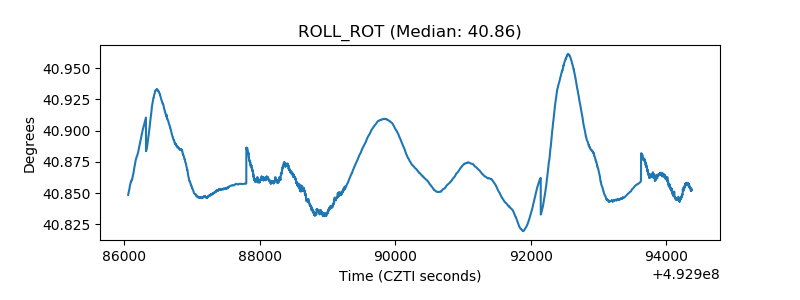 |
| _Roll_DEC | 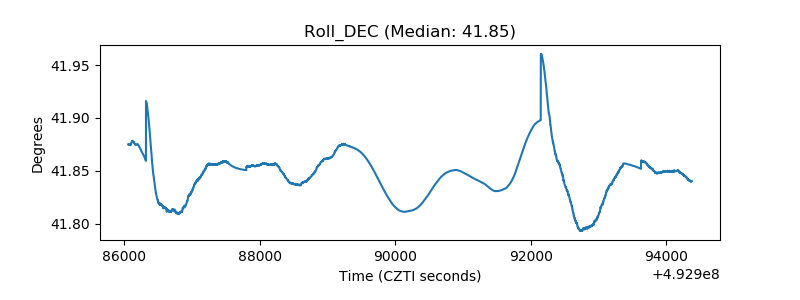 |
| _Roll_RA | 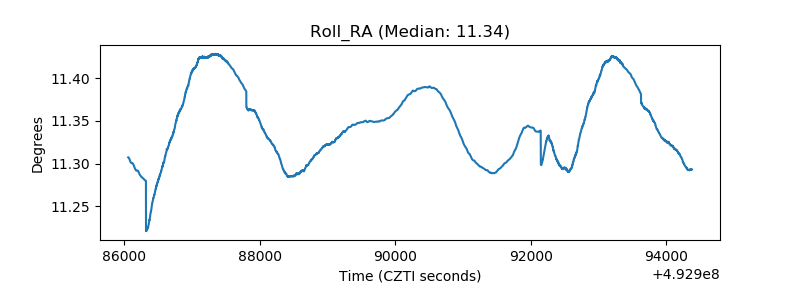 |
| Veto Counter | 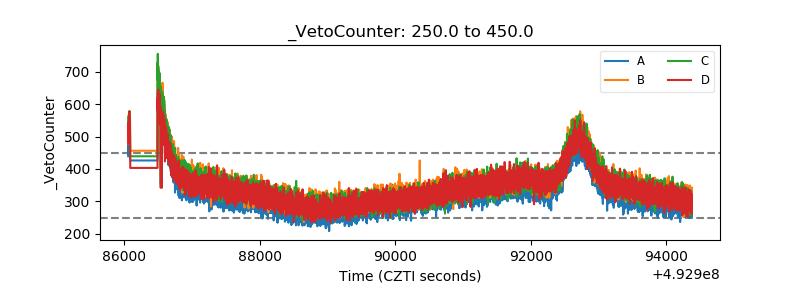 |