| Param | Original file | Final file |
|---|---|---|
| Filename | modeM0/AS1A14_002T06_9000006496_53461cztM0_level2.fits | modeM0/AS1A14_002T06_9000006496_53461cztM0_level2_quad_clean.evt |
| Size (bytes) | 1,021,858,560 | 94,616,640 |
| Size | 974.5 MB | 90.2 MB |
| Events in quadrant A | 6,464,170 | 707,450 |
| Events in quadrant B | 4,629,168 | 846,352 |
| Events in quadrant C | 19,858,357 | 109,693 |
| Events in quadrant D | 6,252,515 | 643,532 |
| Mode SS | |||
|---|---|---|---|
| Quadrant | BADHDUFLAG | Total packets | Discarded packets |
| A | 0 | 160 | 0 |
| B | 0 | 160 | 0 |
| C | 0 | 160 | 0 |
| D | 0 | 160 | 0 |
| Mode M0 | |||
|---|---|---|---|
| Quadrant | BADHDUFLAG | Total packets | Discarded packets |
| A | 0 | 24965 | 0 |
| B | 0 | 19354 | 0 |
| C | 0 | 64116 | 0 |
| D | 0 | 24445 | 0 |
| Quadrant | Total seconds | Saturated seconds | Saturation percentage |
|---|---|---|---|
| A | 8025 | 872 | 10.866044% |
| B | 8026 | 96 | 1.196113% |
| C | 8026 | 7026 | 87.540493% |
| D | 8026 | 669 | 8.335410% |
Noise dominated data is calculated using 1-second bins in cleaned event files. If a bin has >2000 counts, and if more than 50% of those come from <1% of pixels, then it is considered to be noise-dominated and hence unusable.
| Quadrant | # 1 sec bins | Bins with >0 counts | Bins with >2000 counts | High rate bins dominated by noise | Noise dominated (total time) | Noise dominated (detector-on time) | Marked lightcurve |
|---|---|---|---|---|---|---|---|
| A | 8025 | 8025 | 728 | 728 | 9.07% | 9.07% | 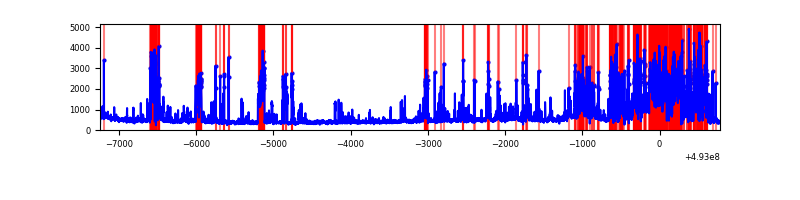 |
| B | 8026 | 8026 | 49 | 49 | 0.61% | 0.61% | 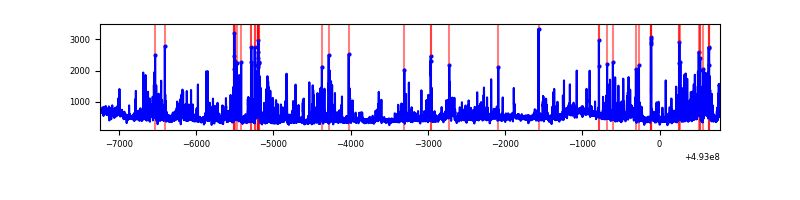 |
| C | 8026 | 8026 | 6503 | 6503 | 81.02% | 81.02% | 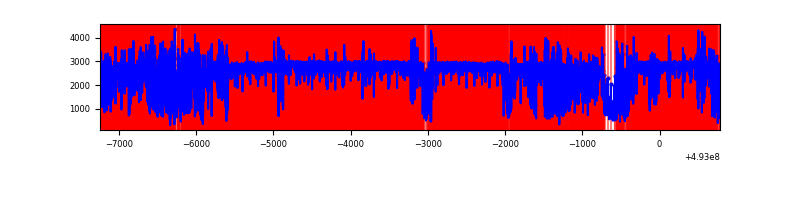 |
| D | 8026 | 8026 | 539 | 539 | 6.72% | 6.72% | 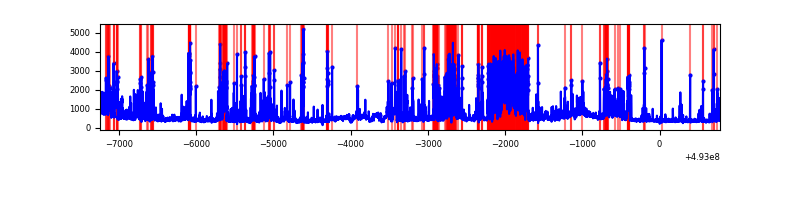 |
Top three noisy pixels from each quadrant. If the there are fewer than three noisy pixels in the level2.evt file, extra rows are filled as -1
| Pixel properties | Quadrant properties | ||||||
|---|---|---|---|---|---|---|---|
| Quadrant | DetID | PixID | Counts | Sigma | Mean | Median | Sigma |
| A | 15 | 174 | 2287609 | 11016.51 | 835 | 814 | 207.6 |
| A | 3 | 63 | 648365 | 3119.54 | 835 | 814 | 207.6 |
| A | 3 | 62 | 119009 | 569.4 | 835 | 814 | 207.6 |
| B | 10 | 28 | 316983 | 1691.98 | 869 | 836 | 186.9 |
| B | 4 | 171 | 282181 | 1505.72 | 869 | 836 | 186.9 |
| B | 2 | 249 | 155653 | 828.56 | 869 | 836 | 186.9 |
| C | 1 | 241 | 12651251 | 130455.13 | 350 | 346 | 97.0 |
| C | 7 | 64 | 2995809 | 30888.98 | 350 | 346 | 97.0 |
| C | 15 | 224 | 1335454 | 13767.53 | 350 | 346 | 97.0 |
| D | 8 | 176 | 2022310 | 8719.06 | 819 | 784 | 231.9 |
| D | 3 | 12 | 277161 | 1192.04 | 819 | 784 | 231.9 |
| D | 3 | 13 | 156879 | 673.25 | 819 | 784 | 231.9 |
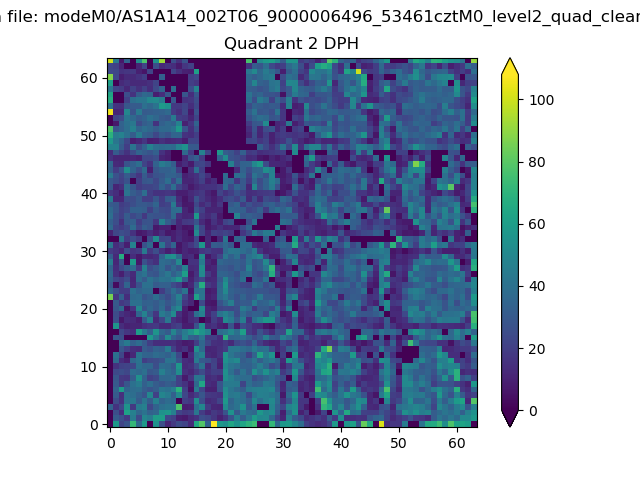
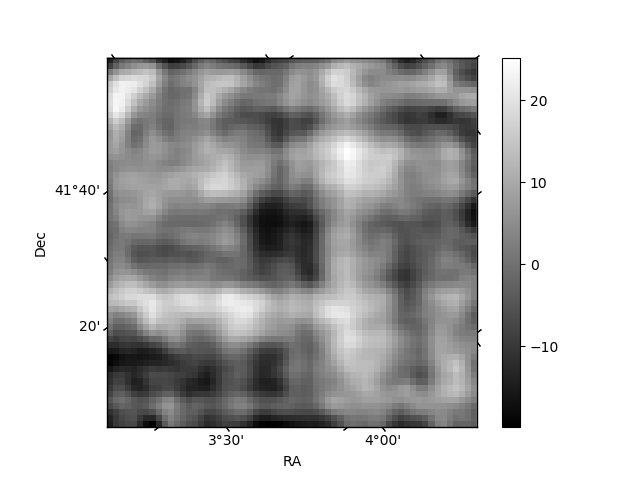
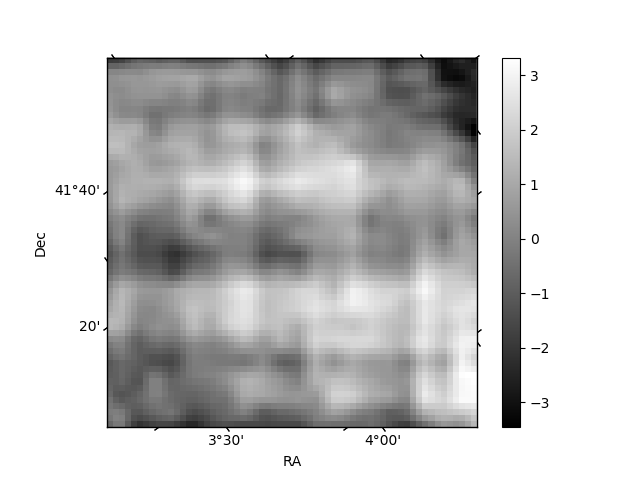
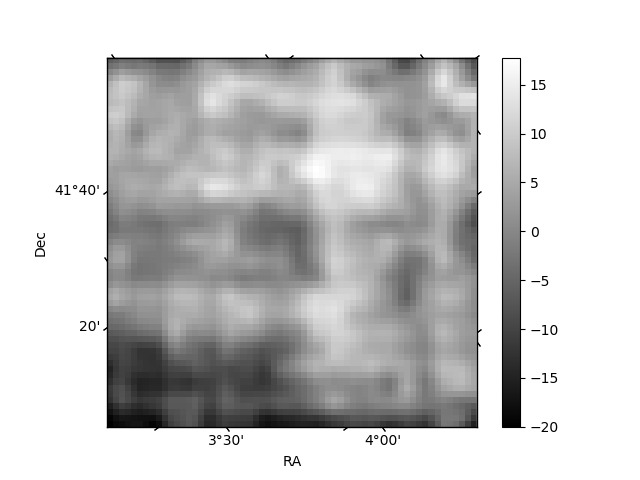
Histogram calculated using DETX and DETY for each event in the final _common_clean file
| Quadrant A | 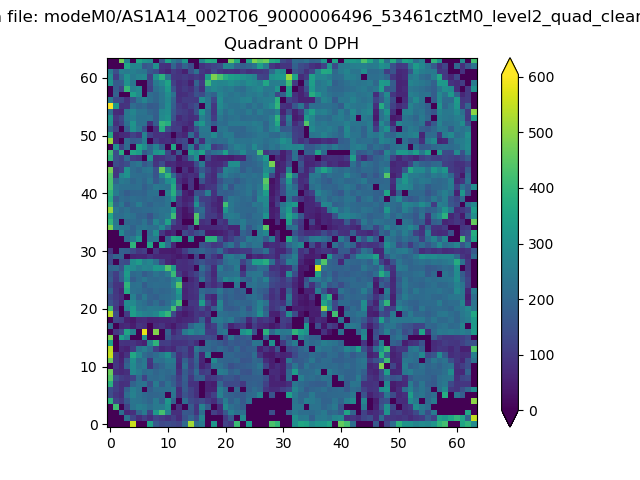 |
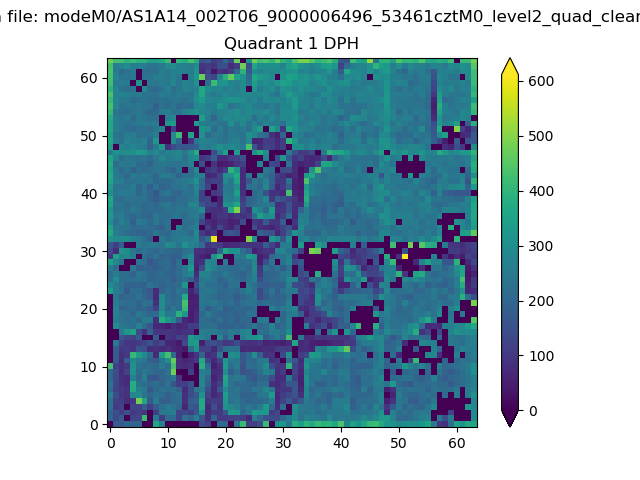 |
Quadrant B |
|---|---|---|---|
| Quadrant D | 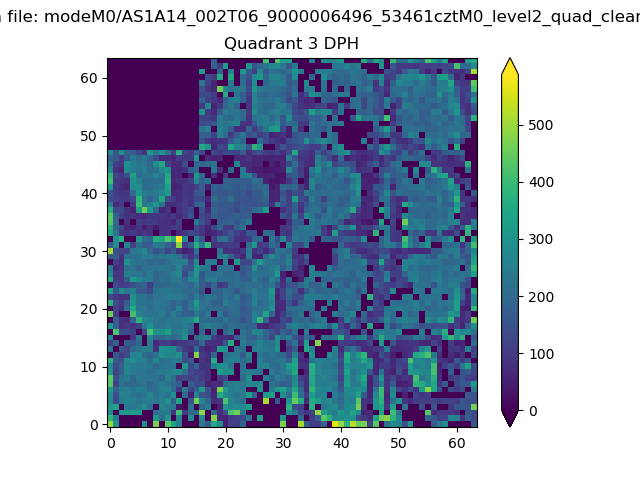 |
 |
Quadrant C |
| Plot type | Count rate plots | Images |
|---|---|---|
| Comparison with Poisson distribution Blue bars denote a histogram of data divided into 1 sec bins. Red curve is a Poisson curve with rate = median count rate of data. |
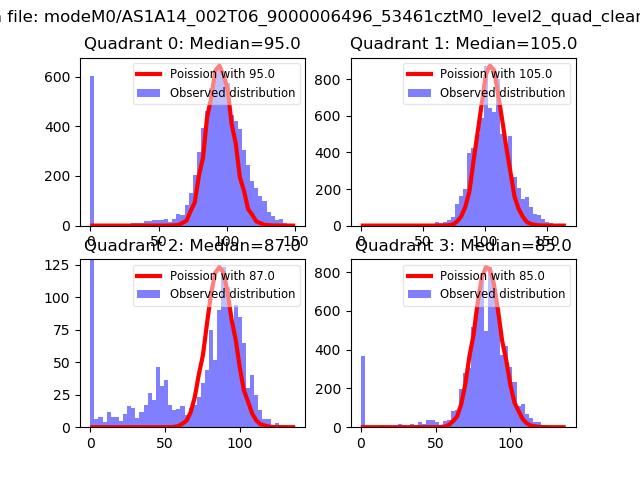 |
 |
| Quadrant-wise count rates Data is divided into 100 sec bins |
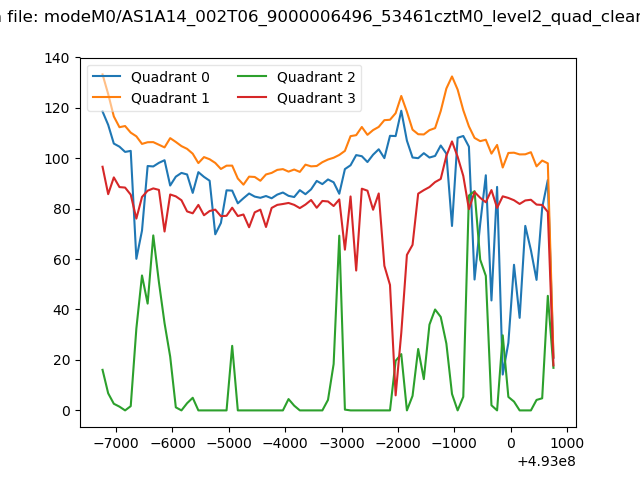 |
|
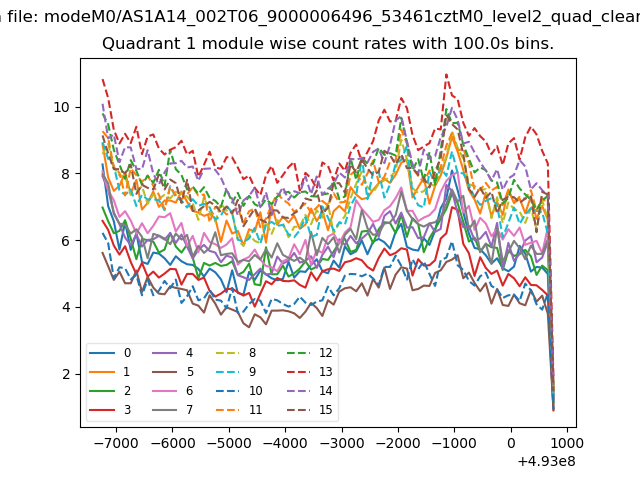
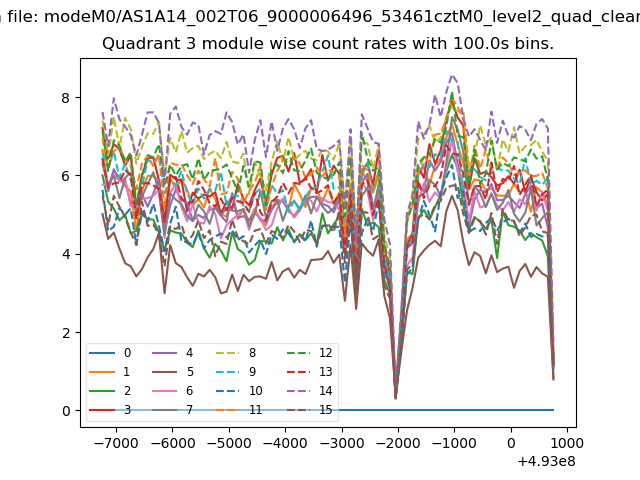
| Module-wise count rates for Quadrant A Data is divided into 100 sec bins |
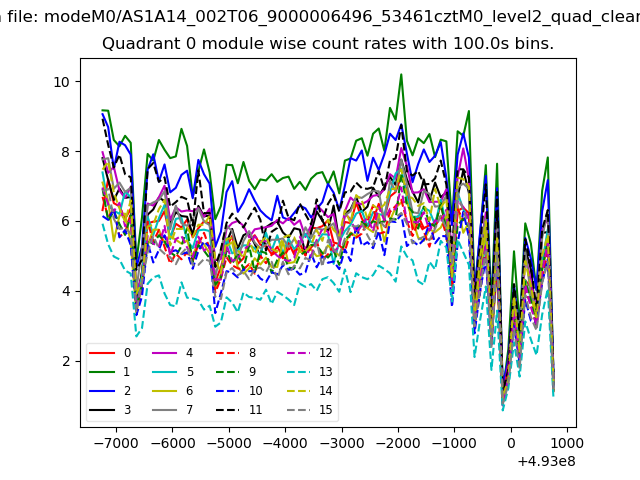 |
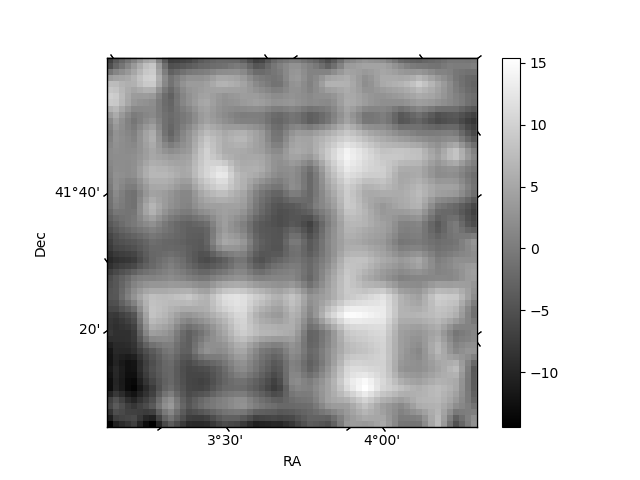 |
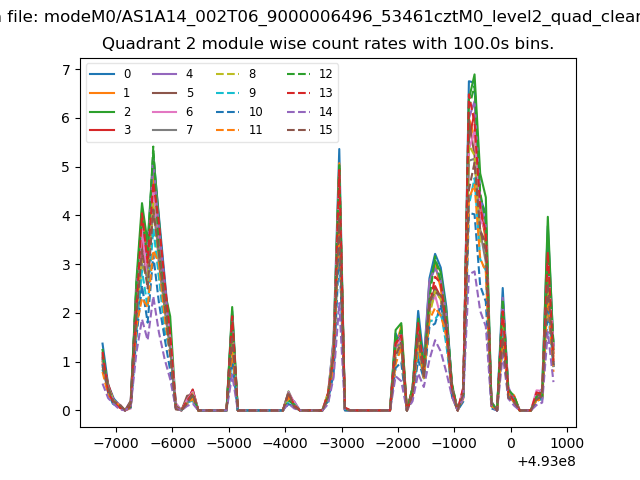
| Module-wise count rates for Quadrant B Data is divided into 100 sec bins |
 |
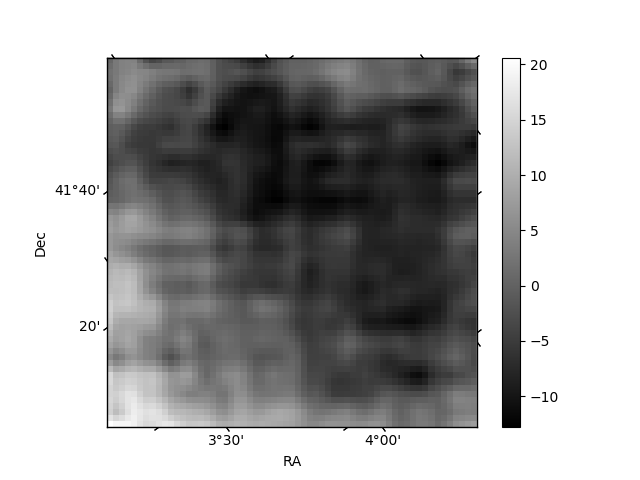 |
| Module-wise count rates for Quadrant C Data is divided into 100 sec bins |
 |
 |
| Module-wise count rates for Quadrant D Data is divided into 100 sec bins |
 |
 |
| Parameter | Plot |
|---|---|
| CZT HV Monitor |  |
| D_VDD | 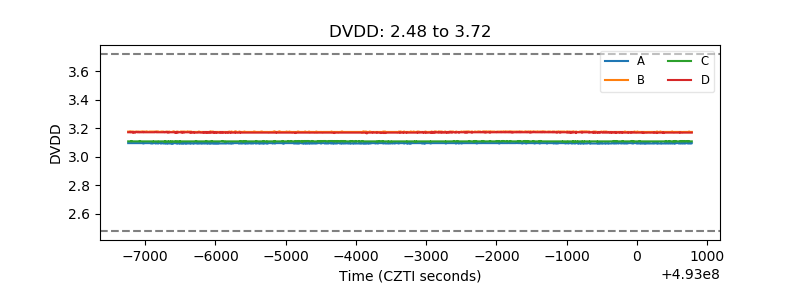 |
| Temperature 1 | 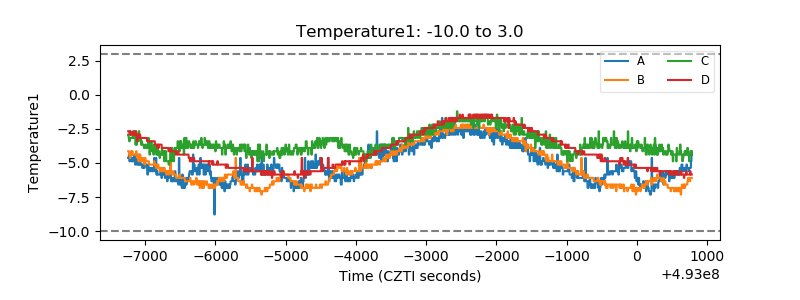 |
| Veto HV Monitor | 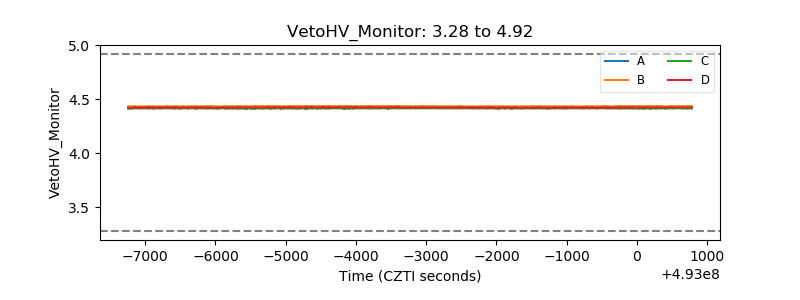 |
| Veto LLD | 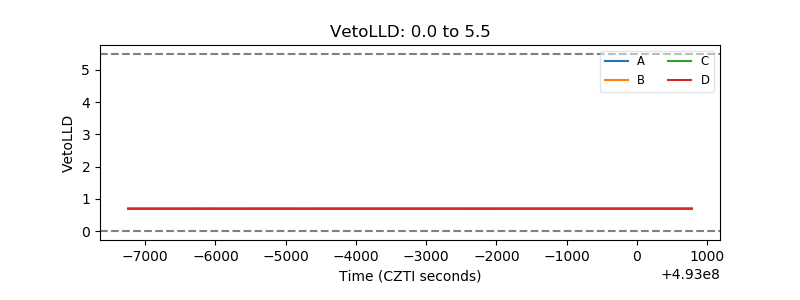 |
| Alpha Counter | 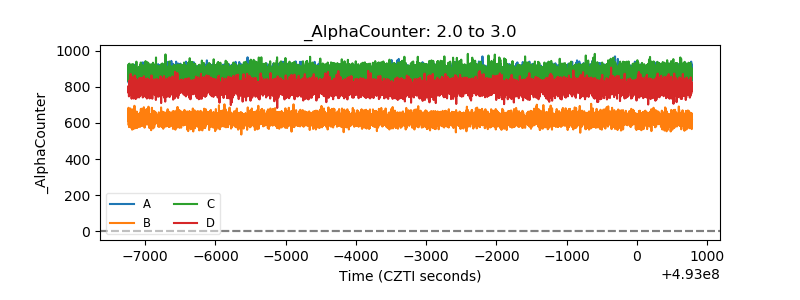 |
| _CPM_Rate | 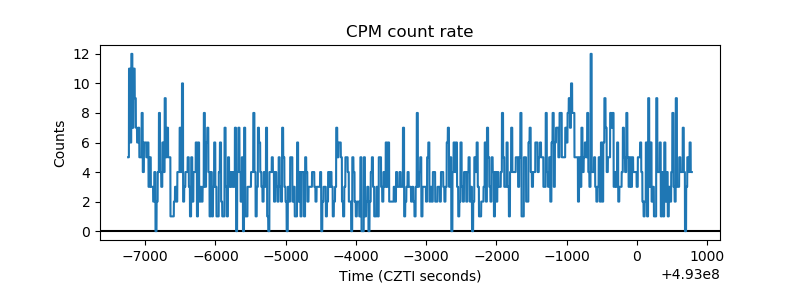 |
| CZT Counter | 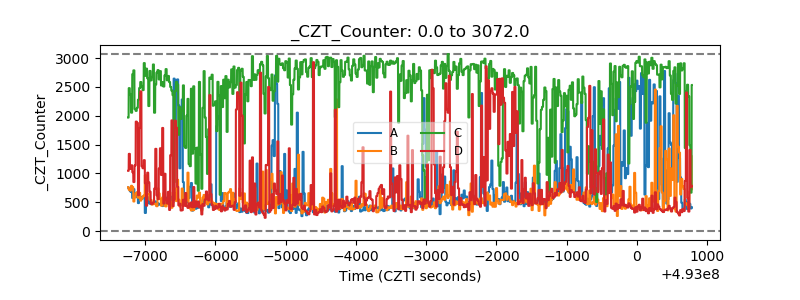 |
| +2.5 Volts monitor |  |
| +5 Volts monitor |  |
| _ROLL_ROT | 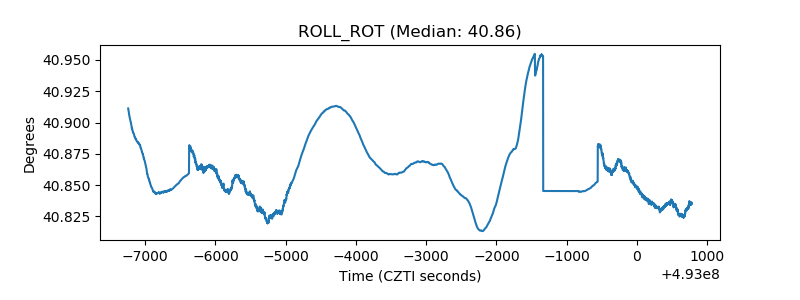 |
| _Roll_DEC | 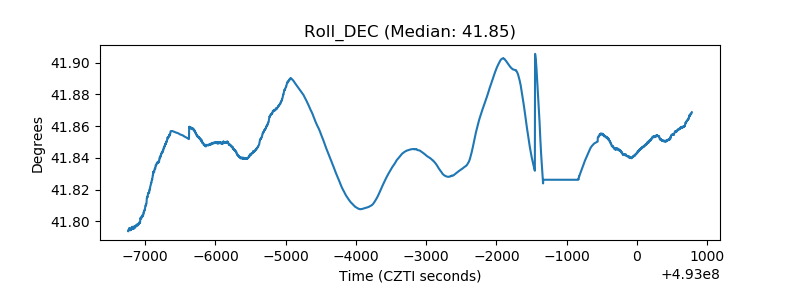 |
| _Roll_RA | 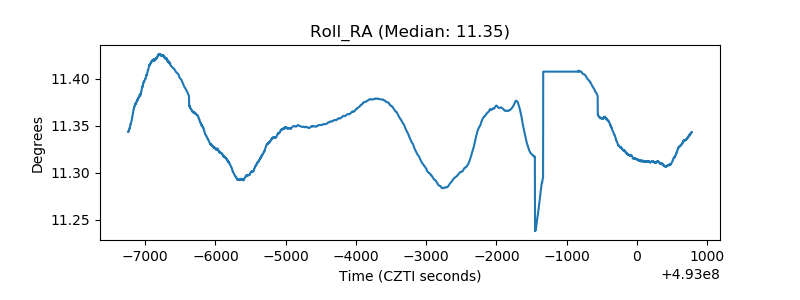 |
| Veto Counter | 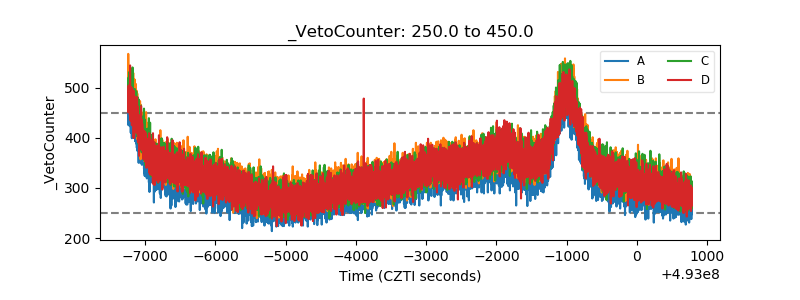 |