| Param | Original file | Final file |
|---|---|---|
| Filename | modeM0/AS1A14_002T06_9000006496_53464cztM0_level2.fits | modeM0/AS1A14_002T06_9000006496_53464cztM0_level2_quad_clean.evt |
| Size (bytes) | 2,280,888,000 | 231,520,320 |
| Size | 2.1 GB | 220.8 MB |
| Events in quadrant A | 19,353,144 | 1,474,967 |
| Events in quadrant B | 11,583,596 | 1,952,607 |
| Events in quadrant C | 38,947,530 | 728,779 |
| Events in quadrant D | 13,053,939 | 1,518,908 |
| Mode M9 | |||
|---|---|---|---|
| Quadrant | BADHDUFLAG | Total packets | Discarded packets |
| A | 0 | 10 | 0 |
| B | 0 | 10 | 0 |
| C | 0 | 10 | 0 |
| D | 0 | 10 | 0 |
| Mode SS | |||
|---|---|---|---|
| Quadrant | BADHDUFLAG | Total packets | Discarded packets |
| A | 0 | 392 | 0 |
| B | 0 | 392 | 0 |
| C | 0 | 392 | 0 |
| D | 0 | 392 | 0 |
| Mode M0 | |||
|---|---|---|---|
| Quadrant | BADHDUFLAG | Total packets | Discarded packets |
| A | 0 | 71167 | 2 |
| B | 0 | 48107 | 2 |
| C | 0 | 128622 | 2 |
| D | 0 | 53105 | 2 |
| Quadrant | Total seconds | Saturated seconds | Saturation percentage |
|---|---|---|---|
| A | 19354 | 3721 | 19.226000% |
| B | 19355 | 507 | 2.619478% |
| C | 19355 | 11800 | 60.966159% |
| D | 19355 | 1119 | 5.781452% |
Noise dominated data is calculated using 1-second bins in cleaned event files. If a bin has >2000 counts, and if more than 50% of those come from <1% of pixels, then it is considered to be noise-dominated and hence unusable.
| Quadrant | # 1 sec bins | Bins with >0 counts | Bins with >2000 counts | High rate bins dominated by noise | Noise dominated (total time) | Noise dominated (detector-on time) | Marked lightcurve |
|---|---|---|---|---|---|---|---|
| A | 20379 | 19356 | 2900 | 2900 | 14.23% | 14.98% | 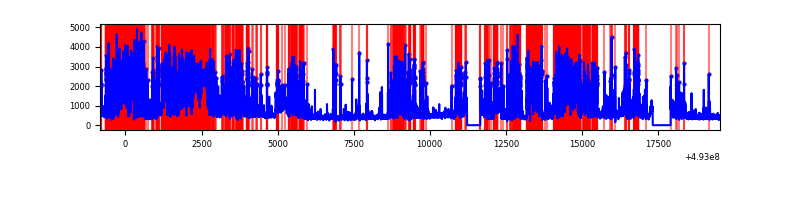 |
| B | 20380 | 19357 | 138 | 138 | 0.68% | 0.71% | 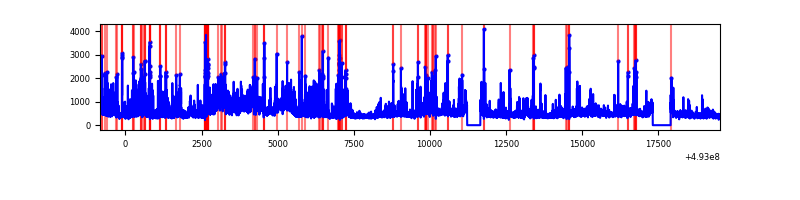 |
| C | 20380 | 19357 | 10987 | 10987 | 53.91% | 56.76% | 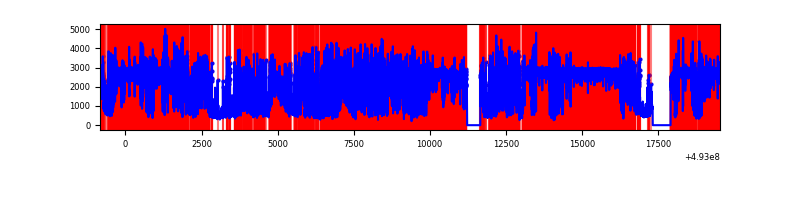 |
| D | 20380 | 19357 | 943 | 943 | 4.63% | 4.87% | 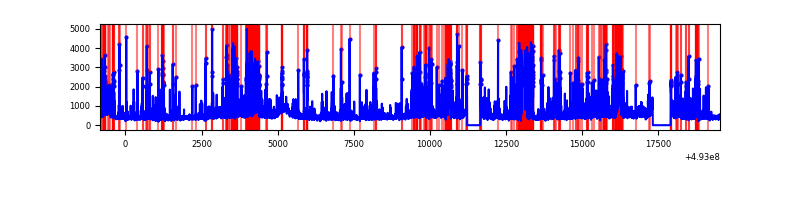 |
Top three noisy pixels from each quadrant. If the there are fewer than three noisy pixels in the level2.evt file, extra rows are filled as -1
| Pixel properties | Quadrant properties | ||||||
|---|---|---|---|---|---|---|---|
| Quadrant | DetID | PixID | Counts | Sigma | Mean | Median | Sigma |
| A | 15 | 174 | 7760617 | 16377.81 | 1928 | 1883 | 473.7 |
| A | 3 | 63 | 1779394 | 3752.12 | 1928 | 1883 | 473.7 |
| A | 3 | 62 | 1469087 | 3097.1 | 1928 | 1883 | 473.7 |
| B | 4 | 171 | 1525285 | 3429.86 | 2069 | 1991 | 444.1 |
| B | 2 | 249 | 454456 | 1018.77 | 2069 | 1991 | 444.1 |
| B | 10 | 28 | 318750 | 713.22 | 2069 | 1991 | 444.1 |
| C | 1 | 241 | 20330566 | 57243.8 | 1299 | 1288 | 355.1 |
| C | 15 | 224 | 3088618 | 8693.4 | 1299 | 1288 | 355.1 |
| C | 15 | 158 | 2965129 | 8345.67 | 1299 | 1288 | 355.1 |
| D | 8 | 176 | 1656904 | 3006.35 | 1968 | 1887 | 550.5 |
| D | 3 | 12 | 1239175 | 2247.54 | 1968 | 1887 | 550.5 |
| D | 2 | 153 | 908383 | 1646.66 | 1968 | 1887 | 550.5 |
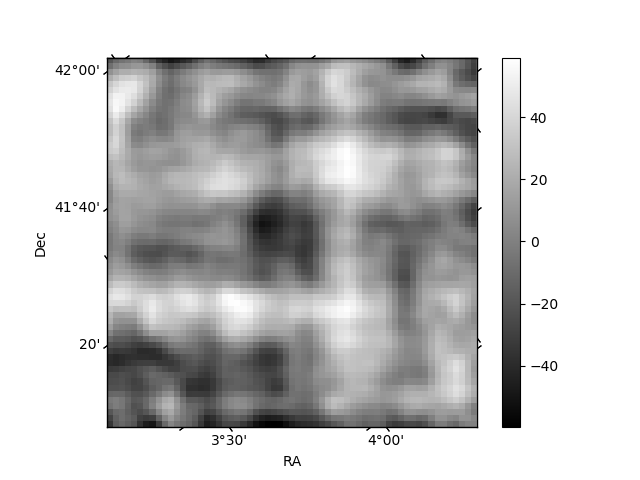
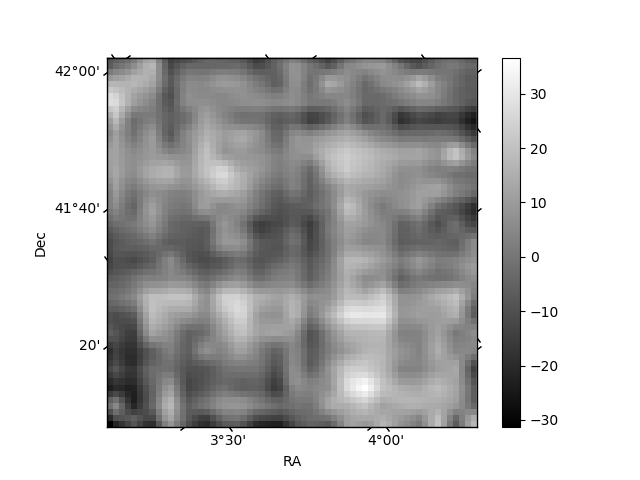
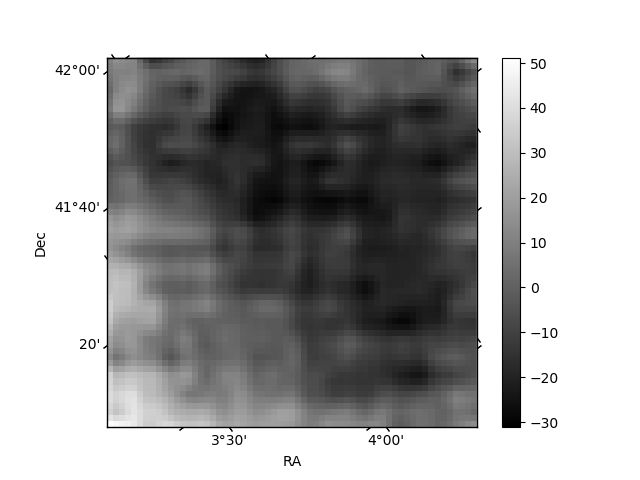
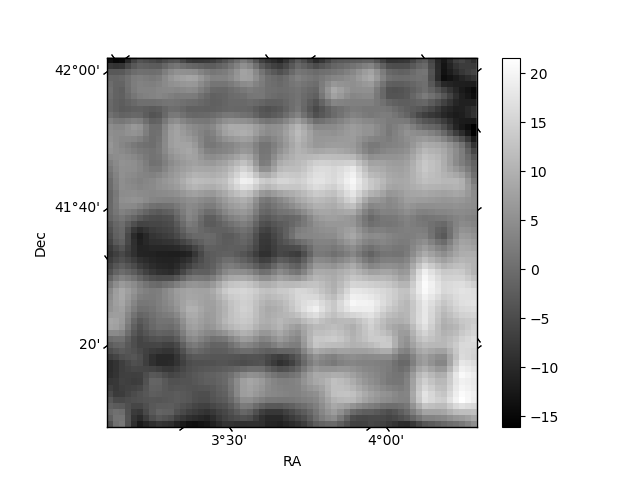
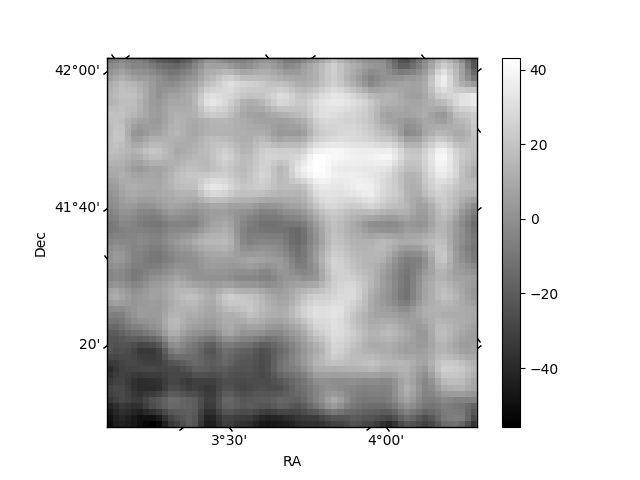
Histogram calculated using DETX and DETY for each event in the final _common_clean file
| Quadrant A | 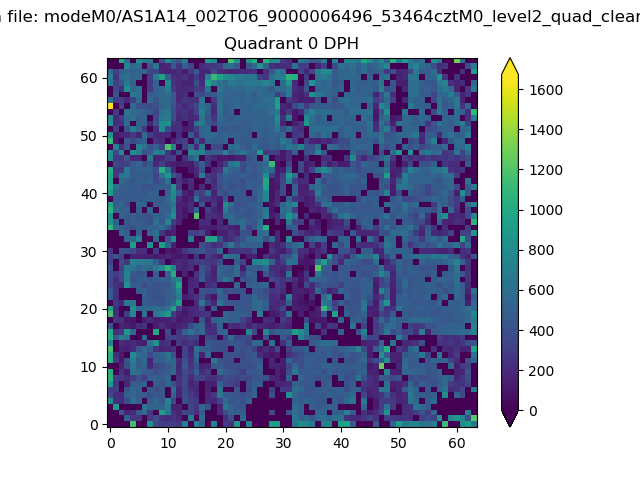 |
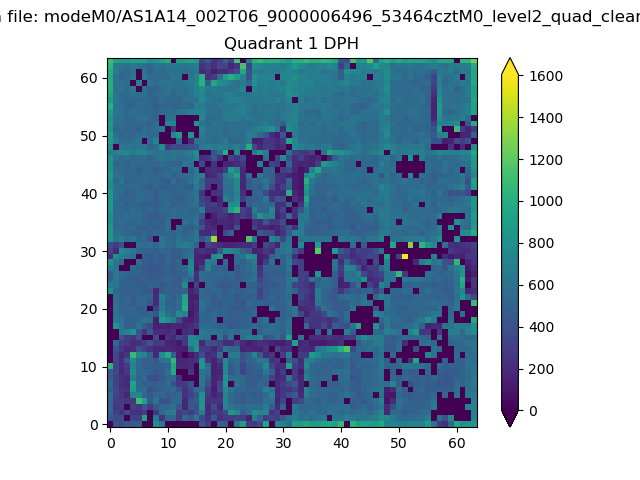 |
Quadrant B |
|---|---|---|---|
| Quadrant D | 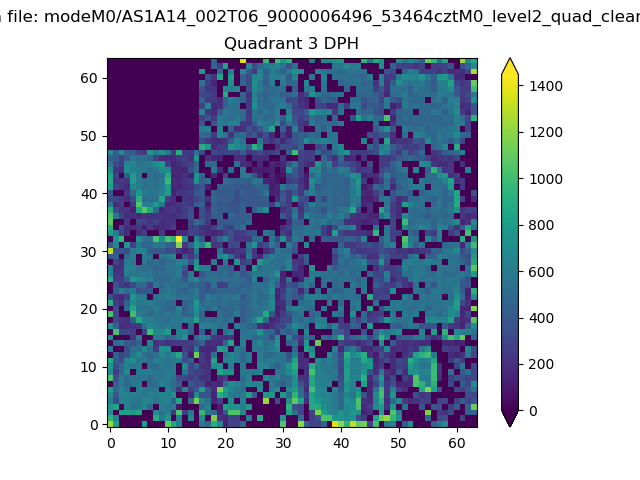 |
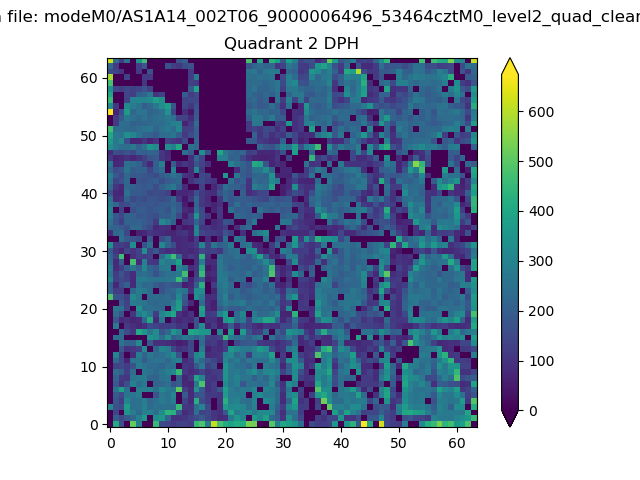 |
Quadrant C |
| Plot type | Count rate plots | Images |
|---|---|---|
| Comparison with Poisson distribution Blue bars denote a histogram of data divided into 1 sec bins. Red curve is a Poisson curve with rate = median count rate of data. |
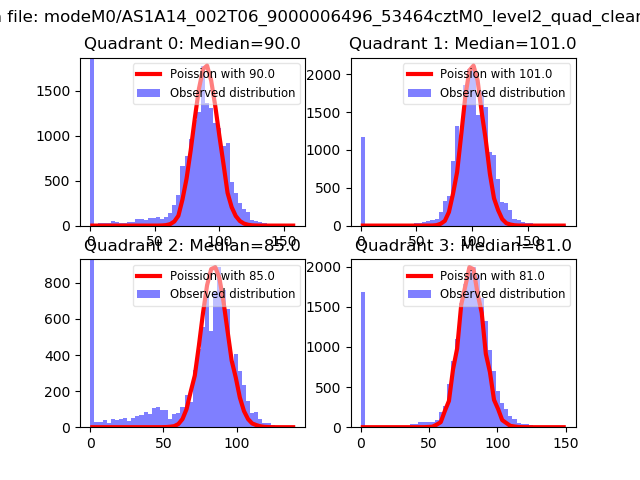 |
 |
| Quadrant-wise count rates Data is divided into 100 sec bins |
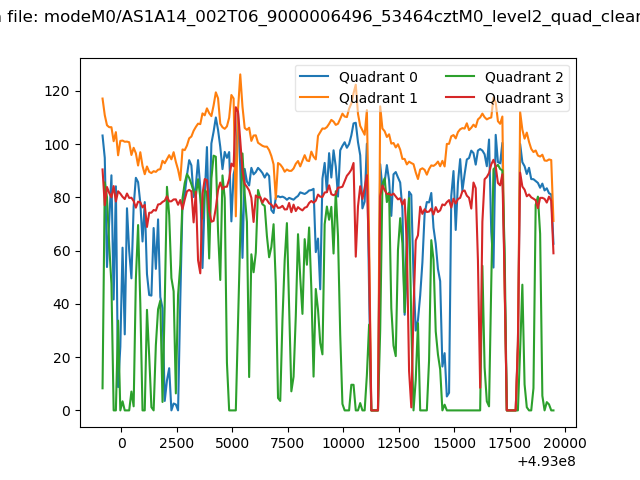 |
|
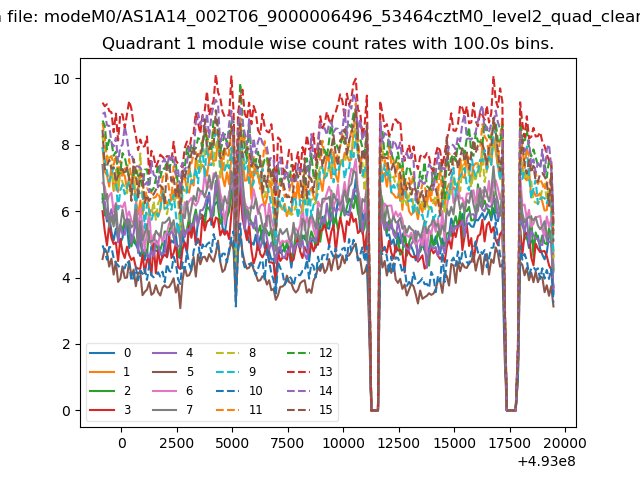
| Module-wise count rates for Quadrant A Data is divided into 100 sec bins |
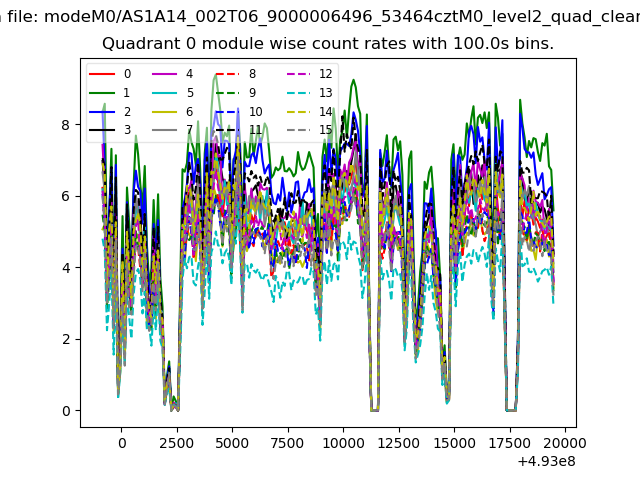 |
 |
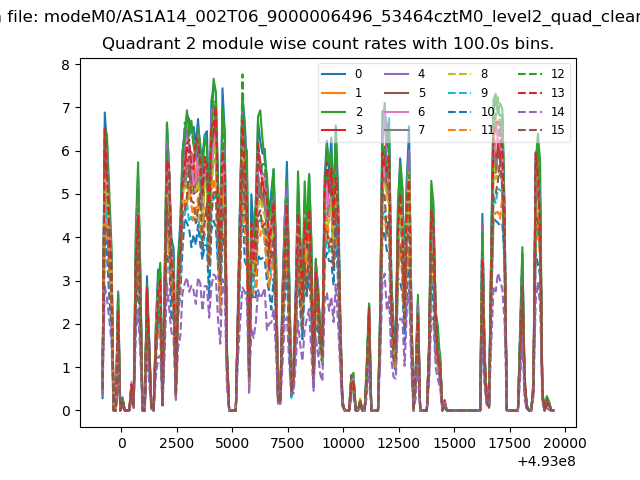
| Module-wise count rates for Quadrant B Data is divided into 100 sec bins |
 |
 |
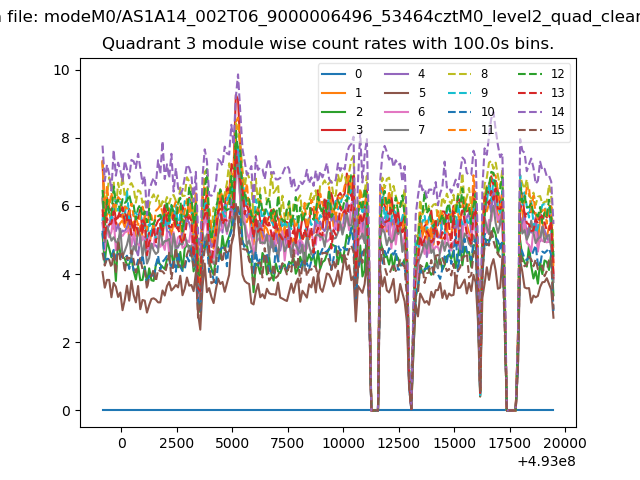
| Module-wise count rates for Quadrant C Data is divided into 100 sec bins |
 |
 |
| Module-wise count rates for Quadrant D Data is divided into 100 sec bins |
 |
 |
| Parameter | Plot |
|---|---|
| CZT HV Monitor | 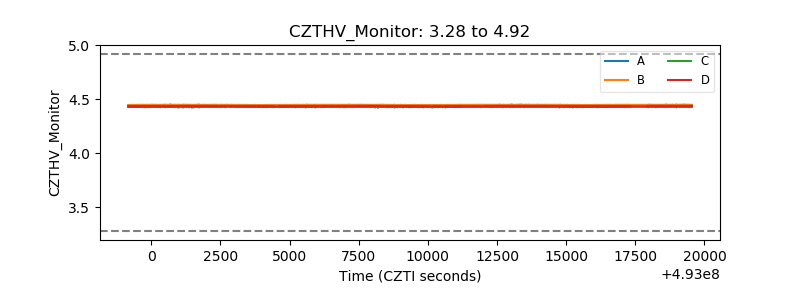 |
| D_VDD | 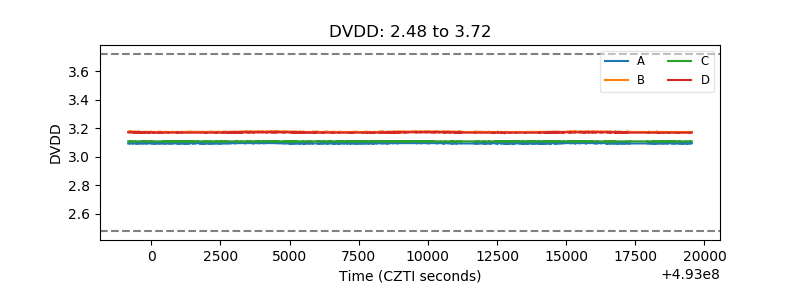 |
| Temperature 1 | 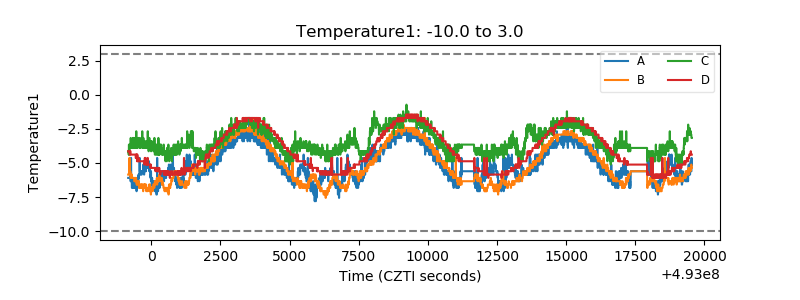 |
| Veto HV Monitor | 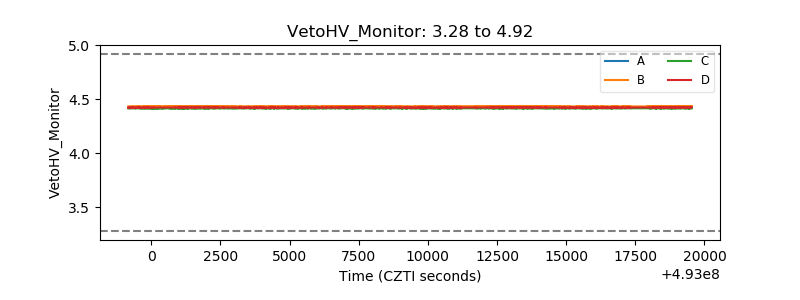 |
| Veto LLD | 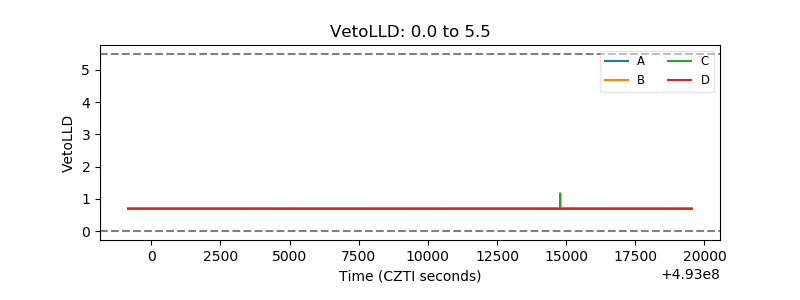 |
| Alpha Counter | 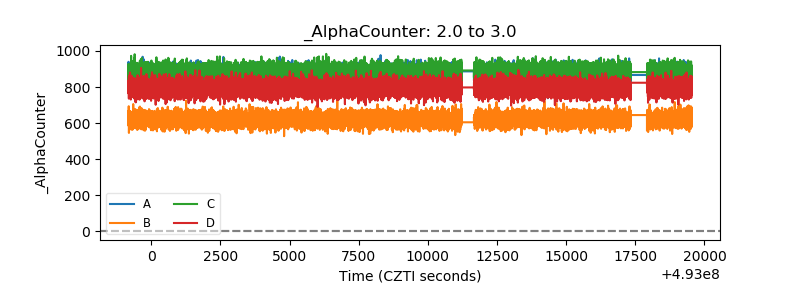 |
| _CPM_Rate | 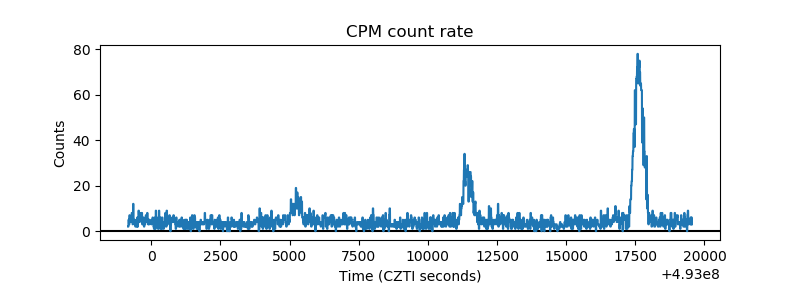 |
| CZT Counter | 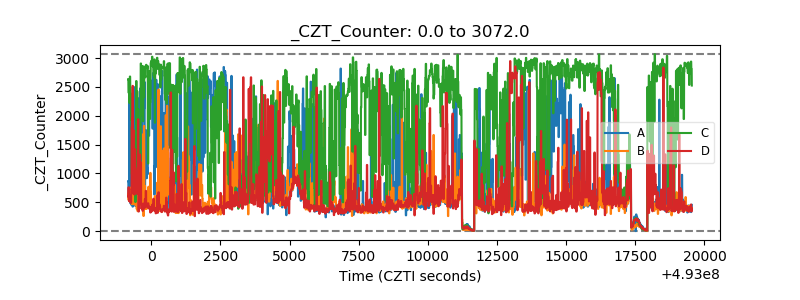 |
| +2.5 Volts monitor |  |
| +5 Volts monitor |  |
| _ROLL_ROT | 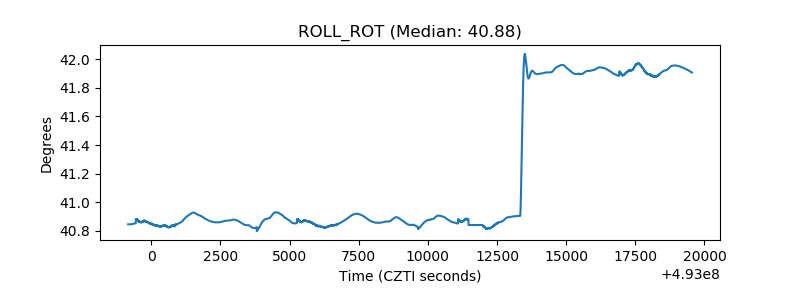 |
| _Roll_DEC | 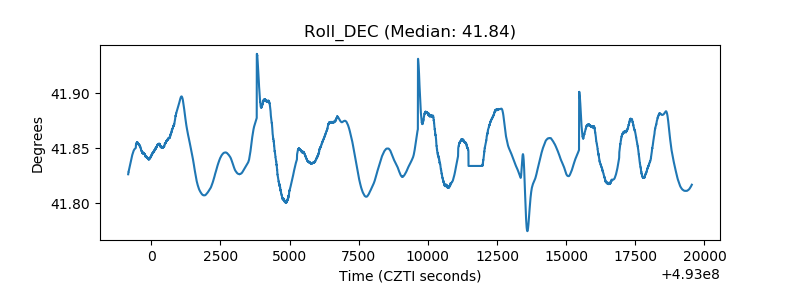 |
| _Roll_RA | 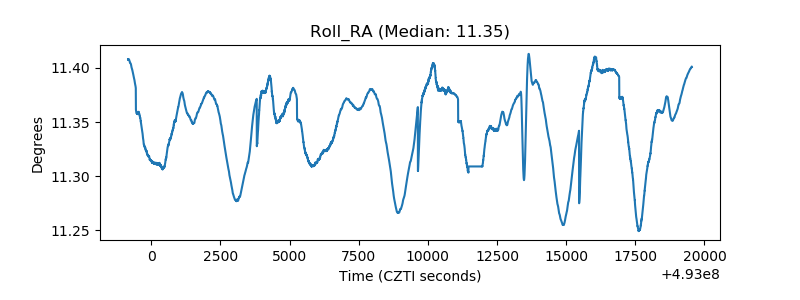 |
| Veto Counter | 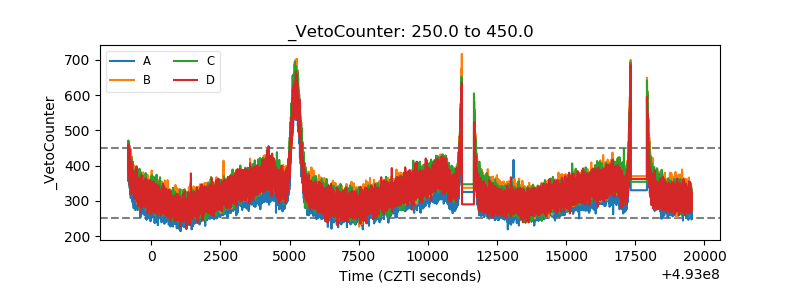 |