| Param | Original file | Final file |
|---|---|---|
| Filename | modeM0/AS1A14_002T06_9000006496_53468cztM0_level2.fits | modeM0/AS1A14_002T06_9000006496_53468cztM0_level2_quad_clean.evt |
| Size (bytes) | 772,735,680 | 81,233,280 |
| Size | 736.9 MB | 77.5 MB |
| Events in quadrant A | 8,953,461 | 467,149 |
| Events in quadrant B | 3,421,134 | 681,016 |
| Events in quadrant C | 11,614,655 | 314,668 |
| Events in quadrant D | 4,124,295 | 554,623 |
| Mode M9 | |||
|---|---|---|---|
| Quadrant | BADHDUFLAG | Total packets | Discarded packets |
| A | 0 | 11 | 0 |
| B | 0 | 11 | 0 |
| C | 0 | 11 | 0 |
| D | 0 | 11 | 0 |
| Mode SS | |||
|---|---|---|---|
| Quadrant | BADHDUFLAG | Total packets | Discarded packets |
| A | 0 | 128 | 0 |
| B | 0 | 128 | 0 |
| C | 0 | 128 | 0 |
| D | 0 | 128 | 0 |
| Mode M0 | |||
|---|---|---|---|
| Quadrant | BADHDUFLAG | Total packets | Discarded packets |
| A | 0 | 30991 | 5 |
| B | 0 | 14538 | 1 |
| C | 0 | 38713 | 1 |
| D | 0 | 16619 | 1 |
| Quadrant | Total seconds | Saturated seconds | Saturation percentage |
|---|---|---|---|
| A | 6336 | 2039 | 32.181187% |
| B | 6337 | 132 | 2.083005% |
| C | 6337 | 3301 | 52.090895% |
| D | 6337 | 193 | 3.045605% |
Noise dominated data is calculated using 1-second bins in cleaned event files. If a bin has >2000 counts, and if more than 50% of those come from <1% of pixels, then it is considered to be noise-dominated and hence unusable.
| Quadrant | # 1 sec bins | Bins with >0 counts | Bins with >2000 counts | High rate bins dominated by noise | Noise dominated (total time) | Noise dominated (detector-on time) | Marked lightcurve |
|---|---|---|---|---|---|---|---|
| A | 7416 | 6337 | 1741 | 1741 | 23.48% | 27.47% | 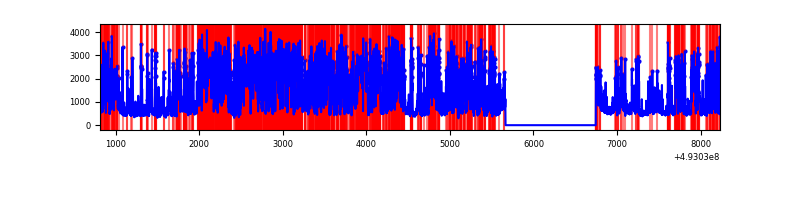 |
| B | 7417 | 6338 | 45 | 45 | 0.61% | 0.71% | 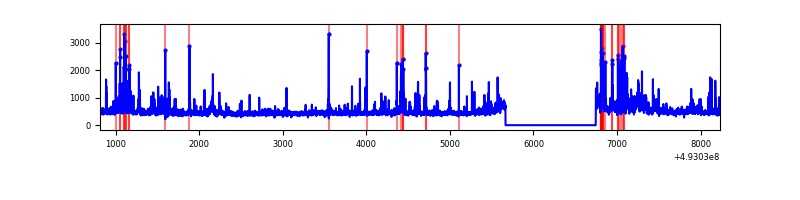 |
| C | 7417 | 6337 | 3100 | 3100 | 41.80% | 48.92% | 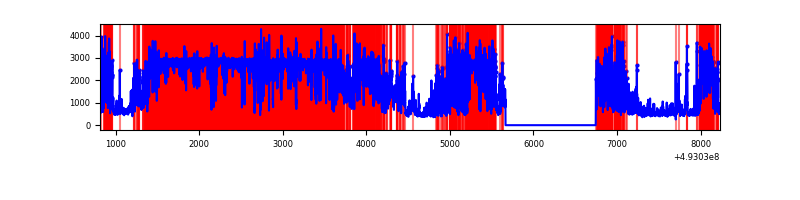 |
| D | 7417 | 6338 | 199 | 199 | 2.68% | 3.14% | 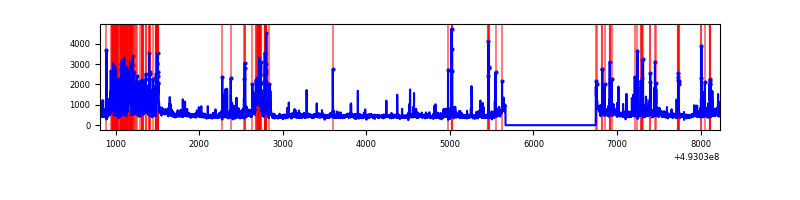 |
Top three noisy pixels from each quadrant. If the there are fewer than three noisy pixels in the level2.evt file, extra rows are filled as -1
| Pixel properties | Quadrant properties | ||||||
|---|---|---|---|---|---|---|---|
| Quadrant | DetID | PixID | Counts | Sigma | Mean | Median | Sigma |
| A | 3 | 62 | 3804066 | 25100.13 | 614 | 600 | 151.5 |
| A | 3 | 63 | 1202643 | 7932.62 | 614 | 600 | 151.5 |
| A | 15 | 174 | 905483 | 5971.57 | 614 | 600 | 151.5 |
| B | 2 | 249 | 195349 | 1305.39 | 696 | 672 | 149.1 |
| B | 5 | 185 | 163788 | 1093.76 | 696 | 672 | 149.1 |
| B | 4 | 81 | 62764 | 416.35 | 696 | 672 | 149.1 |
| C | 1 | 241 | 6959684 | 51781.43 | 485 | 478 | 134.4 |
| C | 15 | 224 | 1407317 | 10467.88 | 485 | 478 | 134.4 |
| C | 15 | 178 | 807738 | 6006.58 | 485 | 478 | 134.4 |
| D | 2 | 249 | 488031 | 2539.39 | 677 | 649 | 191.9 |
| D | 3 | 12 | 478891 | 2491.77 | 677 | 649 | 191.9 |
| D | 8 | 176 | 199035 | 1033.64 | 677 | 649 | 191.9 |
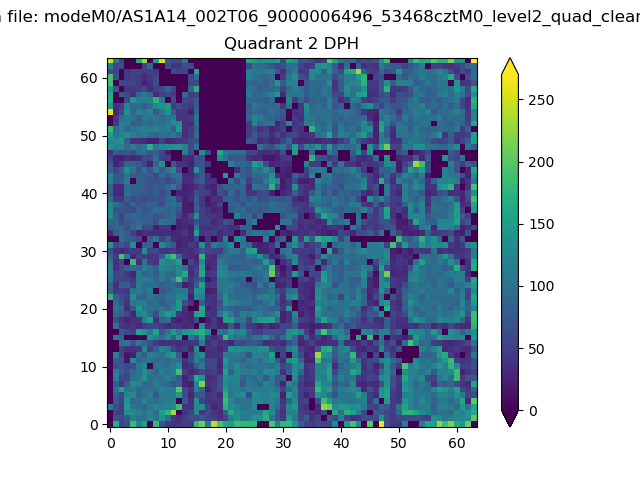
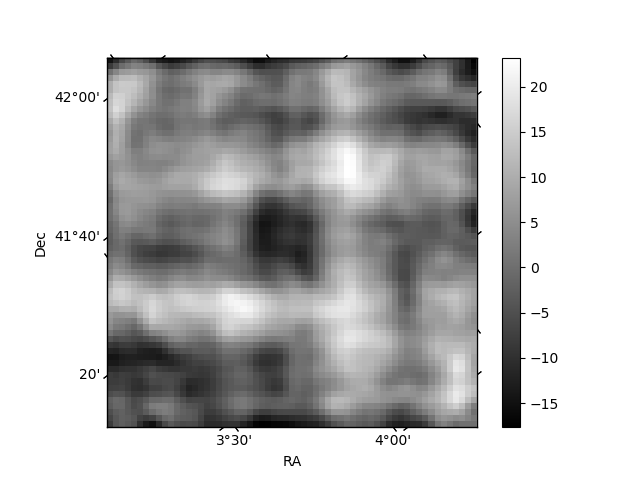
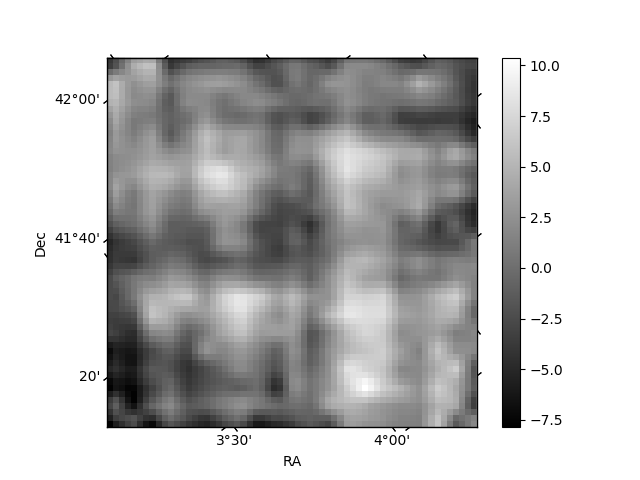
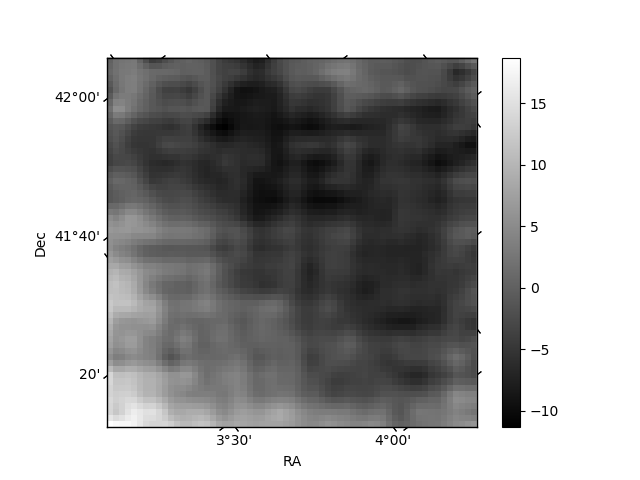
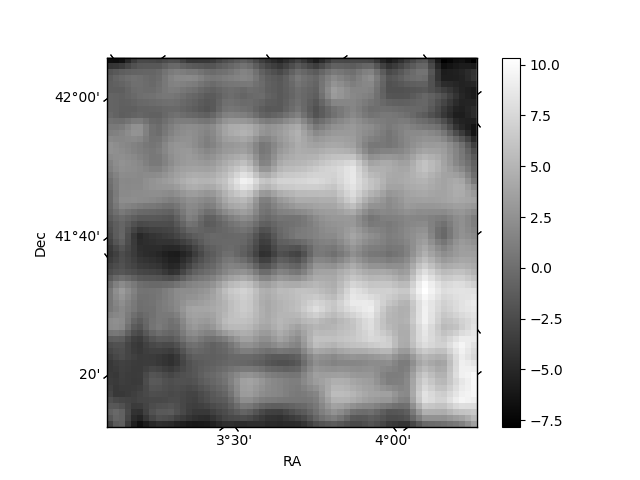
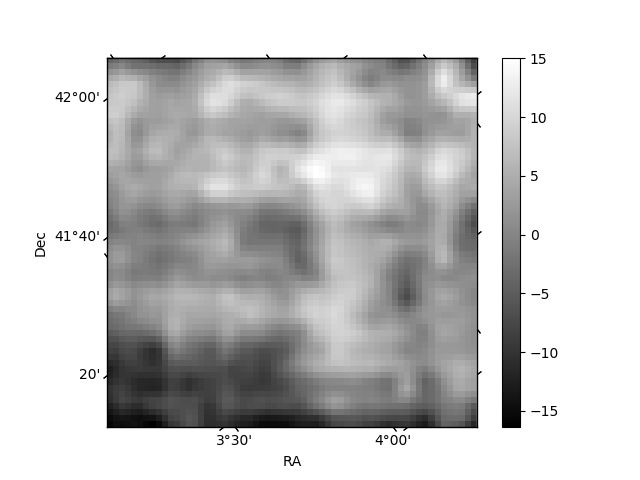
Histogram calculated using DETX and DETY for each event in the final _common_clean file
| Quadrant A | 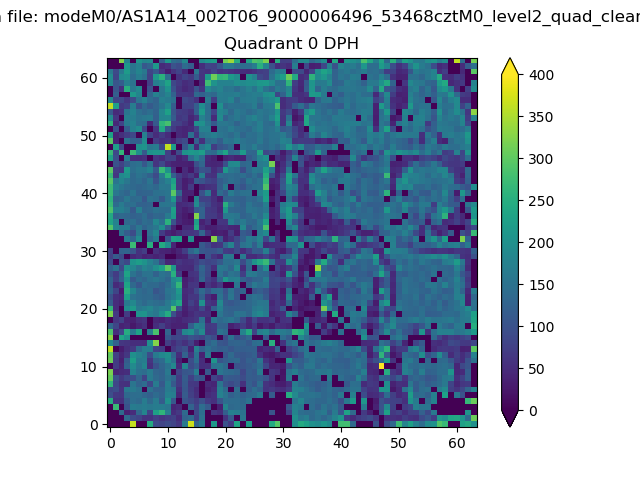 |
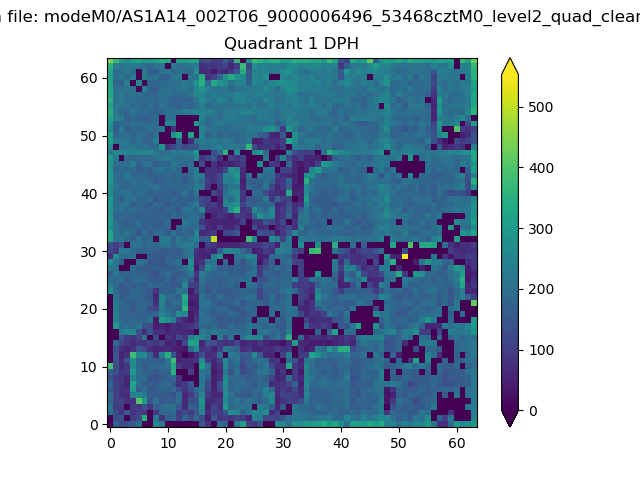 |
Quadrant B |
|---|---|---|---|
| Quadrant D | 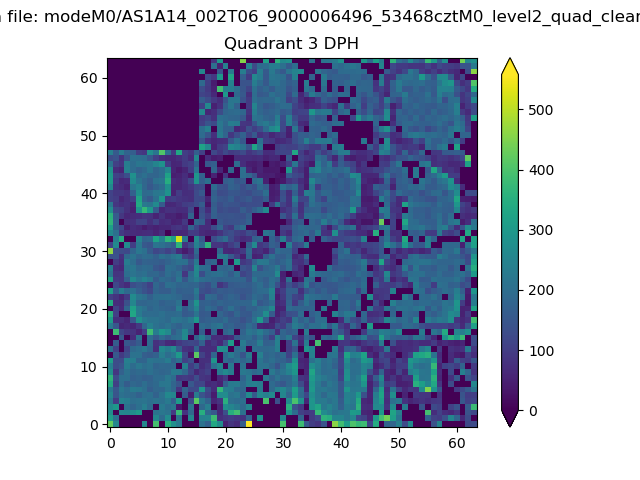 |
 |
Quadrant C |
| Plot type | Count rate plots | Images |
|---|---|---|
| Comparison with Poisson distribution Blue bars denote a histogram of data divided into 1 sec bins. Red curve is a Poisson curve with rate = median count rate of data. |
 |
 |
| Quadrant-wise count rates Data is divided into 100 sec bins |
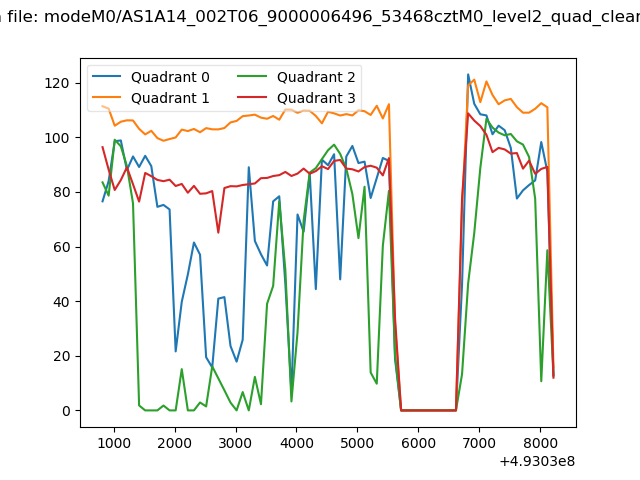 |
|
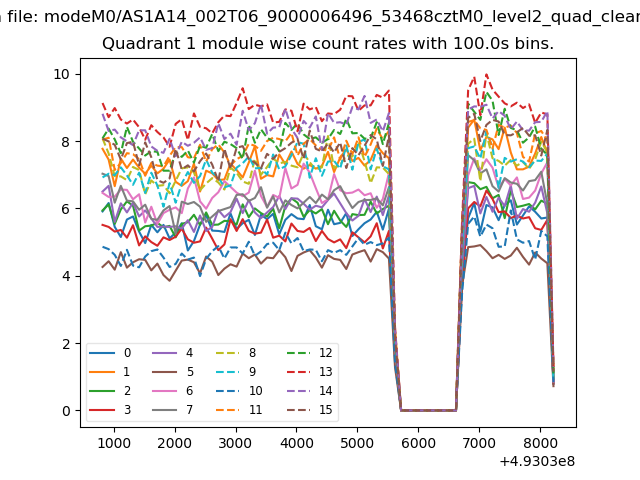
| Module-wise count rates for Quadrant A Data is divided into 100 sec bins |
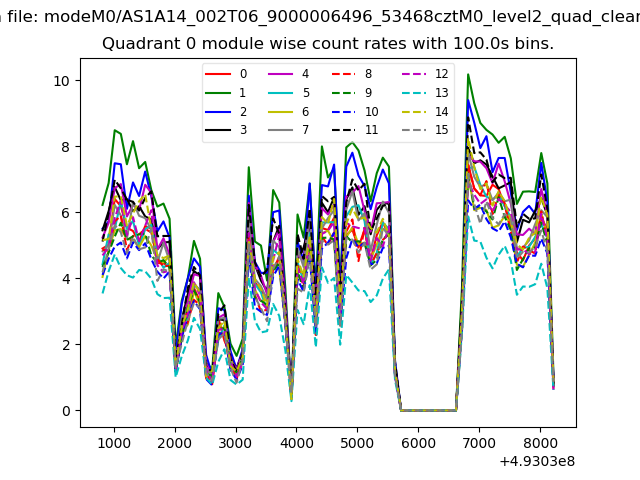 |
 |
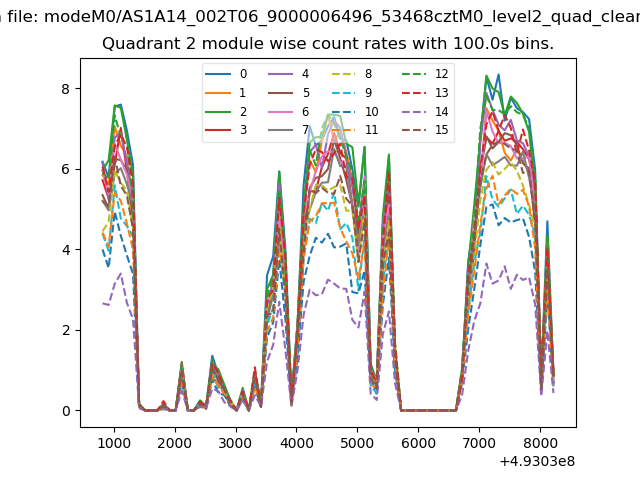
| Module-wise count rates for Quadrant B Data is divided into 100 sec bins |
 |
 |
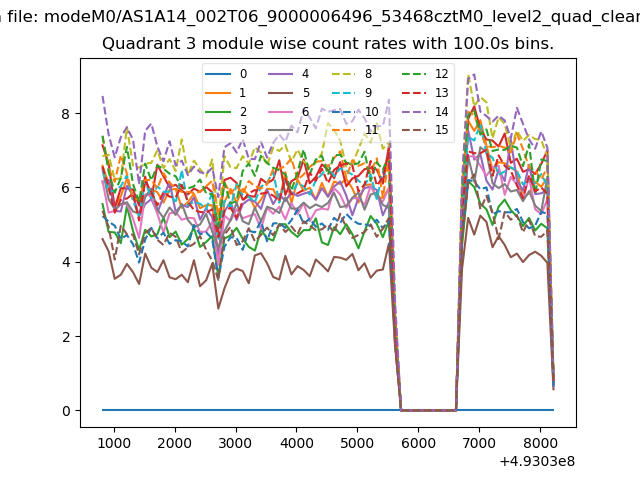
| Module-wise count rates for Quadrant C Data is divided into 100 sec bins |
 |
 |
| Module-wise count rates for Quadrant D Data is divided into 100 sec bins |
 |
 |
| Parameter | Plot |
|---|---|
| CZT HV Monitor | 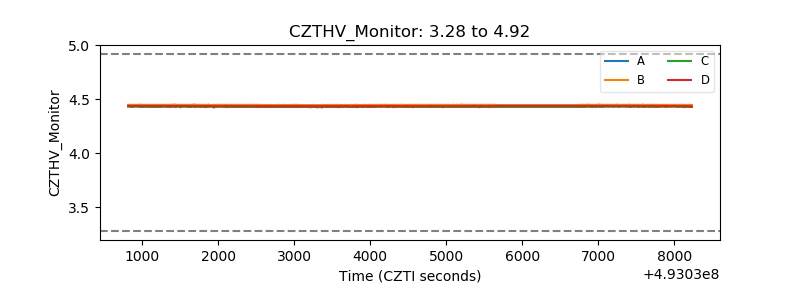 |
| D_VDD | 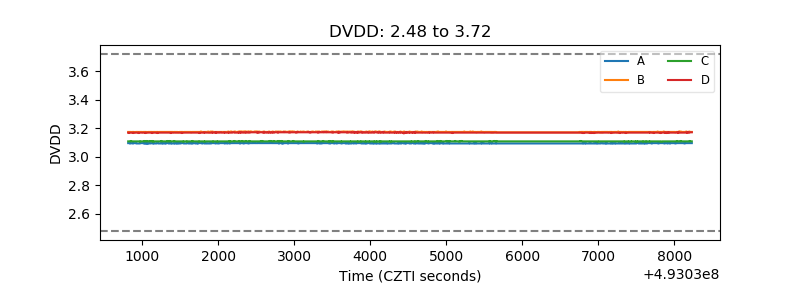 |
| Temperature 1 | 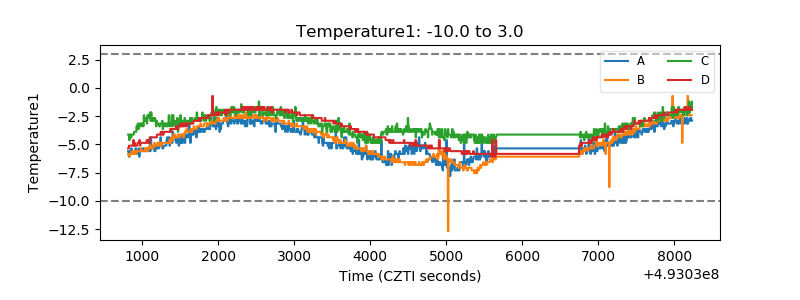 |
| Veto HV Monitor | 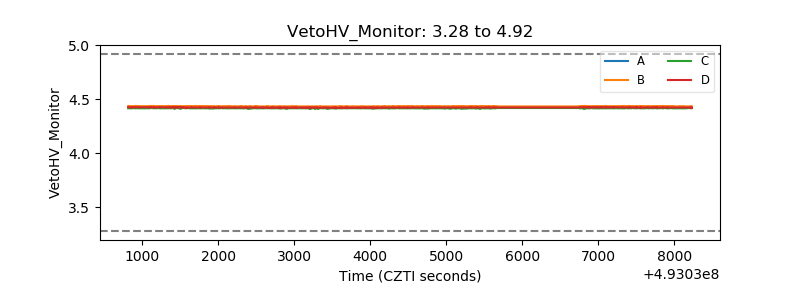 |
| Veto LLD | 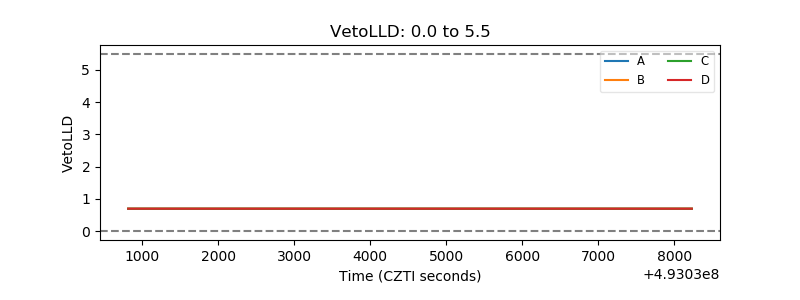 |
| Alpha Counter | 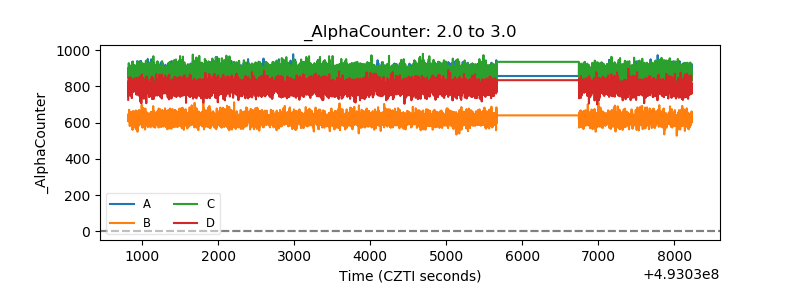 |
| _CPM_Rate | 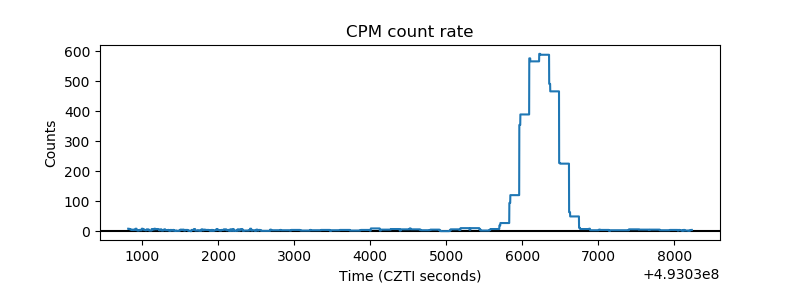 |
| CZT Counter | 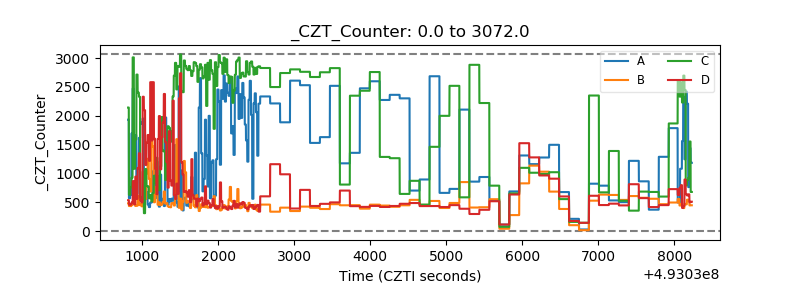 |
| +2.5 Volts monitor |  |
| +5 Volts monitor |  |
| _ROLL_ROT | 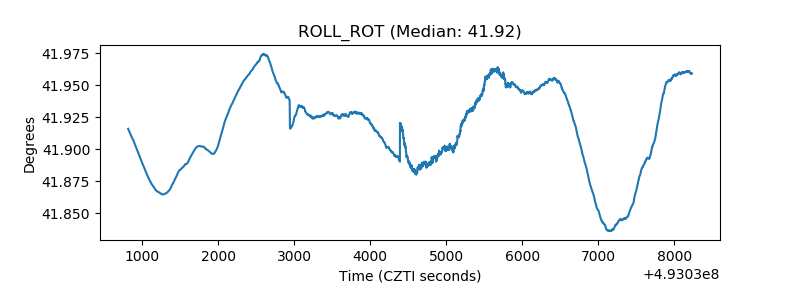 |
| _Roll_DEC | 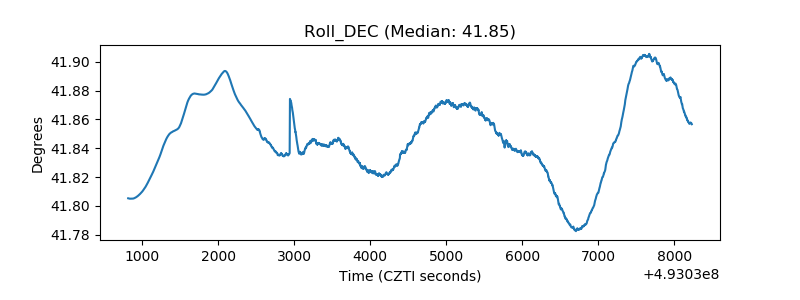 |
| _Roll_RA | 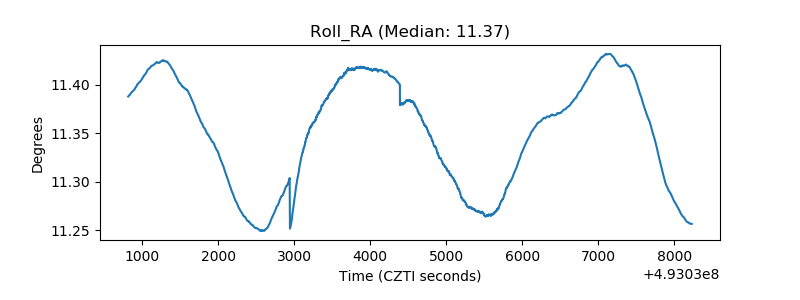 |
| Veto Counter | 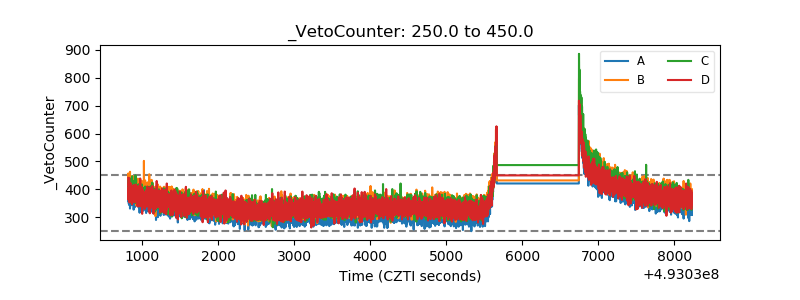 |