| Param | Original file | Final file |
|---|---|---|
| Filename | modeM0/AS1A14_002T06_9000006496_53471cztM0_level2.fits | modeM0/AS1A14_002T06_9000006496_53471cztM0_level2_quad_clean.evt |
| Size (bytes) | 806,696,640 | 83,059,200 |
| Size | 769.3 MB | 79.2 MB |
| Events in quadrant A | 8,144,780 | 531,660 |
| Events in quadrant B | 3,521,262 | 729,310 |
| Events in quadrant C | 14,009,665 | 215,786 |
| Events in quadrant D | 3,688,418 | 590,522 |
| Mode M9 | |||
|---|---|---|---|
| Quadrant | BADHDUFLAG | Total packets | Discarded packets |
| A | 0 | 20 | 0 |
| B | 0 | 21 | 0 |
| C | 0 | 21 | 0 |
| D | 0 | 21 | 0 |
| Mode SS | |||
|---|---|---|---|
| Quadrant | BADHDUFLAG | Total packets | Discarded packets |
| A | 0 | 130 | 0 |
| B | 0 | 130 | 0 |
| C | 0 | 130 | 0 |
| D | 0 | 130 | 0 |
| Mode M0 | |||
|---|---|---|---|
| Quadrant | BADHDUFLAG | Total packets | Discarded packets |
| A | 0 | 28637 | 2 |
| B | 0 | 14711 | 2 |
| C | 0 | 45821 | 3 |
| D | 0 | 15391 | 2 |
| Quadrant | Total seconds | Saturated seconds | Saturation percentage |
|---|---|---|---|
| A | 6419 | 1717 | 26.748715% |
| B | 6419 | 151 | 2.352391% |
| C | 6418 | 4481 | 69.819258% |
| D | 6418 | 125 | 1.947647% |
Noise dominated data is calculated using 1-second bins in cleaned event files. If a bin has >2000 counts, and if more than 50% of those come from <1% of pixels, then it is considered to be noise-dominated and hence unusable.
| Quadrant | # 1 sec bins | Bins with >0 counts | Bins with >2000 counts | High rate bins dominated by noise | Noise dominated (total time) | Noise dominated (detector-on time) | Marked lightcurve |
|---|---|---|---|---|---|---|---|
| A | 7609 | 6420 | 1339 | 1339 | 17.60% | 20.86% | 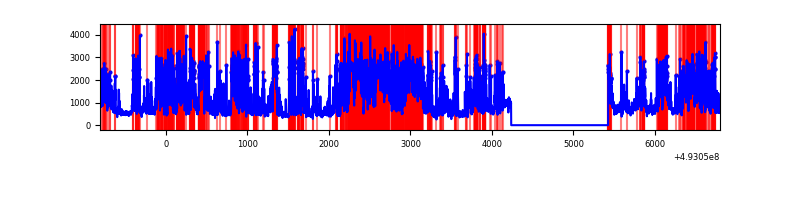 |
| B | 7609 | 6419 | 22 | 22 | 0.29% | 0.34% | 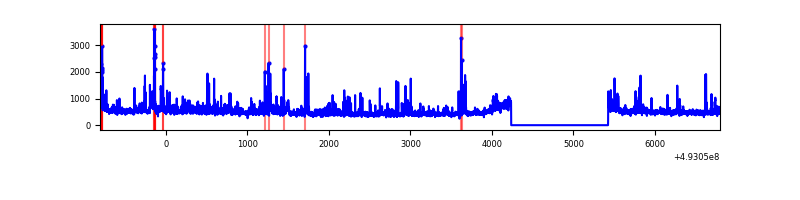 |
| C | 7608 | 6418 | 4227 | 4227 | 55.56% | 65.86% | 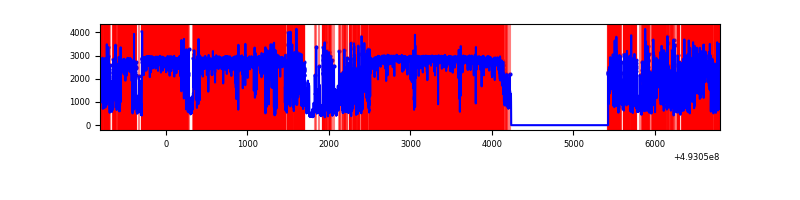 |
| D | 7608 | 6418 | 67 | 67 | 0.88% | 1.04% | 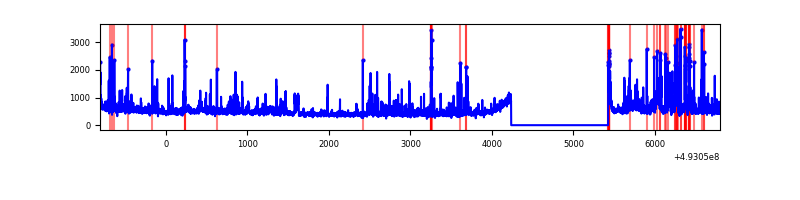 |
Top three noisy pixels from each quadrant. If the there are fewer than three noisy pixels in the level2.evt file, extra rows are filled as -1
| Pixel properties | Quadrant properties | ||||||
|---|---|---|---|---|---|---|---|
| Quadrant | DetID | PixID | Counts | Sigma | Mean | Median | Sigma |
| A | 15 | 174 | 2241656 | 13380.32 | 678 | 663 | 167.5 |
| A | 3 | 63 | 2066421 | 12334.04 | 678 | 663 | 167.5 |
| A | 3 | 62 | 1065964 | 6360.6 | 678 | 663 | 167.5 |
| B | 4 | 171 | 222750 | 1412.08 | 736 | 709 | 157.2 |
| B | 4 | 216 | 68720 | 432.52 | 736 | 709 | 157.2 |
| B | 8 | 234 | 56729 | 356.26 | 736 | 709 | 157.2 |
| C | 1 | 241 | 9348756 | 82837.03 | 414 | 411 | 112.9 |
| C | 15 | 224 | 1317890 | 11674.37 | 414 | 411 | 112.9 |
| C | 7 | 64 | 693194 | 6138.85 | 414 | 411 | 112.9 |
| D | 2 | 249 | 204286 | 1005.71 | 719 | 690 | 202.4 |
| D | 3 | 12 | 202604 | 997.4 | 719 | 690 | 202.4 |
| D | 8 | 176 | 127731 | 627.55 | 719 | 690 | 202.4 |
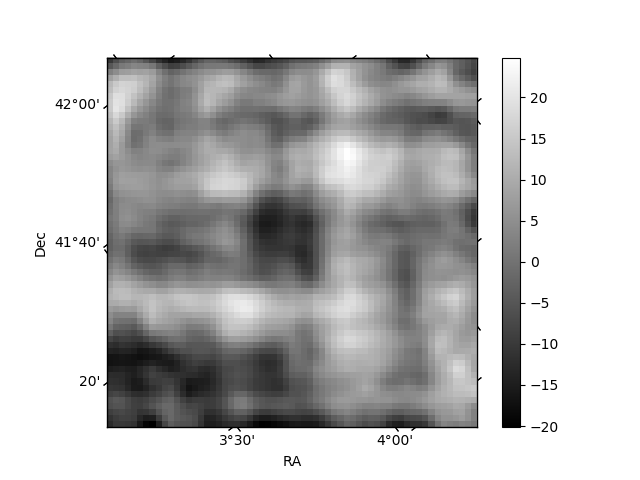
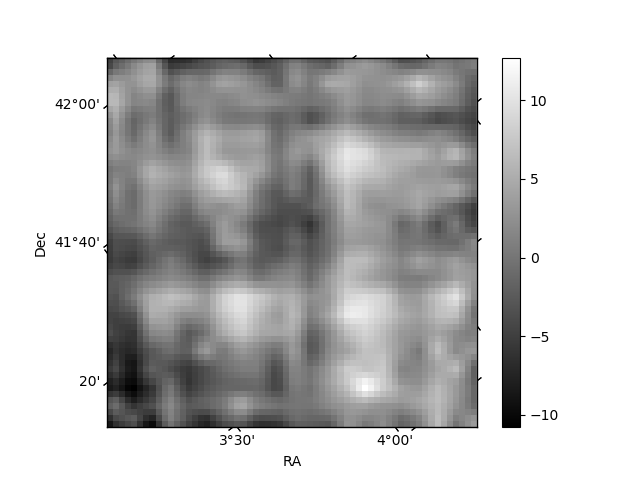
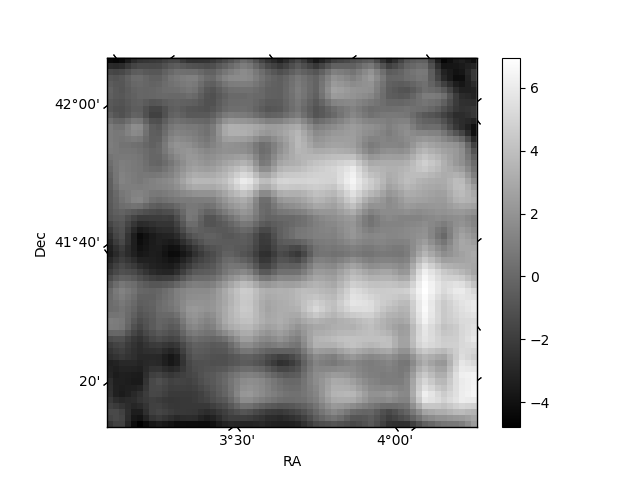
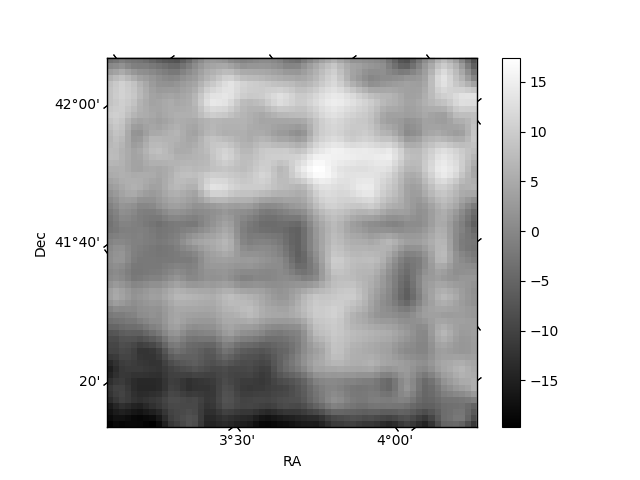
Histogram calculated using DETX and DETY for each event in the final _common_clean file
| Quadrant A | 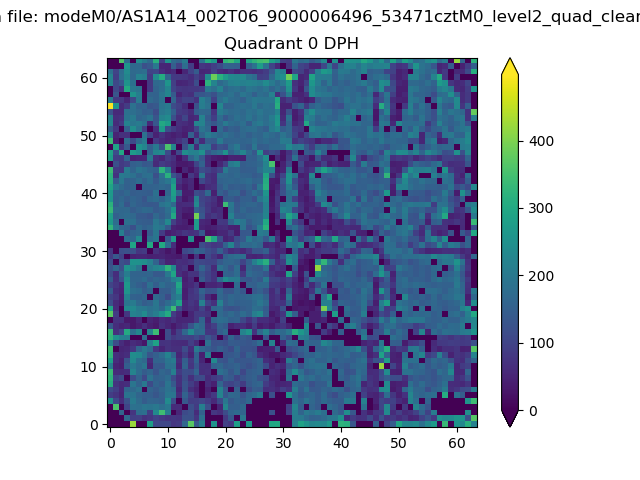 |
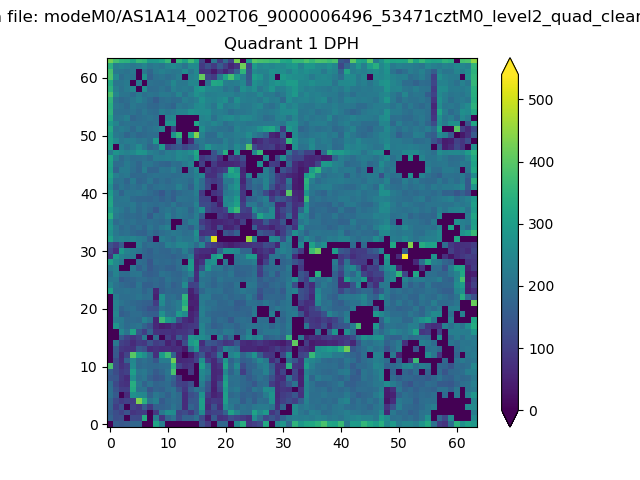 |
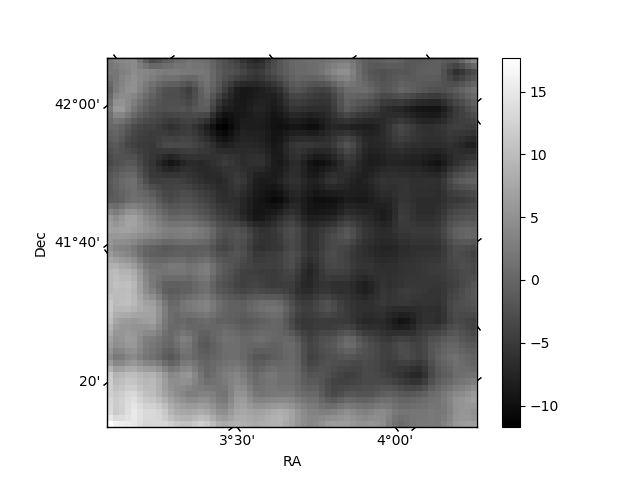
Quadrant B |
|---|---|---|---|
| Quadrant D | 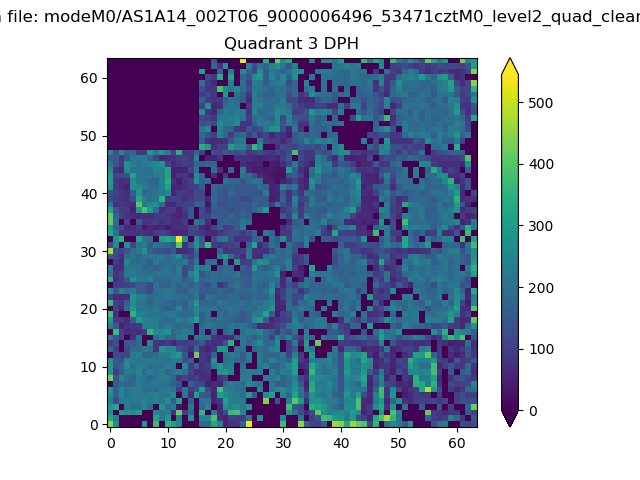 |
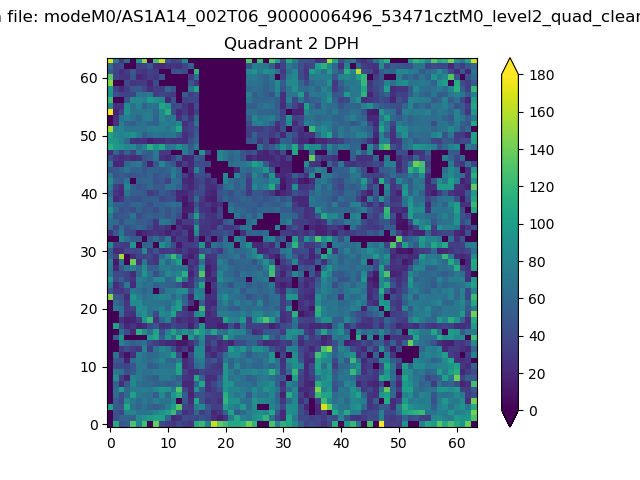 |
Quadrant C |
| Plot type | Count rate plots | Images |
|---|---|---|
| Comparison with Poisson distribution Blue bars denote a histogram of data divided into 1 sec bins. Red curve is a Poisson curve with rate = median count rate of data. |
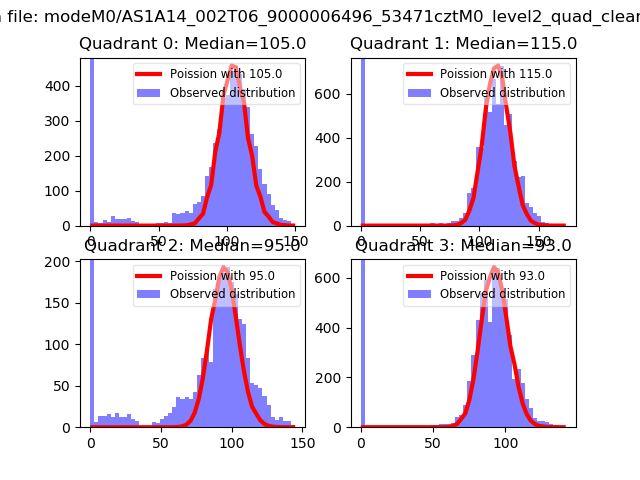 |
 |
| Quadrant-wise count rates Data is divided into 100 sec bins |
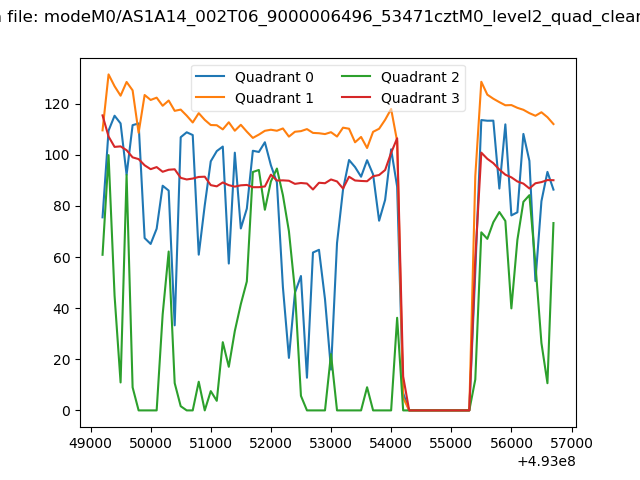 |
|
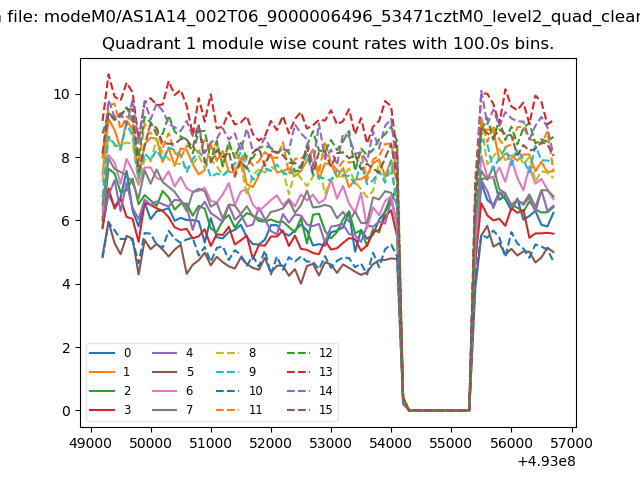
| Module-wise count rates for Quadrant A Data is divided into 100 sec bins |
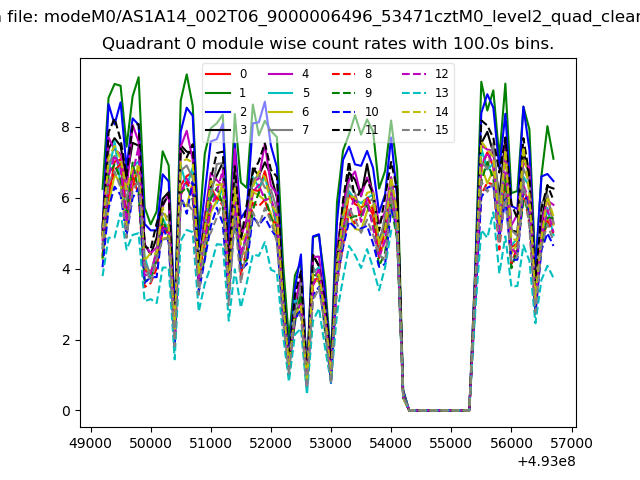 |
 |
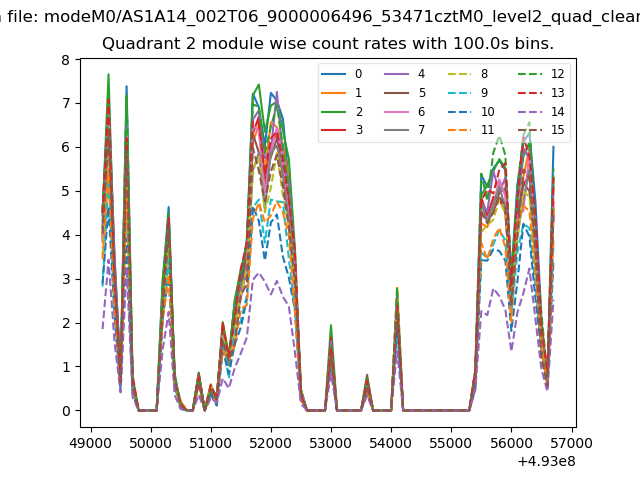
| Module-wise count rates for Quadrant B Data is divided into 100 sec bins |
 |
 |
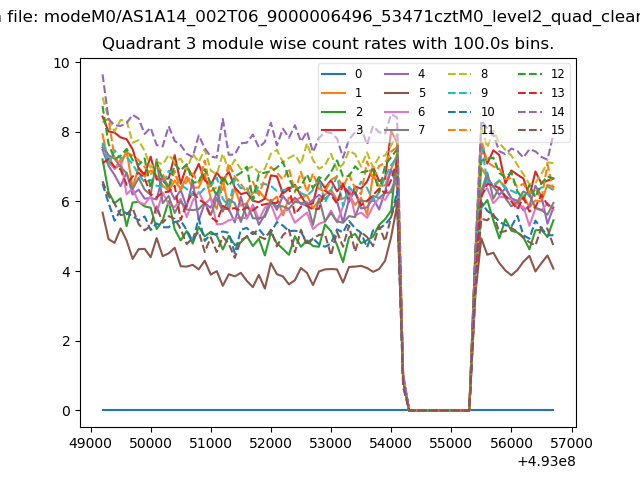
| Module-wise count rates for Quadrant C Data is divided into 100 sec bins |
 |
 |
| Module-wise count rates for Quadrant D Data is divided into 100 sec bins |
 |
 |
| Parameter | Plot |
|---|---|
| CZT HV Monitor | 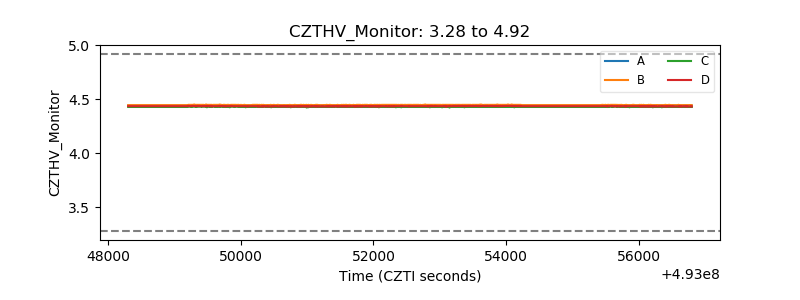 |
| D_VDD | 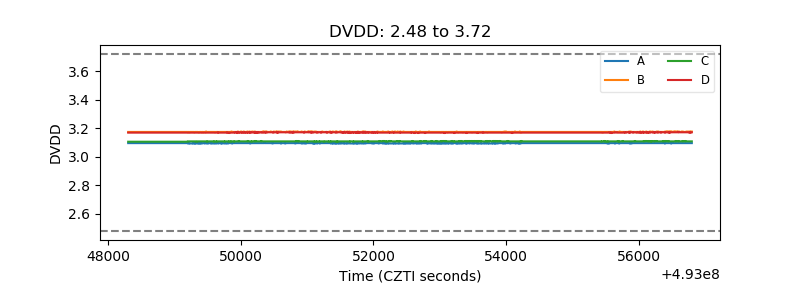 |
| Temperature 1 | 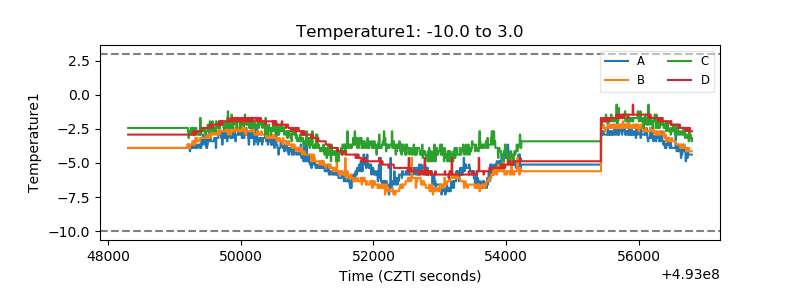 |
| Veto HV Monitor | 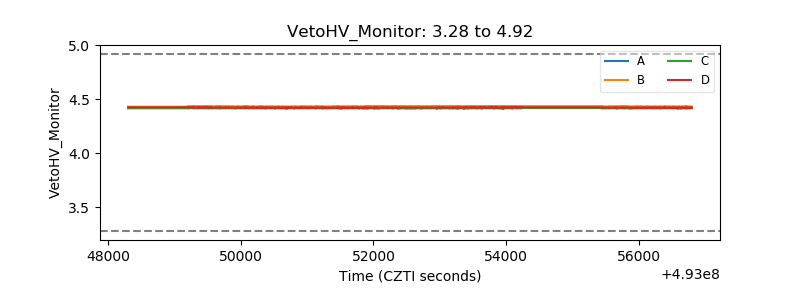 |
| Veto LLD | 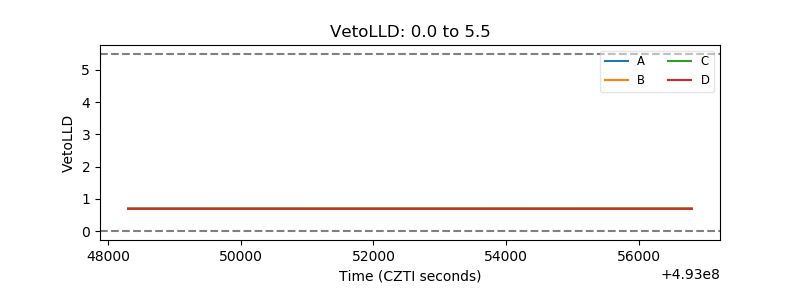 |
| Alpha Counter | 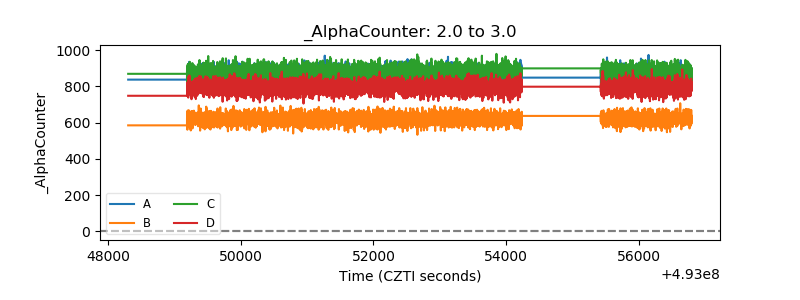 |
| _CPM_Rate | 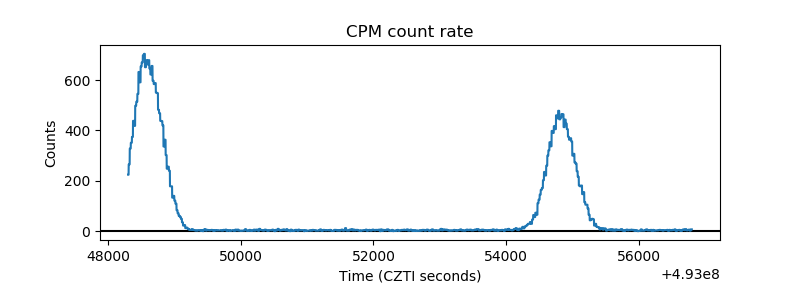 |
| CZT Counter | 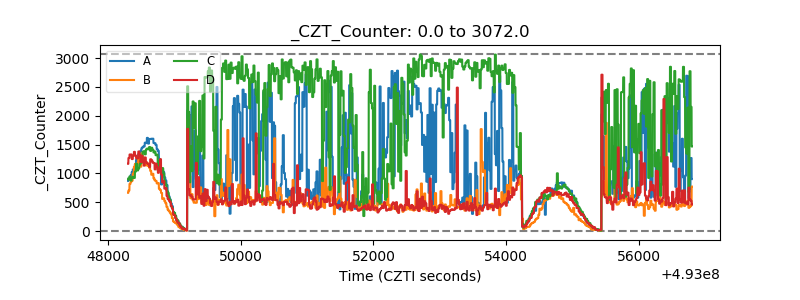 |
| +2.5 Volts monitor | 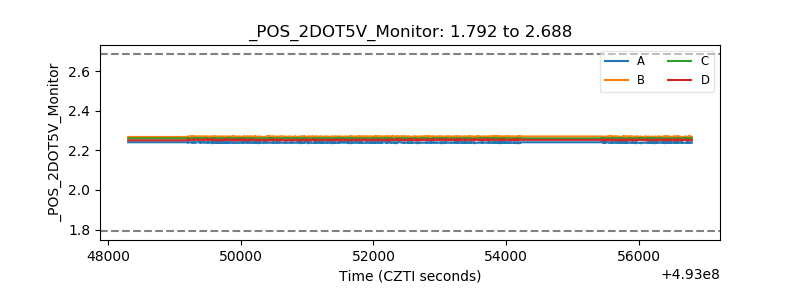 |
| +5 Volts monitor | 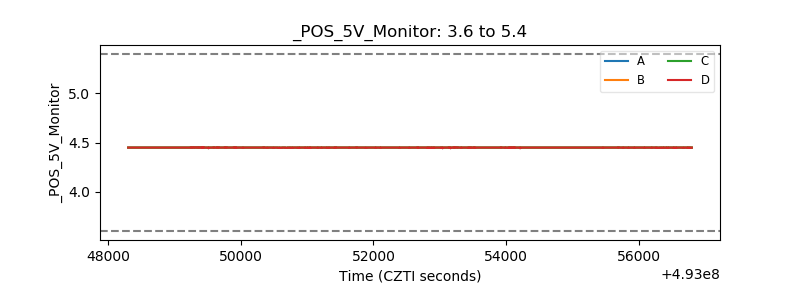 |
| _ROLL_ROT | 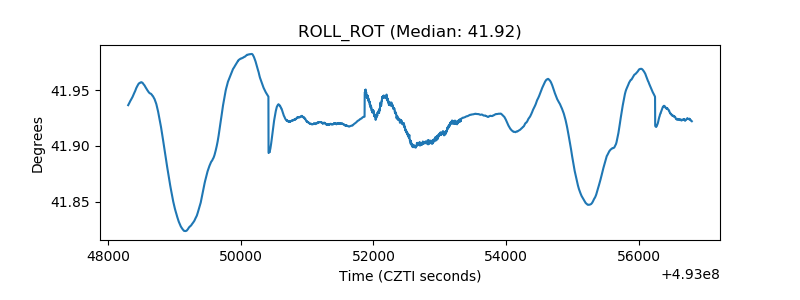 |
| _Roll_DEC | 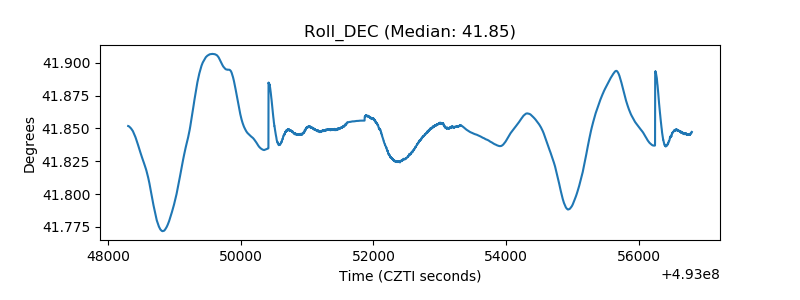 |
| _Roll_RA | 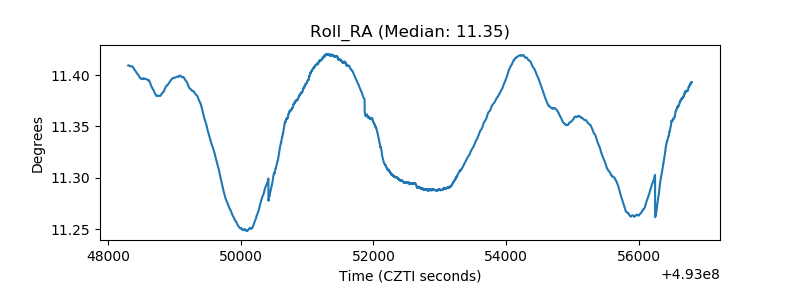 |
| Veto Counter | 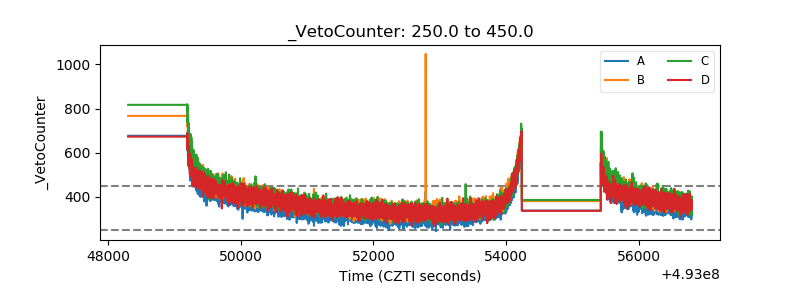 |