| Param | Original file | Final file |
|---|---|---|
| Filename | modeM0/AS1A14_002T06_9000006496_53472cztM0_level2.fits | modeM0/AS1A14_002T06_9000006496_53472cztM0_level2_quad_clean.evt |
| Size (bytes) | 740,995,200 | 93,360,960 |
| Size | 706.7 MB | 89.0 MB |
| Events in quadrant A | 7,960,374 | 597,608 |
| Events in quadrant B | 3,879,699 | 737,219 |
| Events in quadrant C | 10,875,256 | 419,131 |
| Events in quadrant D | 4,185,638 | 597,905 |
| Mode M9 | |||
|---|---|---|---|
| Quadrant | BADHDUFLAG | Total packets | Discarded packets |
| A | 0 | 23 | 0 |
| B | 0 | 23 | 0 |
| C | 0 | 23 | 0 |
| D | 0 | 23 | 0 |
| Mode SS | |||
|---|---|---|---|
| Quadrant | BADHDUFLAG | Total packets | Discarded packets |
| A | 0 | 138 | 0 |
| B | 0 | 138 | 0 |
| C | 0 | 138 | 0 |
| D | 0 | 138 | 0 |
| Mode M0 | |||
|---|---|---|---|
| Quadrant | BADHDUFLAG | Total packets | Discarded packets |
| A | 0 | 28482 | 2 |
| B | 0 | 16215 | 2 |
| C | 0 | 37058 | 2 |
| D | 0 | 17336 | 2 |
| Quadrant | Total seconds | Saturated seconds | Saturation percentage |
|---|---|---|---|
| A | 6822 | 1291 | 18.924069% |
| B | 6822 | 290 | 4.250953% |
| C | 6823 | 2779 | 40.729884% |
| D | 6822 | 263 | 3.855174% |
Noise dominated data is calculated using 1-second bins in cleaned event files. If a bin has >2000 counts, and if more than 50% of those come from <1% of pixels, then it is considered to be noise-dominated and hence unusable.
| Quadrant | # 1 sec bins | Bins with >0 counts | Bins with >2000 counts | High rate bins dominated by noise | Noise dominated (total time) | Noise dominated (detector-on time) | Marked lightcurve |
|---|---|---|---|---|---|---|---|
| A | 9037 | 6823 | 959 | 959 | 10.61% | 14.06% | 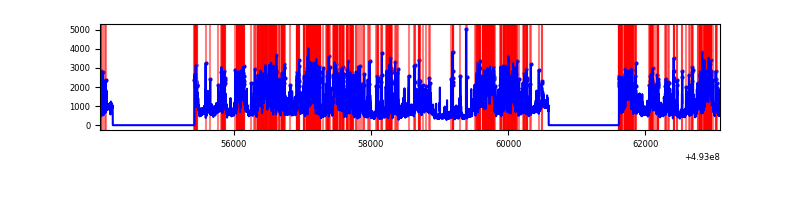 |
| B | 9037 | 6823 | 42 | 42 | 0.46% | 0.62% | 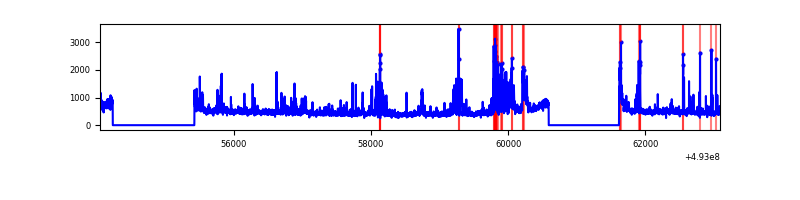 |
| C | 9038 | 6824 | 2385 | 2385 | 26.39% | 34.95% | 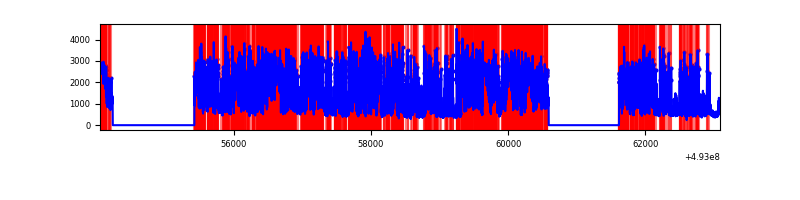 |
| D | 9037 | 6823 | 132 | 132 | 1.46% | 1.93% | 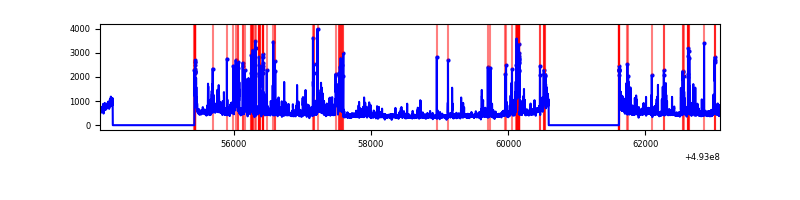 |
Top three noisy pixels from each quadrant. If the there are fewer than three noisy pixels in the level2.evt file, extra rows are filled as -1
| Pixel properties | Quadrant properties | ||||||
|---|---|---|---|---|---|---|---|
| Quadrant | DetID | PixID | Counts | Sigma | Mean | Median | Sigma |
| A | 3 | 63 | 2639562 | 14407.06 | 744 | 723 | 183.2 |
| A | 3 | 62 | 1538883 | 8397.77 | 744 | 723 | 183.2 |
| A | 15 | 174 | 617639 | 3368.13 | 744 | 723 | 183.2 |
| B | 4 | 216 | 233439 | 1396.25 | 779 | 751 | 166.7 |
| B | 10 | 28 | 182654 | 1091.51 | 779 | 751 | 166.7 |
| B | 1 | 255 | 79273 | 471.17 | 779 | 751 | 166.7 |
| C | 15 | 224 | 3421643 | 19913.65 | 628 | 622 | 171.8 |
| C | 1 | 241 | 2467829 | 14361.53 | 628 | 622 | 171.8 |
| C | 7 | 64 | 1865147 | 10853.34 | 628 | 622 | 171.8 |
| D | 3 | 12 | 398255 | 1885.93 | 759 | 727 | 210.8 |
| D | 2 | 249 | 287356 | 1359.81 | 759 | 727 | 210.8 |
| D | 8 | 176 | 118315 | 557.85 | 759 | 727 | 210.8 |
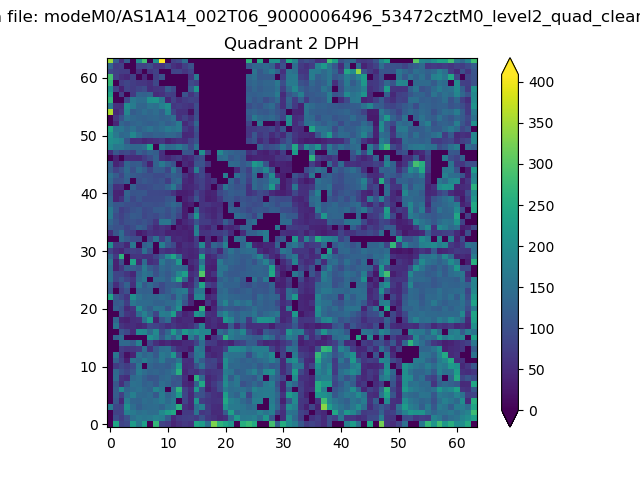
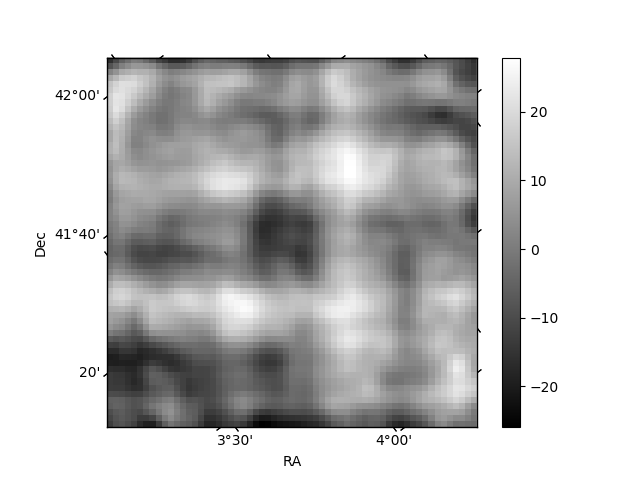
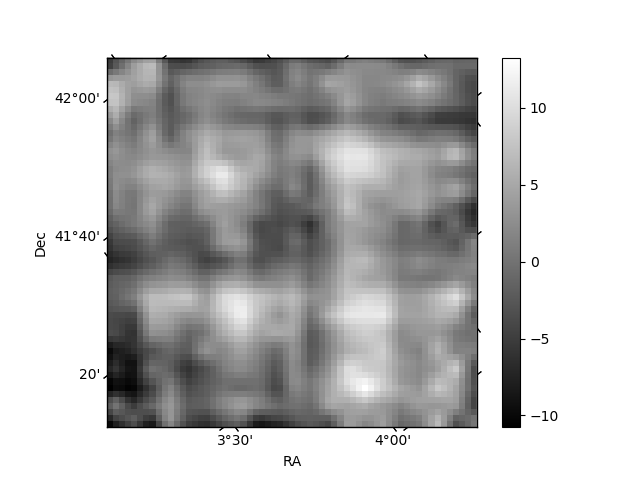
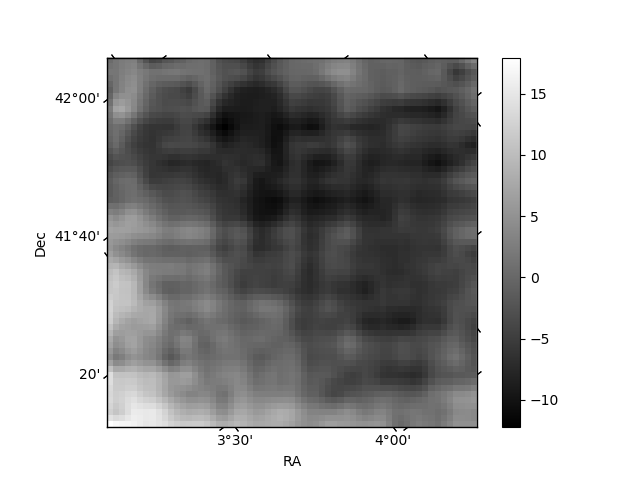
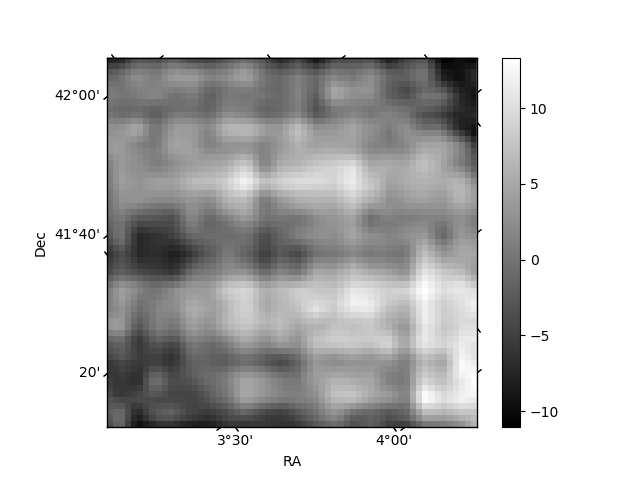
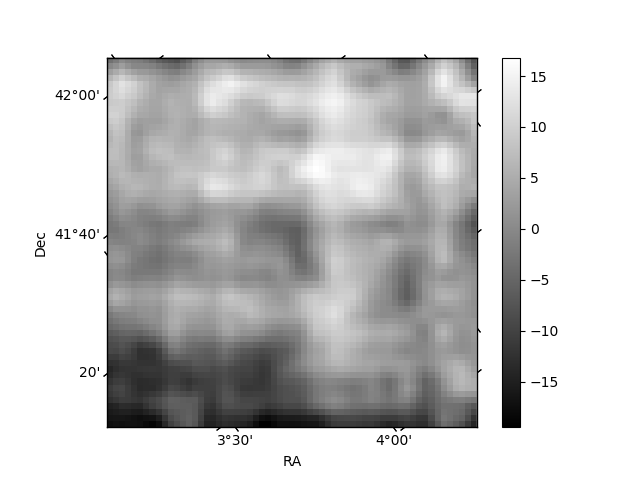
Histogram calculated using DETX and DETY for each event in the final _common_clean file
| Quadrant A | 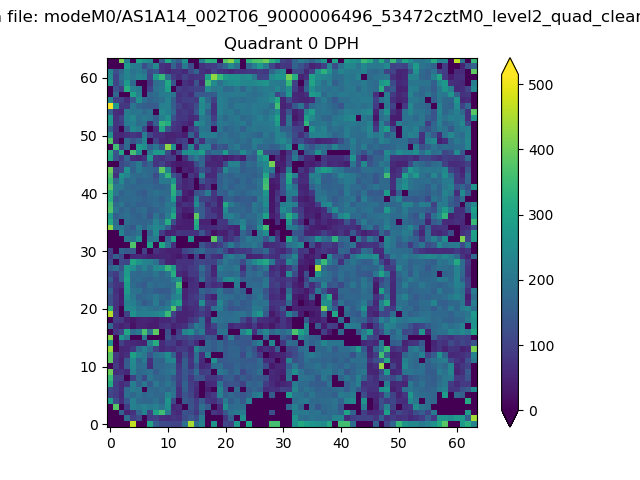 |
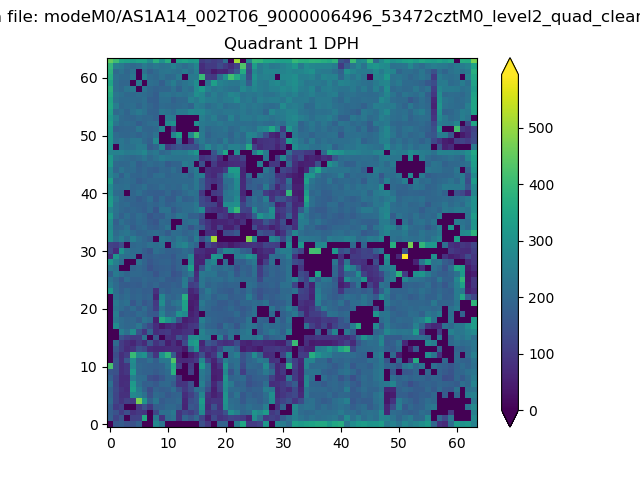 |
Quadrant B |
|---|---|---|---|
| Quadrant D | 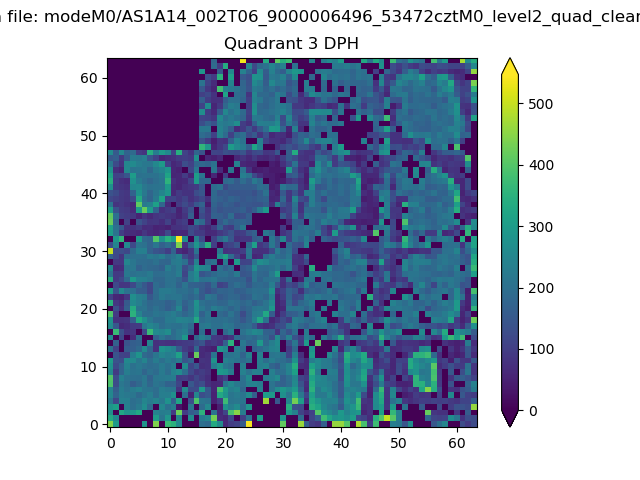 |
 |
Quadrant C |
| Plot type | Count rate plots | Images |
|---|---|---|
| Comparison with Poisson distribution Blue bars denote a histogram of data divided into 1 sec bins. Red curve is a Poisson curve with rate = median count rate of data. |
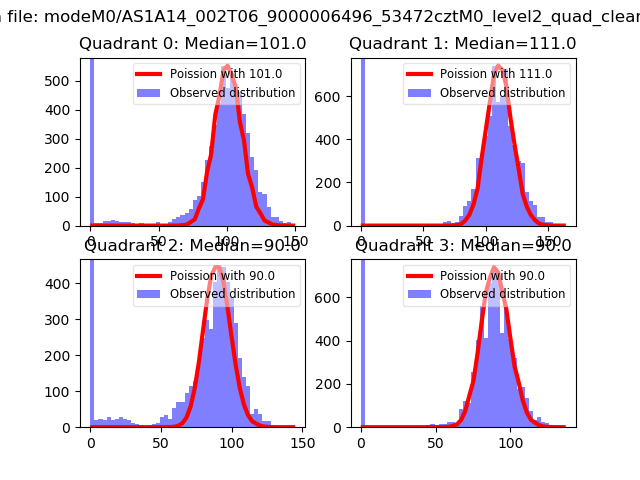 |
 |
| Quadrant-wise count rates Data is divided into 100 sec bins |
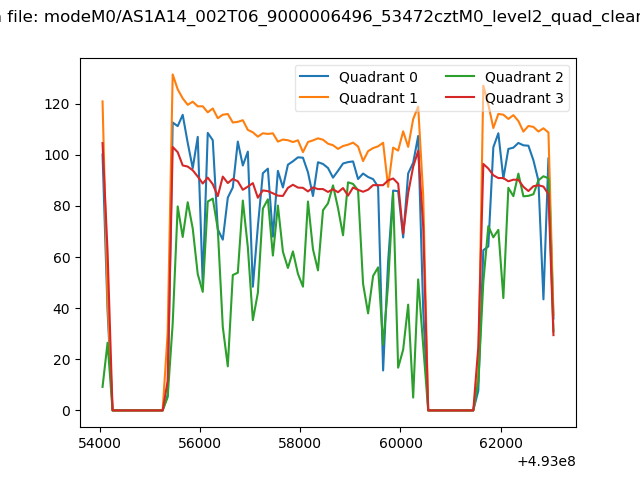 |
|
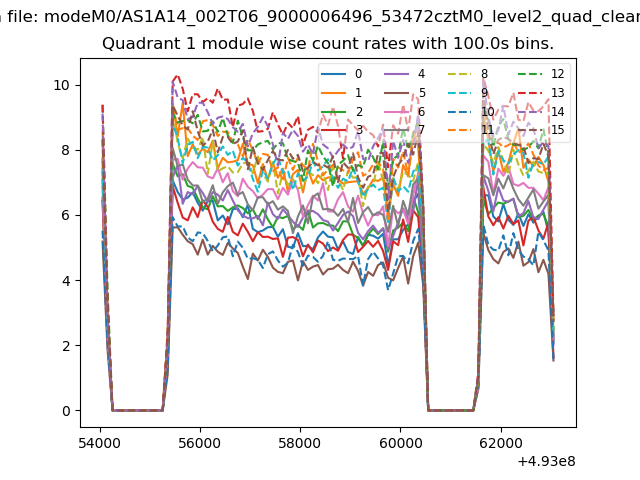
| Module-wise count rates for Quadrant A Data is divided into 100 sec bins |
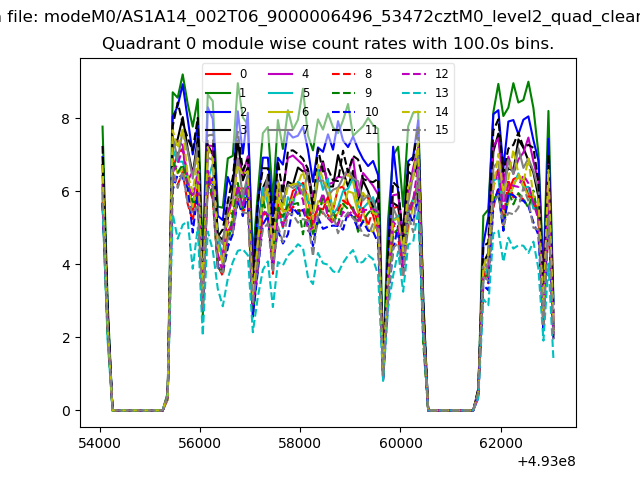 |
 |
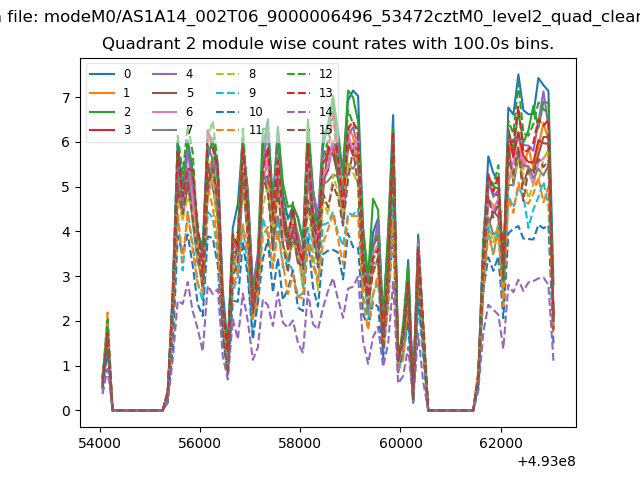
| Module-wise count rates for Quadrant B Data is divided into 100 sec bins |
 |
 |
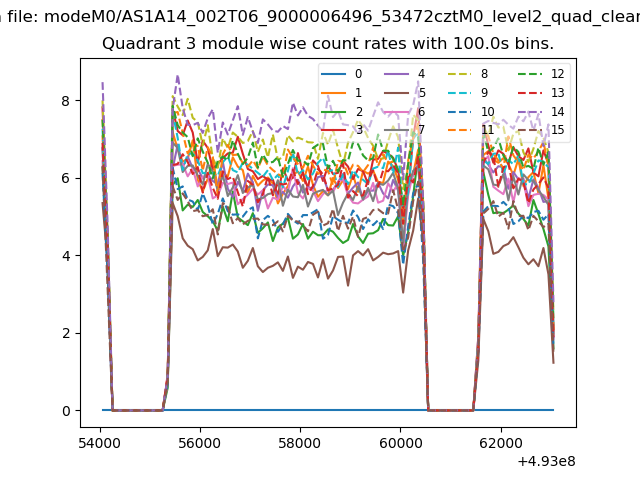
| Module-wise count rates for Quadrant C Data is divided into 100 sec bins |
 |
 |
| Module-wise count rates for Quadrant D Data is divided into 100 sec bins |
 |
 |
| Parameter | Plot |
|---|---|
| CZT HV Monitor | 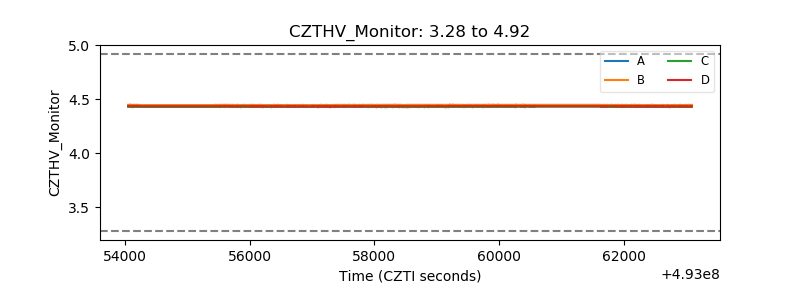 |
| D_VDD | 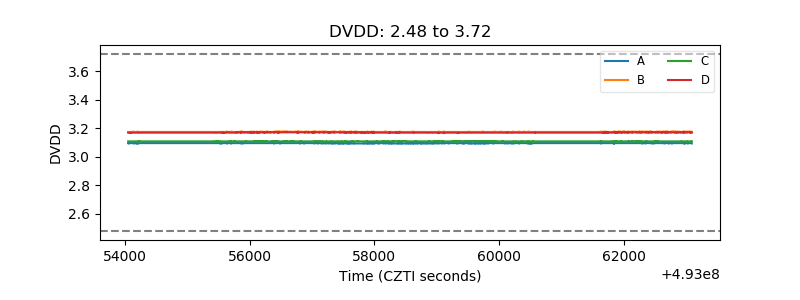 |
| Temperature 1 | 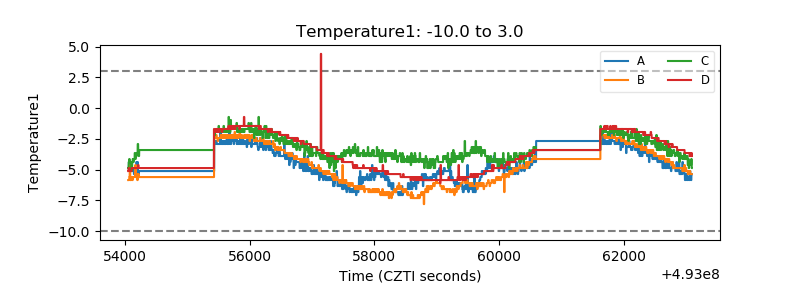 |
| Veto HV Monitor | 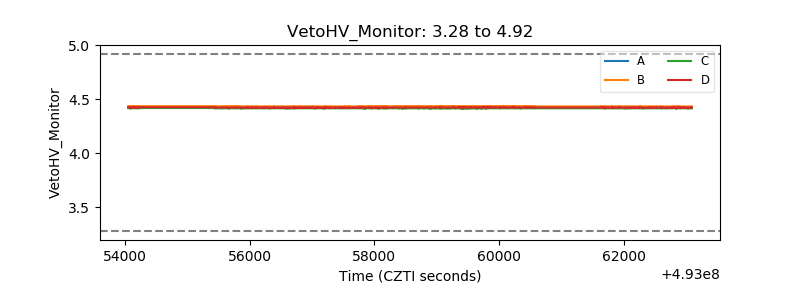 |
| Veto LLD | 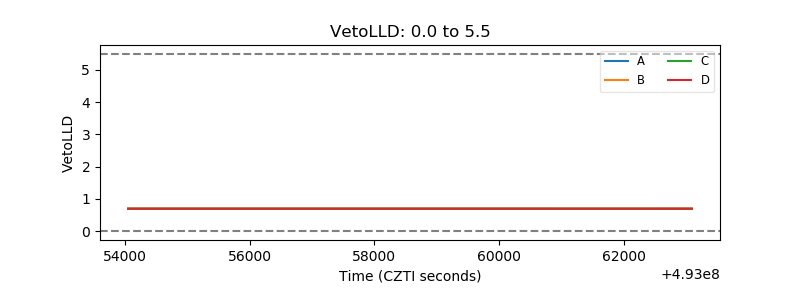 |
| Alpha Counter | 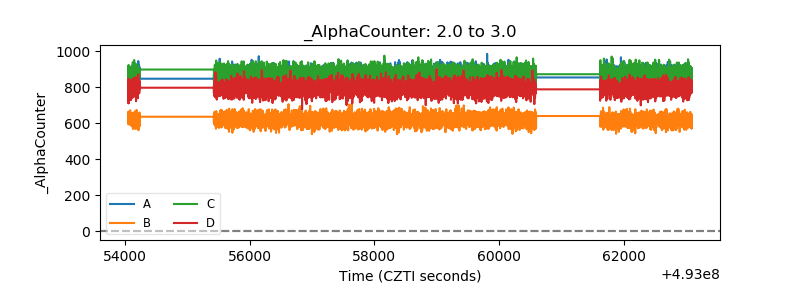 |
| _CPM_Rate | 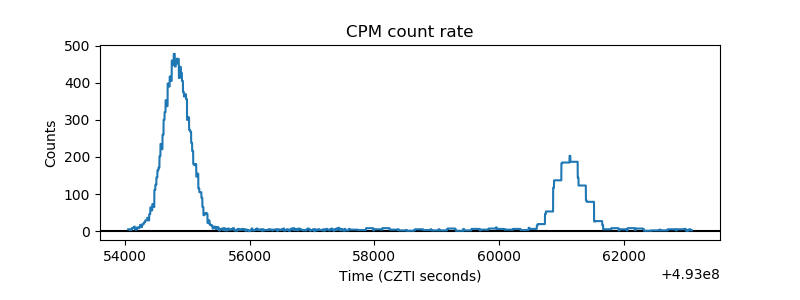 |
| CZT Counter | 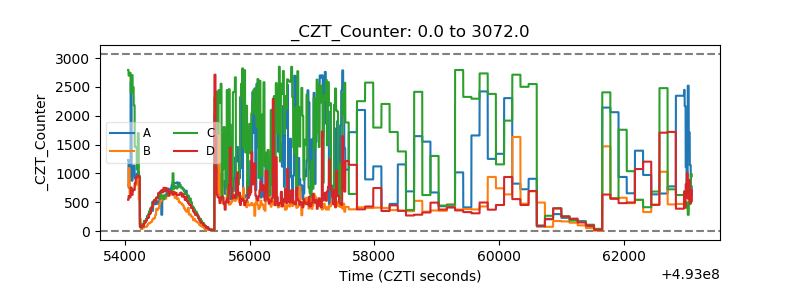 |
| +2.5 Volts monitor |  |
| +5 Volts monitor |  |
| _ROLL_ROT | 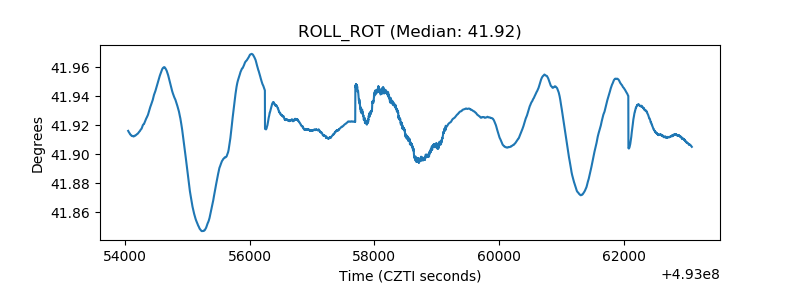 |
| _Roll_DEC | 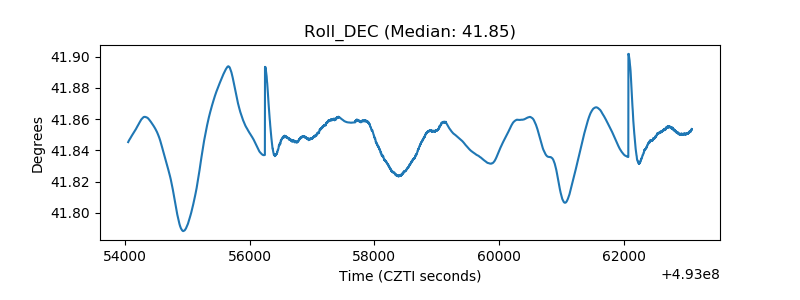 |
| _Roll_RA | 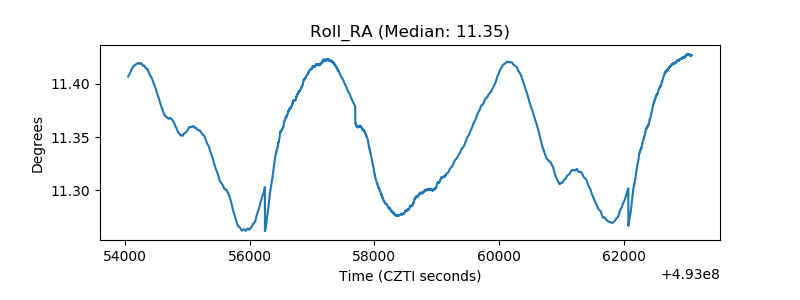 |
| Veto Counter | 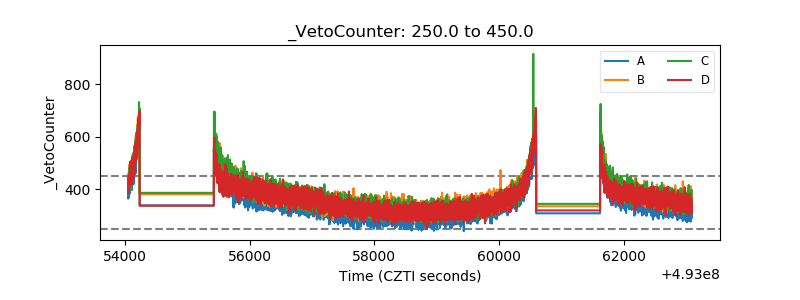 |