| Param | Original file | Final file |
|---|---|---|
| Filename | modeM0/AS1A14_002T06_9000006496_53474cztM0_level2.fits | modeM0/AS1A14_002T06_9000006496_53474cztM0_level2_quad_clean.evt |
| Size (bytes) | 1,011,360,960 | 87,788,160 |
| Size | 964.5 MB | 83.7 MB |
| Events in quadrant A | 11,161,477 | 533,933 |
| Events in quadrant B | 3,876,553 | 805,866 |
| Events in quadrant C | 17,620,421 | 138,542 |
| Events in quadrant D | 4,194,934 | 654,391 |
| Mode SS | |||
|---|---|---|---|
| Quadrant | BADHDUFLAG | Total packets | Discarded packets |
| A | 0 | 152 | 0 |
| B | 0 | 152 | 0 |
| C | 0 | 152 | 0 |
| D | 0 | 152 | 0 |
| Mode M0 | |||
|---|---|---|---|
| Quadrant | BADHDUFLAG | Total packets | Discarded packets |
| A | 0 | 38411 | 1 |
| B | 0 | 16768 | 1 |
| C | 0 | 57399 | 1 |
| D | 0 | 18068 | 1 |
| Quadrant | Total seconds | Saturated seconds | Saturation percentage |
|---|---|---|---|
| A | 7543 | 2539 | 33.660347% |
| B | 7543 | 121 | 1.604136% |
| C | 7544 | 6275 | 83.178685% |
| D | 7544 | 127 | 1.683457% |
Noise dominated data is calculated using 1-second bins in cleaned event files. If a bin has >2000 counts, and if more than 50% of those come from <1% of pixels, then it is considered to be noise-dominated and hence unusable.
| Quadrant | # 1 sec bins | Bins with >0 counts | Bins with >2000 counts | High rate bins dominated by noise | Noise dominated (total time) | Noise dominated (detector-on time) | Marked lightcurve |
|---|---|---|---|---|---|---|---|
| A | 7602 | 7542 | 2080 | 2080 | 27.36% | 27.58% | 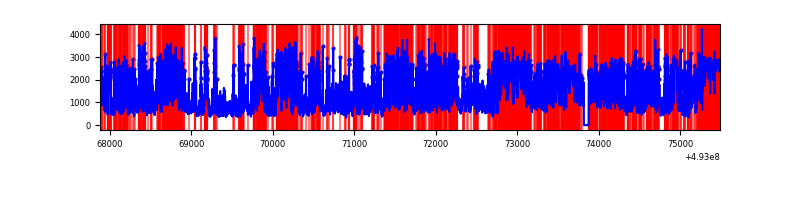 |
| B | 7603 | 7544 | 21 | 21 | 0.28% | 0.28% | 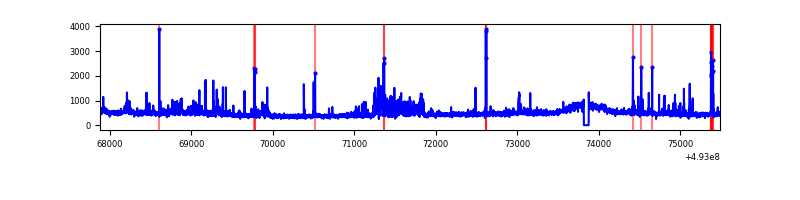 |
| C | 7603 | 7543 | 5899 | 5899 | 77.59% | 78.20% | 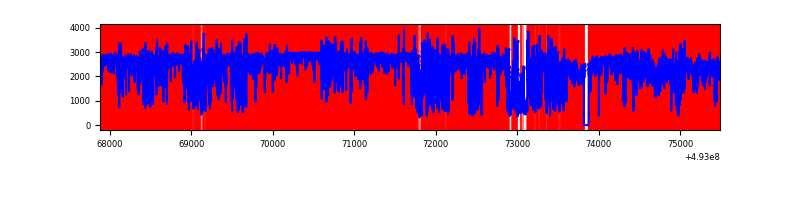 |
| D | 7604 | 7545 | 100 | 100 | 1.32% | 1.33% | 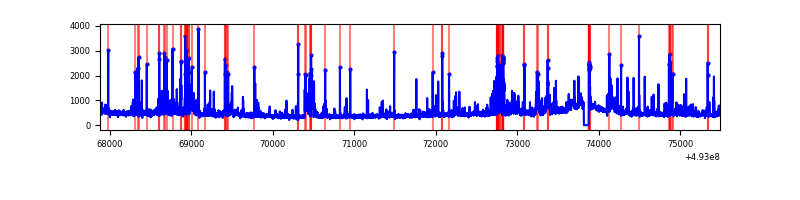 |
Top three noisy pixels from each quadrant. If the there are fewer than three noisy pixels in the level2.evt file, extra rows are filled as -1
| Pixel properties | Quadrant properties | ||||||
|---|---|---|---|---|---|---|---|
| Quadrant | DetID | PixID | Counts | Sigma | Mean | Median | Sigma |
| A | 3 | 62 | 4547828 | 25492.86 | 726 | 708 | 178.4 |
| A | 3 | 63 | 1862531 | 10438.08 | 726 | 708 | 178.4 |
| A | 15 | 174 | 1514451 | 8486.61 | 726 | 708 | 178.4 |
| B | 4 | 216 | 162604 | 901.1 | 841 | 812 | 179.6 |
| B | 5 | 185 | 72930 | 401.66 | 841 | 812 | 179.6 |
| B | 4 | 171 | 59337 | 325.95 | 841 | 812 | 179.6 |
| C | 1 | 241 | 10032354 | 90361.12 | 402 | 399 | 111.0 |
| C | 15 | 224 | 2033657 | 18314.22 | 402 | 399 | 111.0 |
| C | 7 | 64 | 1989768 | 17918.9 | 402 | 399 | 111.0 |
| D | 15 | 42 | 304748 | 1318.0 | 815 | 779 | 230.6 |
| D | 13 | 153 | 165066 | 712.34 | 815 | 779 | 230.6 |
| D | 3 | 12 | 147003 | 634.02 | 815 | 779 | 230.6 |
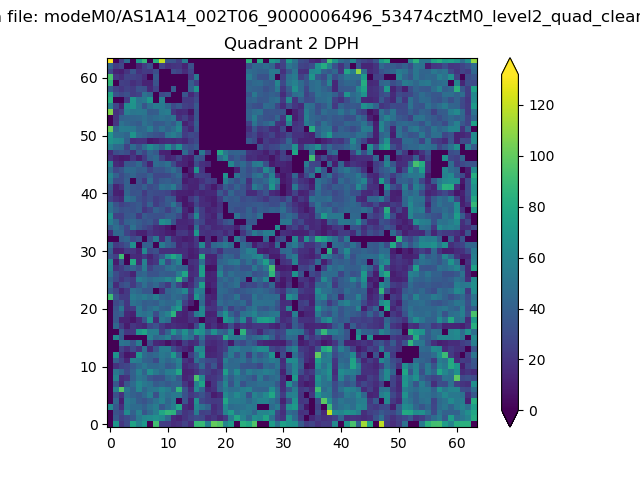
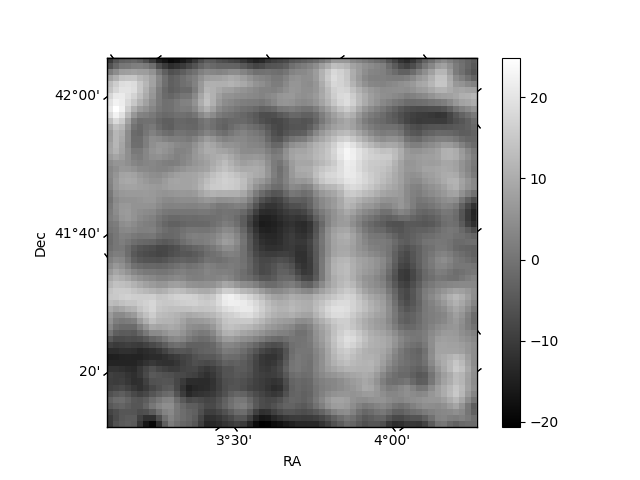
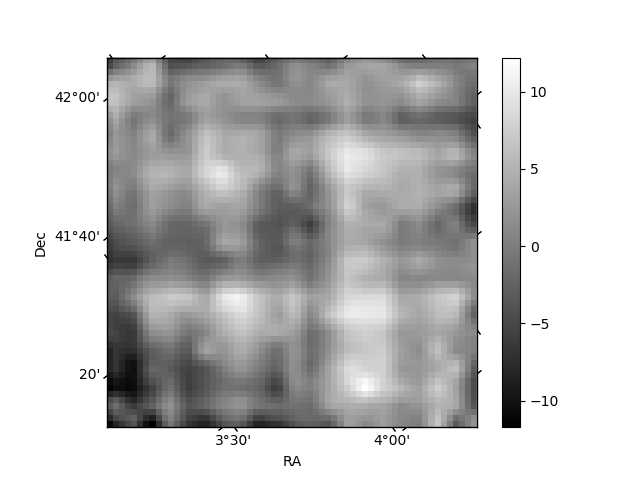
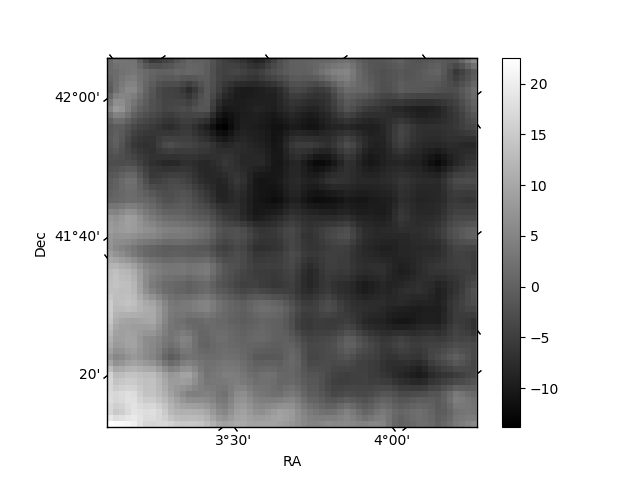
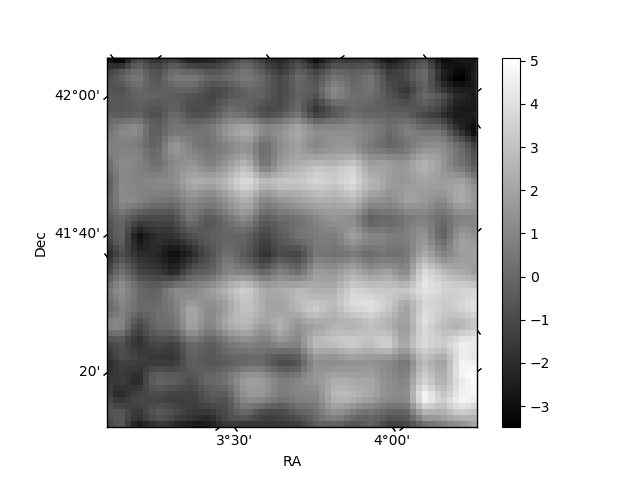
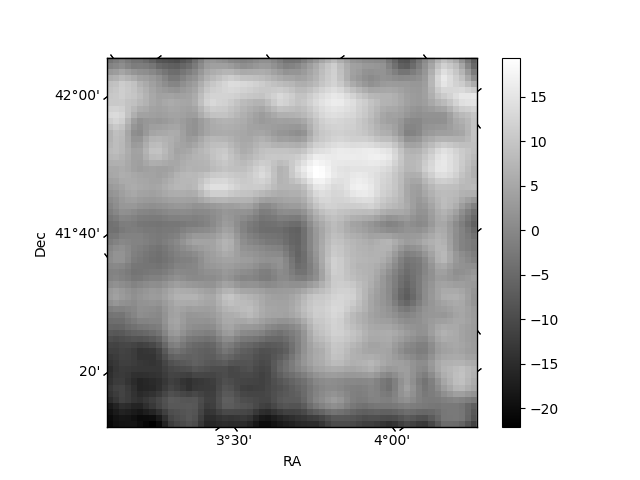
Histogram calculated using DETX and DETY for each event in the final _common_clean file
| Quadrant A | 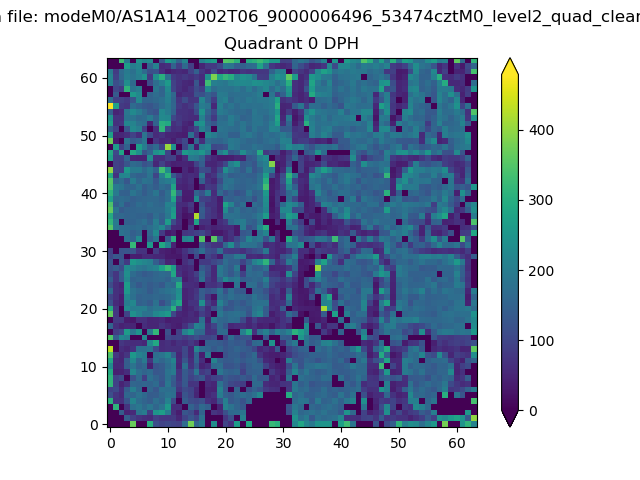 |
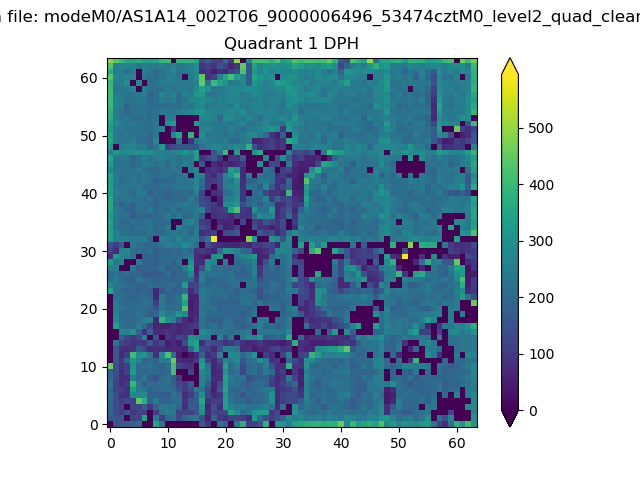 |
Quadrant B |
|---|---|---|---|
| Quadrant D | 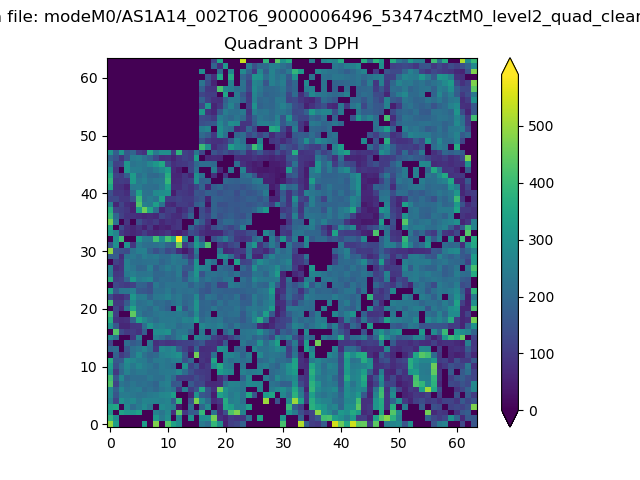 |
 |
Quadrant C |
| Plot type | Count rate plots | Images |
|---|---|---|
| Comparison with Poisson distribution Blue bars denote a histogram of data divided into 1 sec bins. Red curve is a Poisson curve with rate = median count rate of data. |
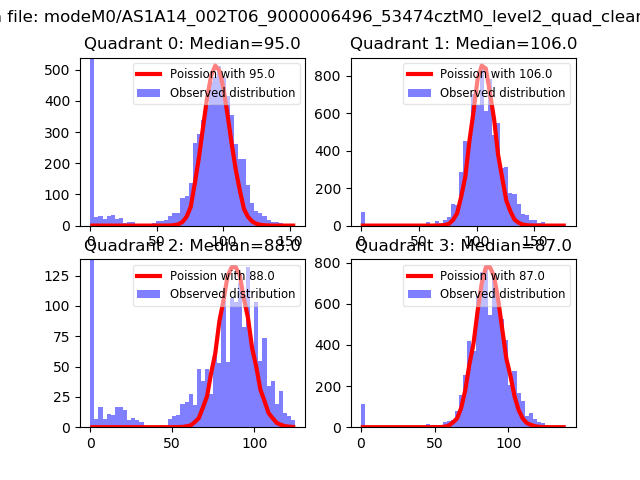 |
 |
| Quadrant-wise count rates Data is divided into 100 sec bins |
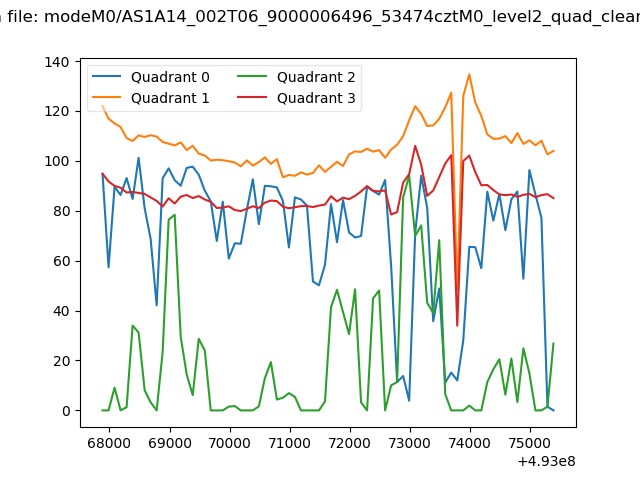 |
|
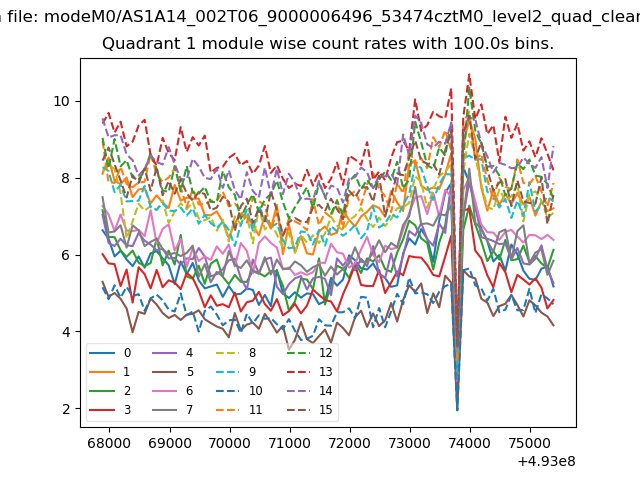
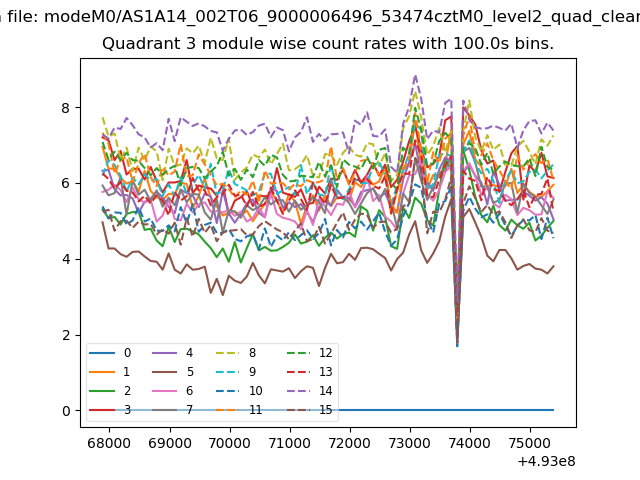
| Module-wise count rates for Quadrant A Data is divided into 100 sec bins |
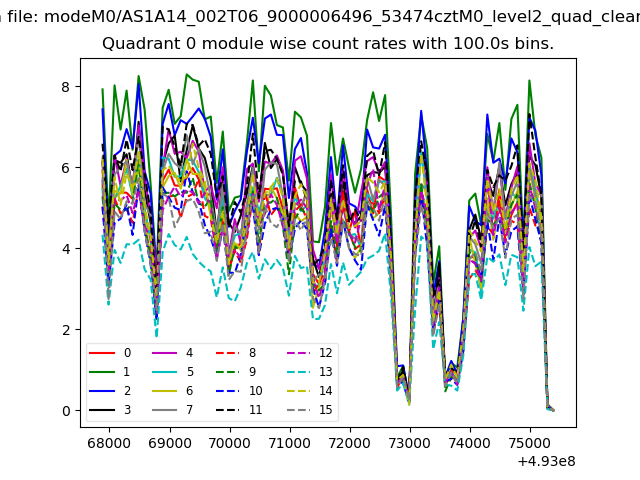 |
 |
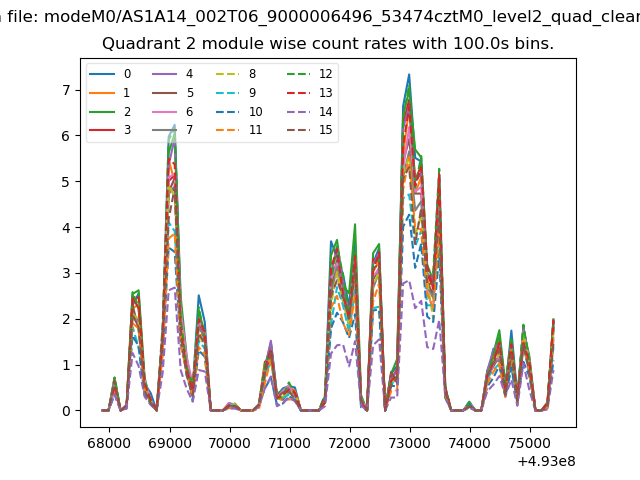
| Module-wise count rates for Quadrant B Data is divided into 100 sec bins |
 |
 |
| Module-wise count rates for Quadrant C Data is divided into 100 sec bins |
 |
 |
| Module-wise count rates for Quadrant D Data is divided into 100 sec bins |
 |
 |
| Parameter | Plot |
|---|---|
| CZT HV Monitor |  |
| D_VDD | 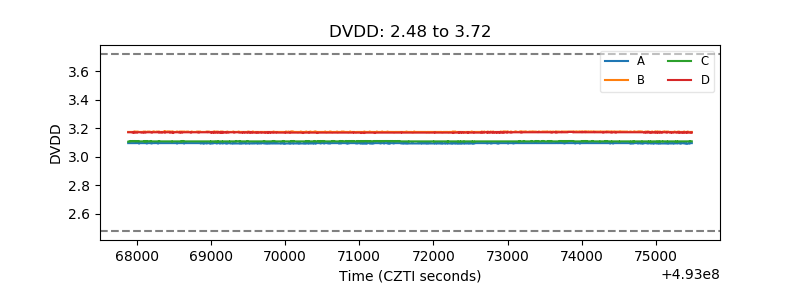 |
| Temperature 1 | 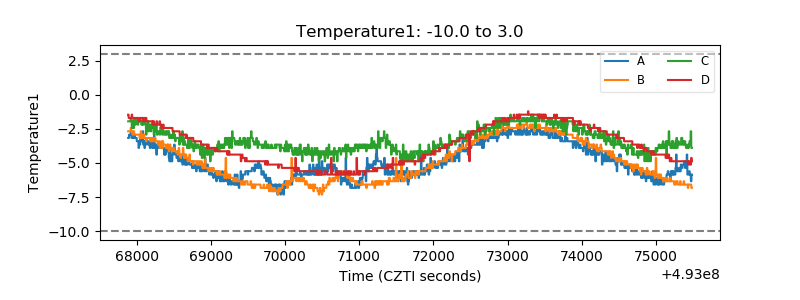 |
| Veto HV Monitor | 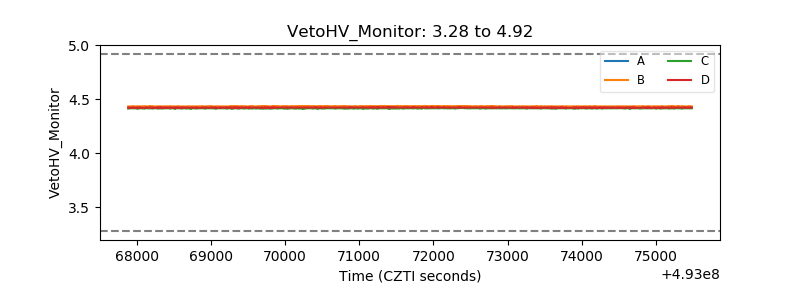 |
| Veto LLD | 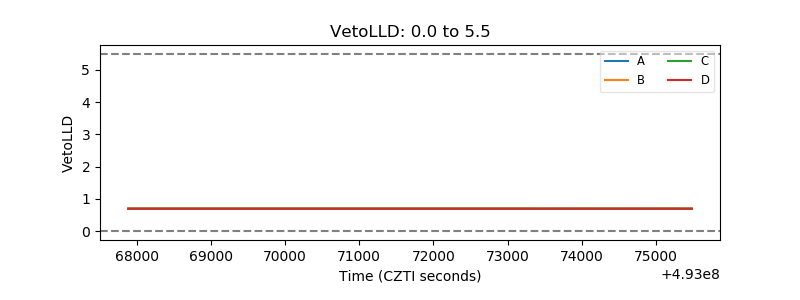 |
| Alpha Counter | 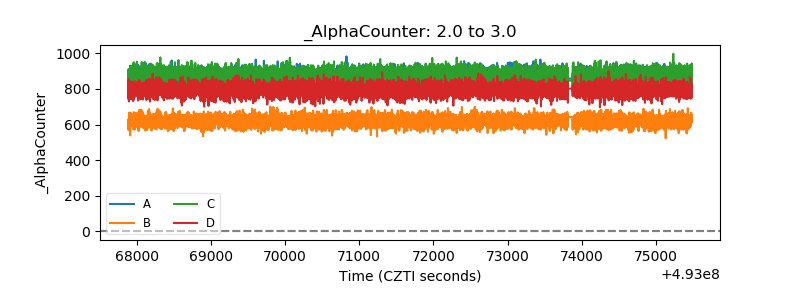 |
| _CPM_Rate | 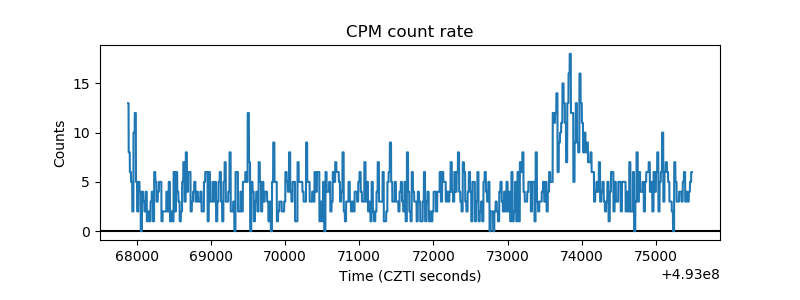 |
| CZT Counter | 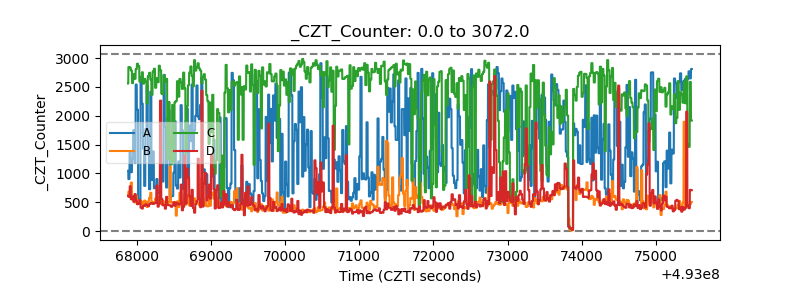 |
| +2.5 Volts monitor |  |
| +5 Volts monitor |  |
| _ROLL_ROT | 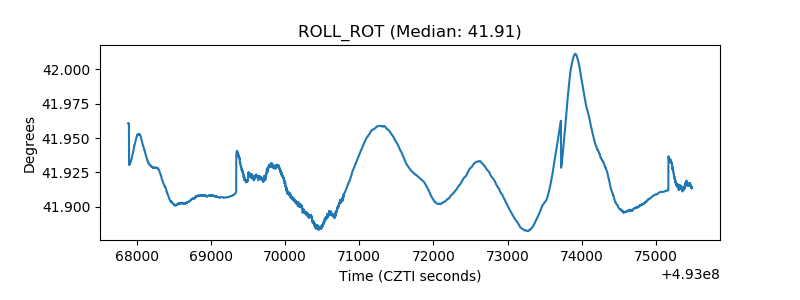 |
| _Roll_DEC | 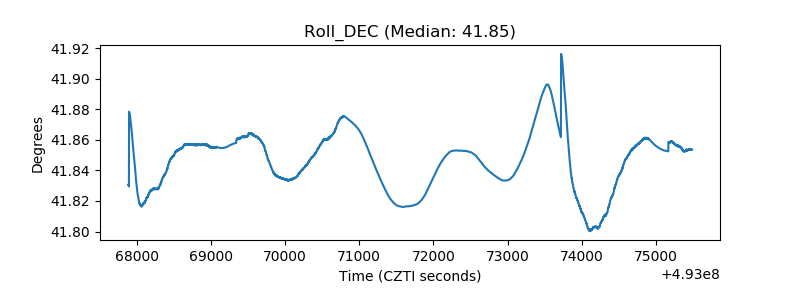 |
| _Roll_RA | 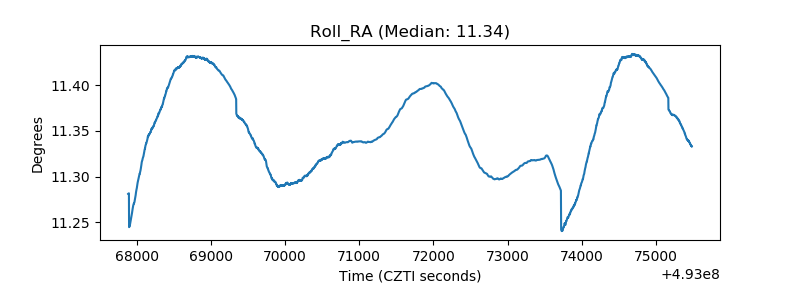 |
| Veto Counter | 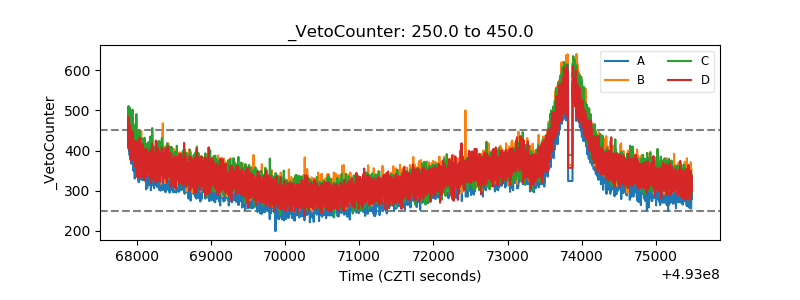 |