| Param | Original file | Final file |
|---|---|---|
| Filename | modeM0/AS1A14_002T06_9000006496_53475cztM0_level2.fits | modeM0/AS1A14_002T06_9000006496_53475cztM0_level2_quad_clean.evt |
| Size (bytes) | 1,013,253,120 | 96,514,560 |
| Size | 966.3 MB | 92.0 MB |
| Events in quadrant A | 12,848,501 | 525,497 |
| Events in quadrant B | 4,355,348 | 845,490 |
| Events in quadrant C | 15,488,287 | 305,351 |
| Events in quadrant D | 4,196,777 | 690,016 |
| Mode SS | |||
|---|---|---|---|
| Quadrant | BADHDUFLAG | Total packets | Discarded packets |
| A | 0 | 160 | 0 |
| B | 0 | 160 | 0 |
| C | 0 | 160 | 0 |
| D | 0 | 160 | 0 |
| Mode M0 | |||
|---|---|---|---|
| Quadrant | BADHDUFLAG | Total packets | Discarded packets |
| A | 0 | 43733 | 0 |
| B | 0 | 18625 | 0 |
| C | 0 | 51456 | 3 |
| D | 0 | 18453 | 0 |
| Quadrant | Total seconds | Saturated seconds | Saturation percentage |
|---|---|---|---|
| A | 7993 | 3125 | 39.096710% |
| B | 7993 | 129 | 1.613912% |
| C | 7993 | 5015 | 62.742400% |
| D | 7993 | 103 | 1.288628% |
Noise dominated data is calculated using 1-second bins in cleaned event files. If a bin has >2000 counts, and if more than 50% of those come from <1% of pixels, then it is considered to be noise-dominated and hence unusable.
| Quadrant | # 1 sec bins | Bins with >0 counts | Bins with >2000 counts | High rate bins dominated by noise | Noise dominated (total time) | Noise dominated (detector-on time) | Marked lightcurve |
|---|---|---|---|---|---|---|---|
| A | 7993 | 7993 | 2715 | 2715 | 33.97% | 33.97% | 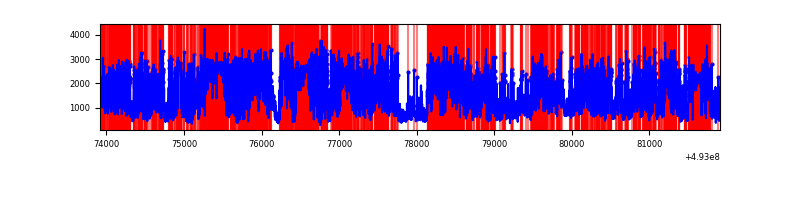 |
| B | 7993 | 7993 | 76 | 76 | 0.95% | 0.95% | 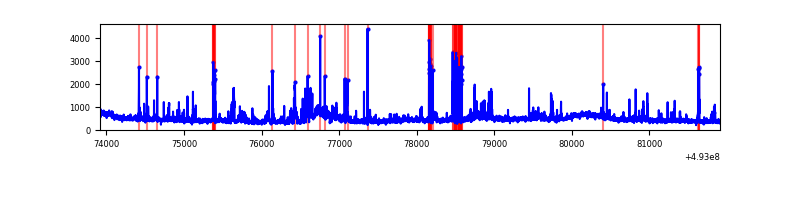 |
| C | 7993 | 7993 | 4575 | 4575 | 57.24% | 57.24% | 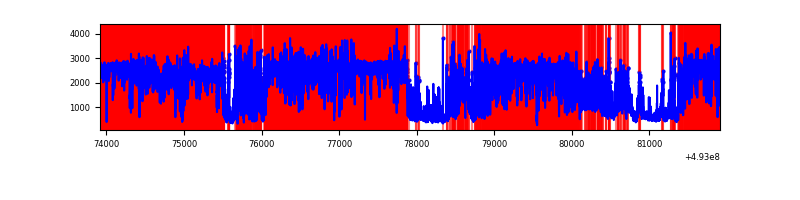 |
| D | 7993 | 7993 | 93 | 93 | 1.16% | 1.16% | 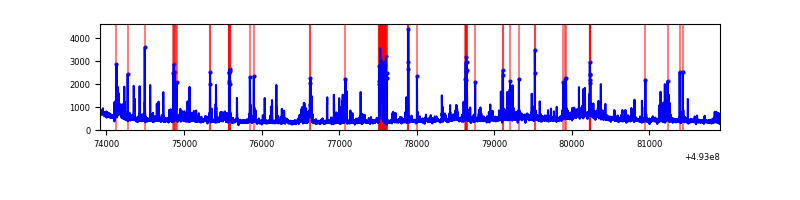 |
Top three noisy pixels from each quadrant. If the there are fewer than three noisy pixels in the level2.evt file, extra rows are filled as -1
| Pixel properties | Quadrant properties | ||||||
|---|---|---|---|---|---|---|---|
| Quadrant | DetID | PixID | Counts | Sigma | Mean | Median | Sigma |
| A | 3 | 62 | 3925983 | 21474.04 | 743 | 724 | 182.8 |
| A | 3 | 63 | 2916564 | 15951.78 | 743 | 724 | 182.8 |
| A | 15 | 174 | 2835194 | 15506.62 | 743 | 724 | 182.8 |
| B | 2 | 249 | 253761 | 1353.87 | 875 | 844 | 186.8 |
| B | 10 | 28 | 200104 | 1066.65 | 875 | 844 | 186.8 |
| B | 15 | 20 | 116022 | 616.55 | 875 | 844 | 186.8 |
| C | 15 | 224 | 4508703 | 29286.69 | 562 | 556 | 153.9 |
| C | 1 | 241 | 3629082 | 23572.32 | 562 | 556 | 153.9 |
| C | 7 | 64 | 2131510 | 13843.51 | 562 | 556 | 153.9 |
| D | 2 | 120 | 226026 | 947.99 | 851 | 816 | 237.6 |
| D | 3 | 12 | 137034 | 573.39 | 851 | 816 | 237.6 |
| D | 15 | 42 | 97115 | 405.36 | 851 | 816 | 237.6 |
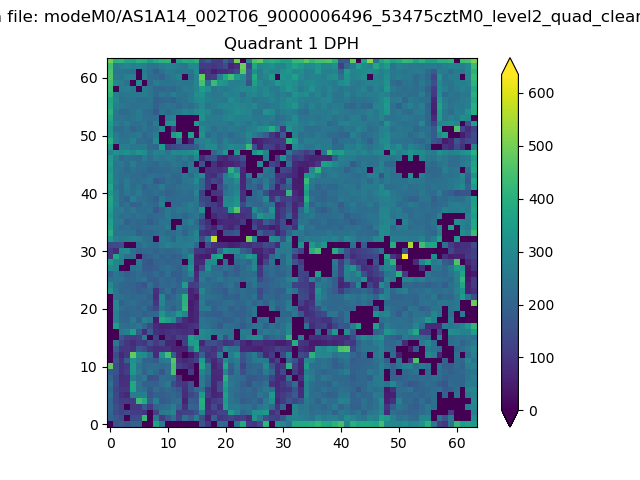
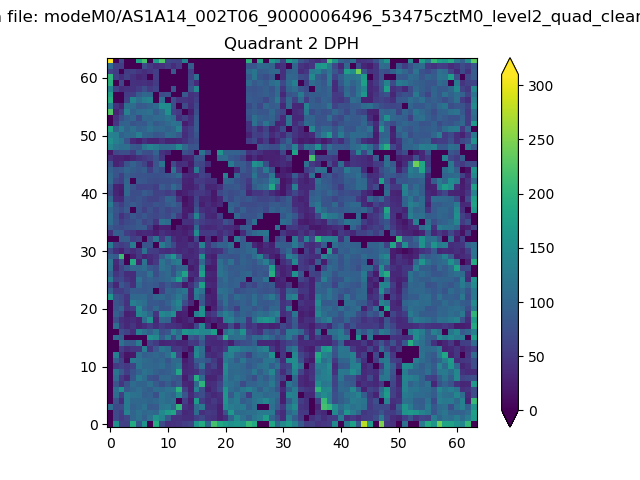
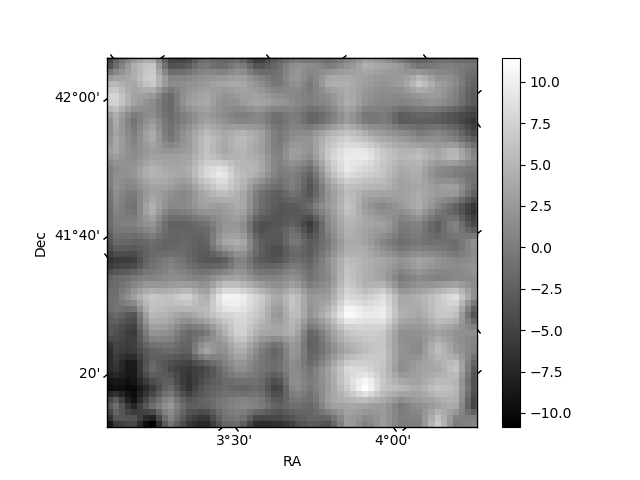
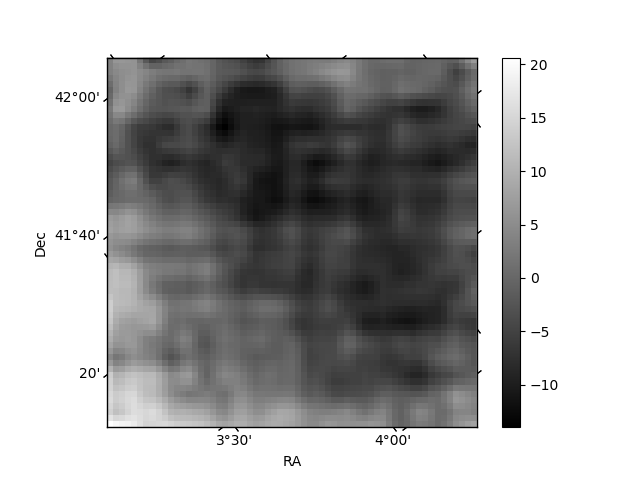
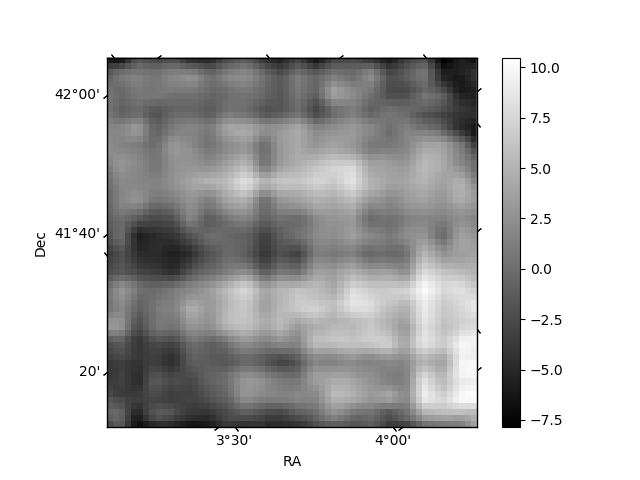
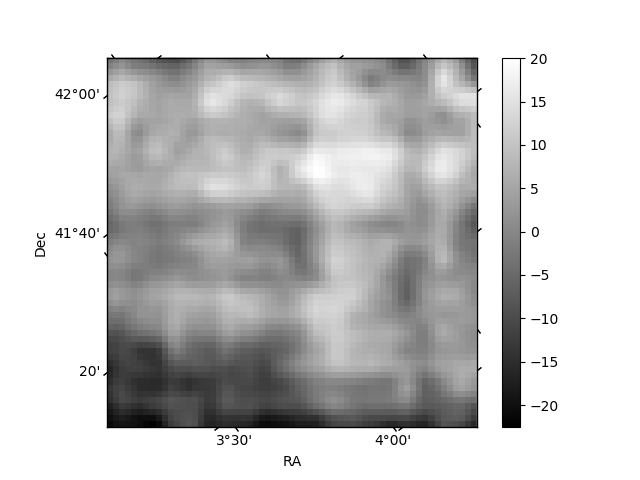
Histogram calculated using DETX and DETY for each event in the final _common_clean file
| Quadrant A | 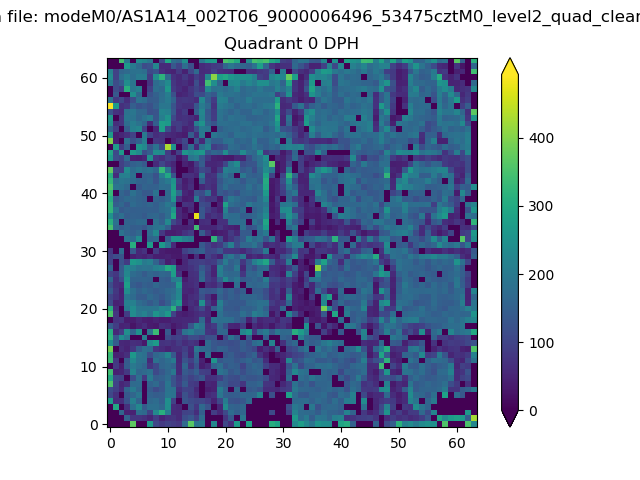 |
 |
Quadrant B |
|---|---|---|---|
| Quadrant D | 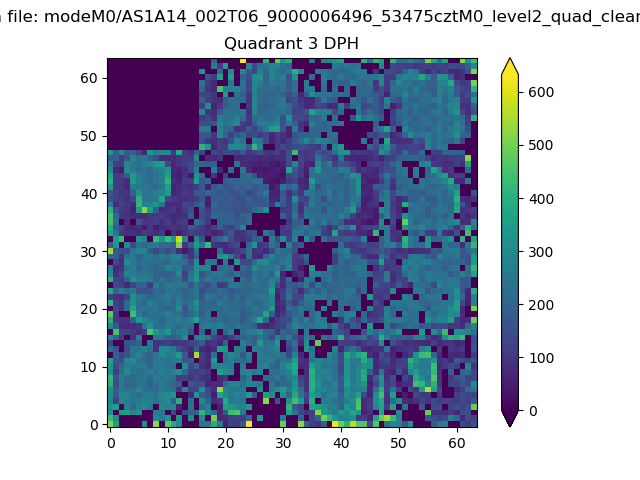 |
 |
Quadrant C |
| Plot type | Count rate plots | Images |
|---|---|---|
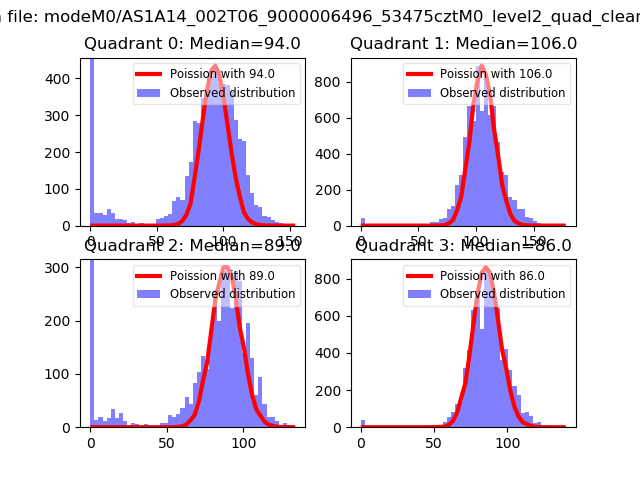
| Comparison with Poisson distribution Blue bars denote a histogram of data divided into 1 sec bins. Red curve is a Poisson curve with rate = median count rate of data. |
 |
 |
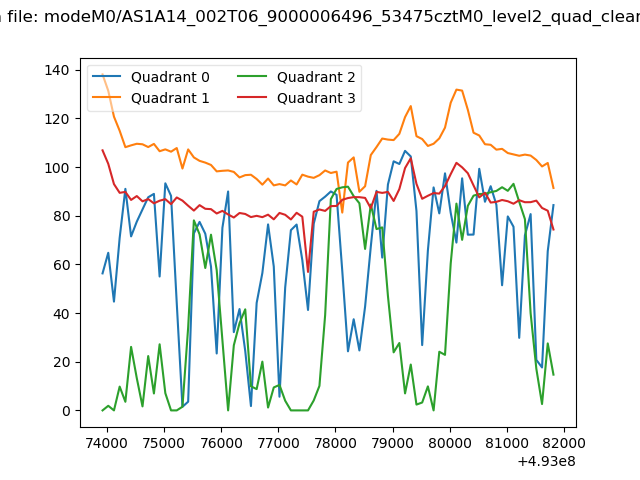
| Quadrant-wise count rates Data is divided into 100 sec bins |
 |
|
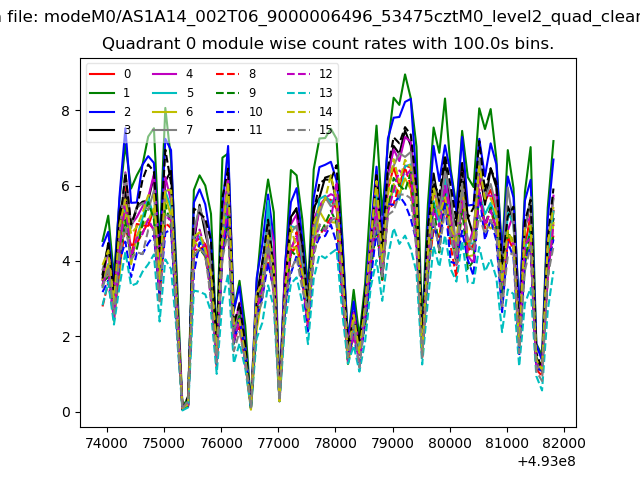
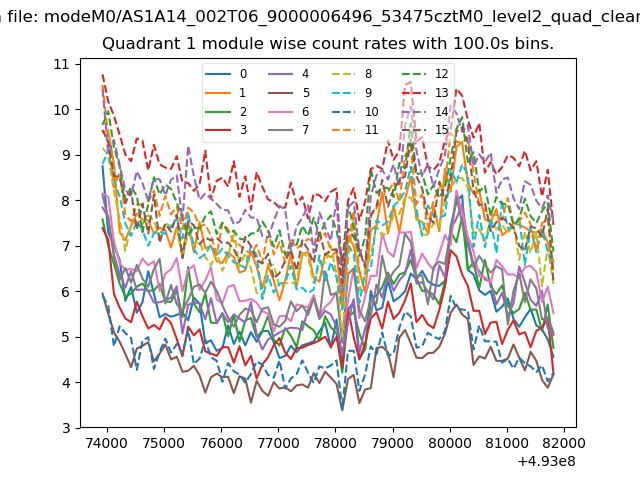
| Module-wise count rates for Quadrant A Data is divided into 100 sec bins |
 |
 |
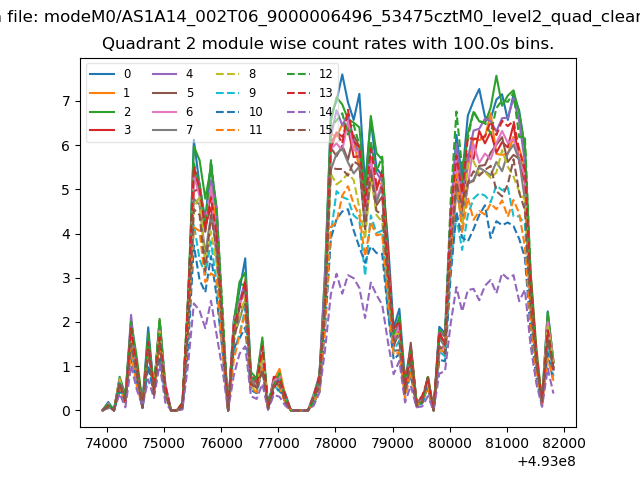
| Module-wise count rates for Quadrant B Data is divided into 100 sec bins |
 |
 |
| Module-wise count rates for Quadrant C Data is divided into 100 sec bins |
 |
 |
| Module-wise count rates for Quadrant D Data is divided into 100 sec bins |
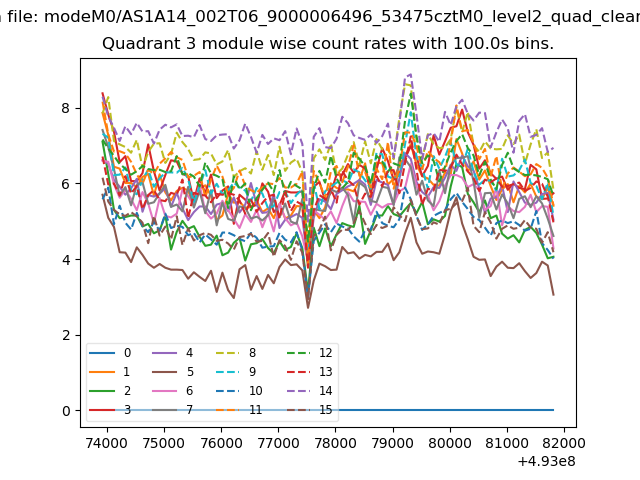 |
 |
| Parameter | Plot |
|---|---|
| CZT HV Monitor | 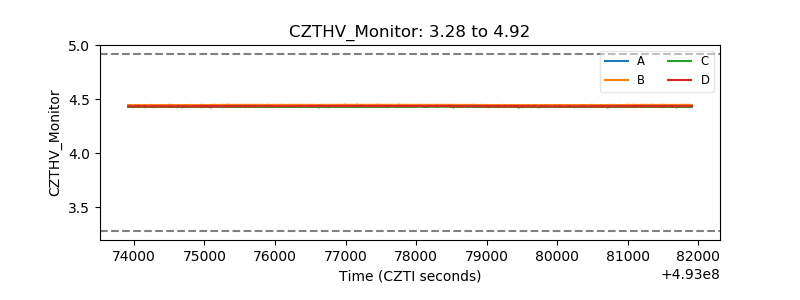 |
| D_VDD | 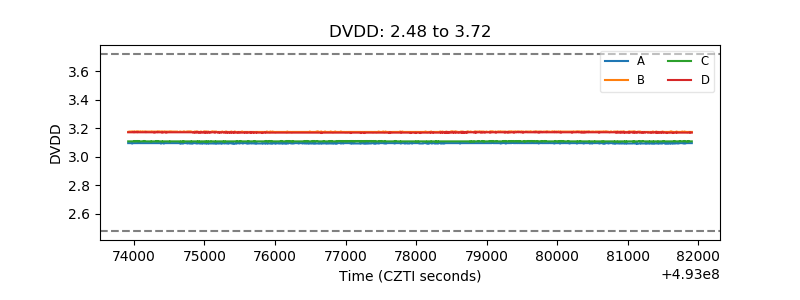 |
| Temperature 1 | 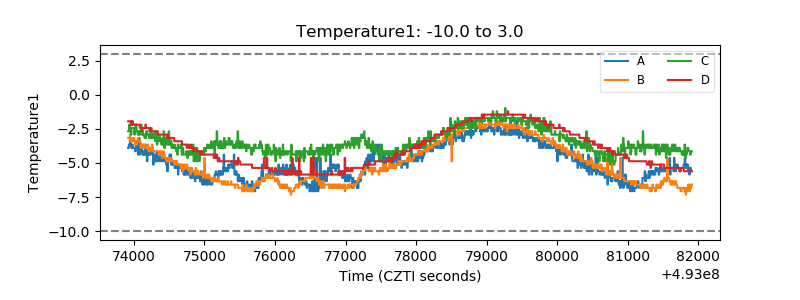 |
| Veto HV Monitor | 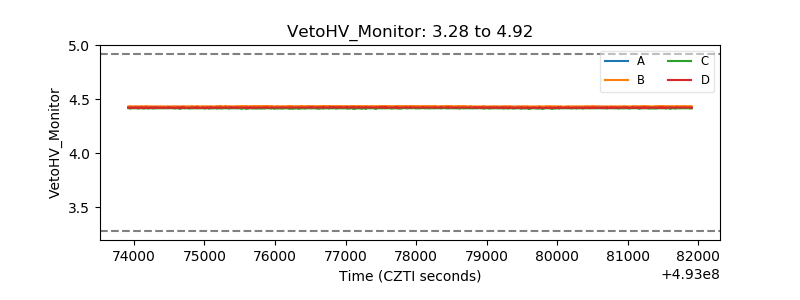 |
| Veto LLD | 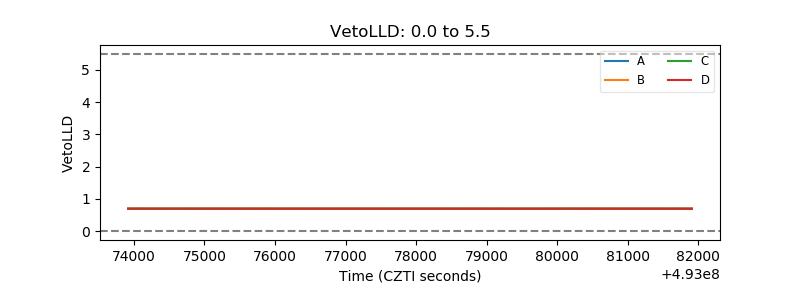 |
| Alpha Counter | 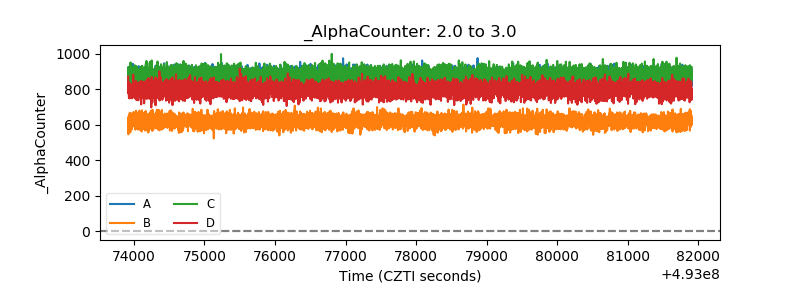 |
| _CPM_Rate | 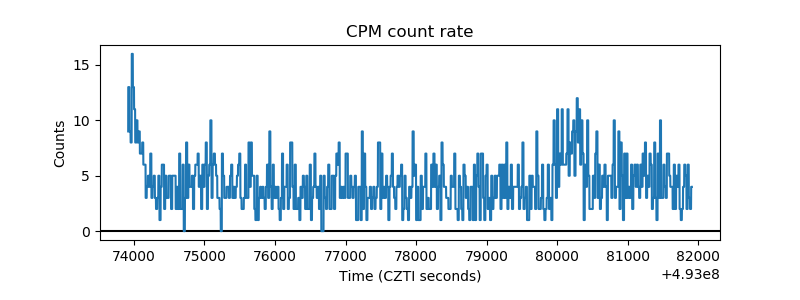 |
| CZT Counter | 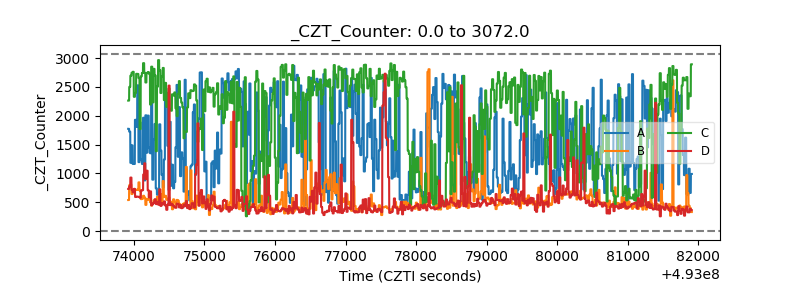 |
| +2.5 Volts monitor |  |
| +5 Volts monitor | 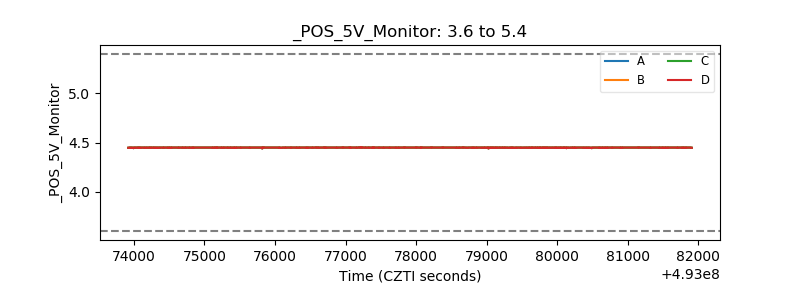 |
| _ROLL_ROT | 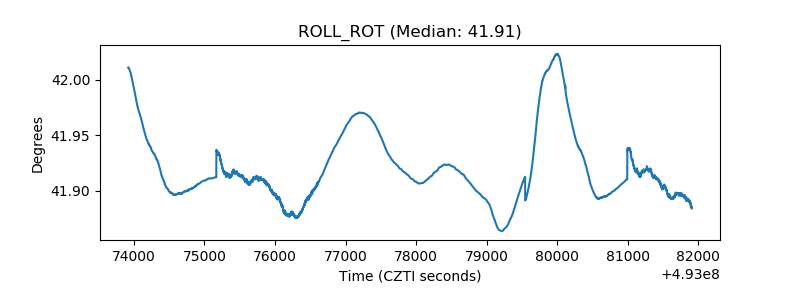 |
| _Roll_DEC | 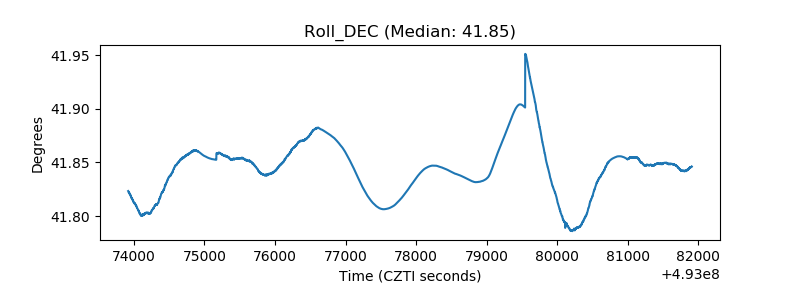 |
| _Roll_RA | 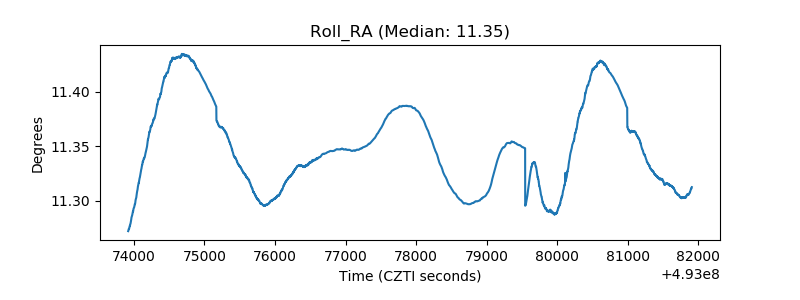 |
| Veto Counter | 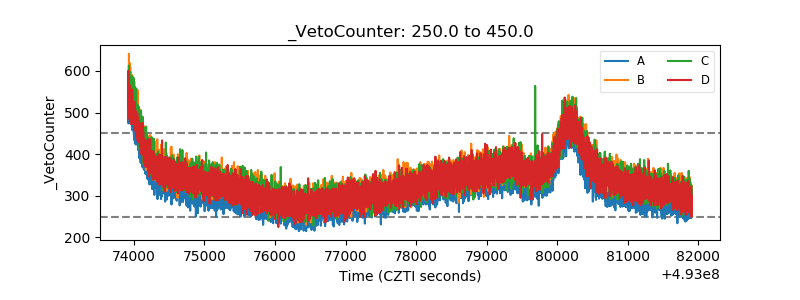 |