| Param | Original file | Final file |
|---|---|---|
| Filename | modeM0/AS1A14_002T06_9000006496_53476cztM0_level2.fits | modeM0/AS1A14_002T06_9000006496_53476cztM0_level2_quad_clean.evt |
| Size (bytes) | 974,445,120 | 101,828,160 |
| Size | 929.3 MB | 97.1 MB |
| Events in quadrant A | 13,118,018 | 506,615 |
| Events in quadrant B | 3,891,398 | 862,847 |
| Events in quadrant C | 13,316,488 | 475,784 |
| Events in quadrant D | 5,115,731 | 671,935 |
| Mode SS | |||
|---|---|---|---|
| Quadrant | BADHDUFLAG | Total packets | Discarded packets |
| A | 0 | 164 | 0 |
| B | 0 | 164 | 0 |
| C | 0 | 164 | 0 |
| D | 0 | 164 | 0 |
| Mode M0 | |||
|---|---|---|---|
| Quadrant | BADHDUFLAG | Total packets | Discarded packets |
| A | 0 | 44614 | 0 |
| B | 0 | 17581 | 1 |
| C | 0 | 45109 | 0 |
| D | 0 | 21209 | 0 |
| Quadrant | Total seconds | Saturated seconds | Saturation percentage |
|---|---|---|---|
| A | 8136 | 3371 | 41.433137% |
| B | 8136 | 67 | 0.823500% |
| C | 8136 | 3340 | 41.052114% |
| D | 8136 | 412 | 5.063913% |
Noise dominated data is calculated using 1-second bins in cleaned event files. If a bin has >2000 counts, and if more than 50% of those come from <1% of pixels, then it is considered to be noise-dominated and hence unusable.
| Quadrant | # 1 sec bins | Bins with >0 counts | Bins with >2000 counts | High rate bins dominated by noise | Noise dominated (total time) | Noise dominated (detector-on time) | Marked lightcurve |
|---|---|---|---|---|---|---|---|
| A | 8136 | 8136 | 2871 | 2871 | 35.29% | 35.29% | 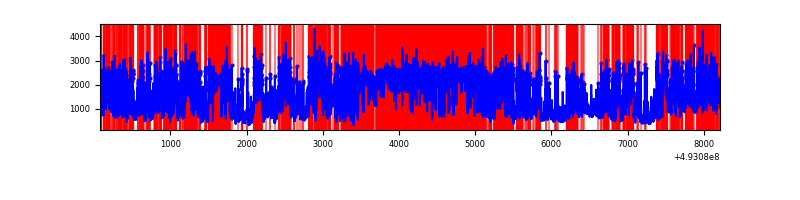 |
| B | 8136 | 8136 | 22 | 22 | 0.27% | 0.27% | 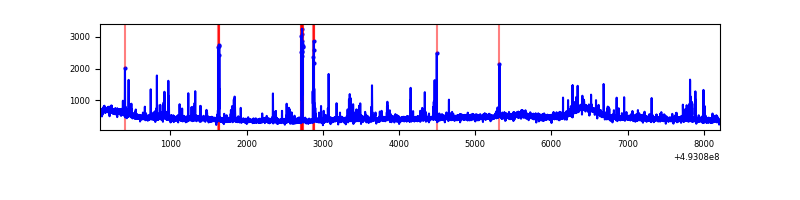 |
| C | 8135 | 8135 | 3039 | 3039 | 37.36% | 37.36% | 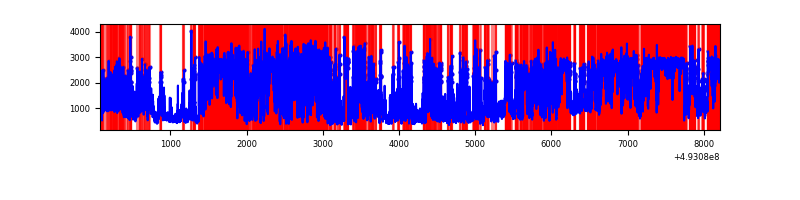 |
| D | 8136 | 8136 | 350 | 350 | 4.30% | 4.30% | 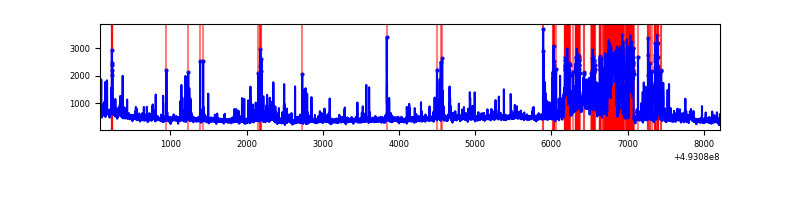 |
Top three noisy pixels from each quadrant. If the there are fewer than three noisy pixels in the level2.evt file, extra rows are filled as -1
| Pixel properties | Quadrant properties | ||||||
|---|---|---|---|---|---|---|---|
| Quadrant | DetID | PixID | Counts | Sigma | Mean | Median | Sigma |
| A | 3 | 63 | 4521688 | 25139.47 | 718 | 701 | 179.8 |
| A | 3 | 62 | 3065932 | 17044.57 | 718 | 701 | 179.8 |
| A | 15 | 174 | 2497686 | 13884.77 | 718 | 701 | 179.8 |
| B | 5 | 185 | 91660 | 471.3 | 896 | 860 | 192.7 |
| B | 1 | 223 | 61191 | 313.15 | 896 | 860 | 192.7 |
| B | 7 | 252 | 48369 | 246.59 | 896 | 860 | 192.7 |
| C | 1 | 241 | 3874077 | 19681.78 | 718 | 713 | 196.8 |
| C | 15 | 224 | 3764505 | 19125.01 | 718 | 713 | 196.8 |
| C | 7 | 64 | 632301 | 3209.3 | 718 | 713 | 196.8 |
| D | 3 | 12 | 1028512 | 4259.02 | 853 | 816 | 241.3 |
| D | 4 | 234 | 144182 | 594.14 | 853 | 816 | 241.3 |
| D | 5 | 173 | 71940 | 294.75 | 853 | 816 | 241.3 |
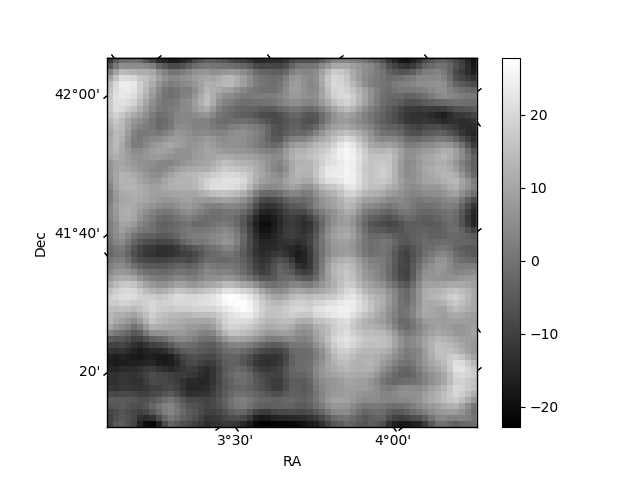
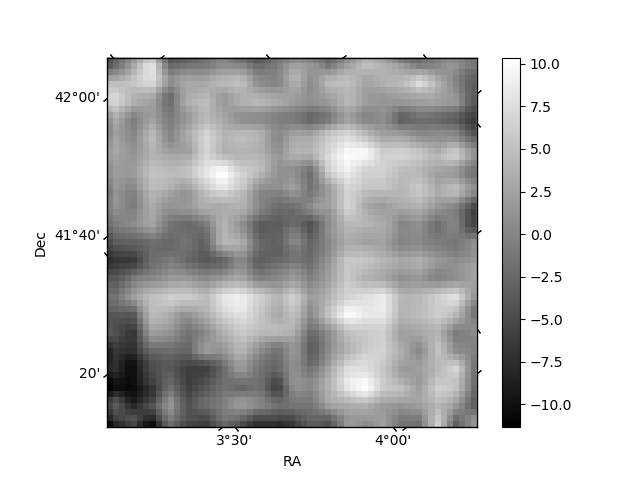
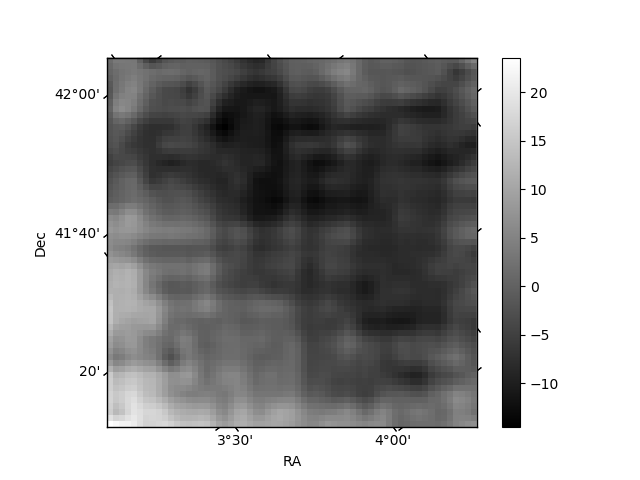
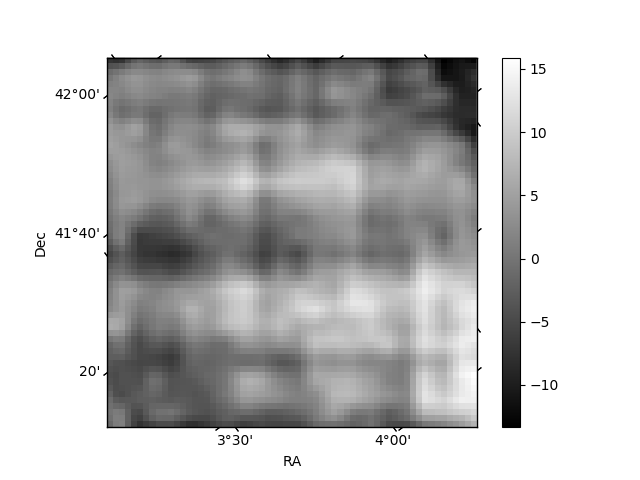
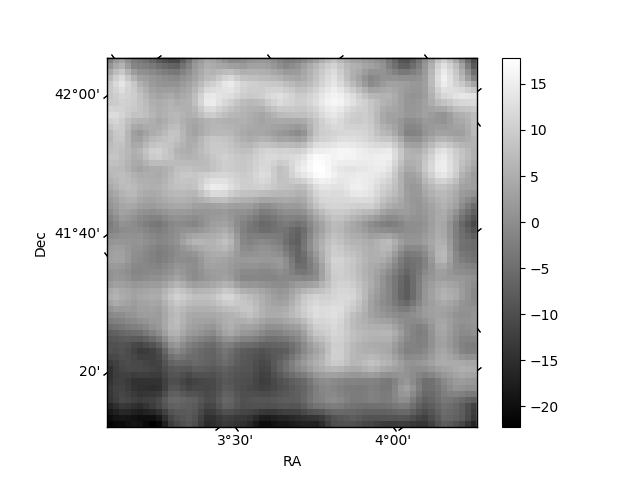
Histogram calculated using DETX and DETY for each event in the final _common_clean file
| Quadrant A | 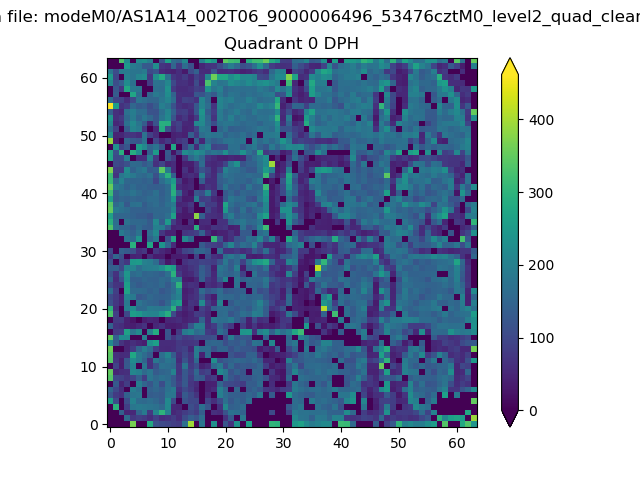 |
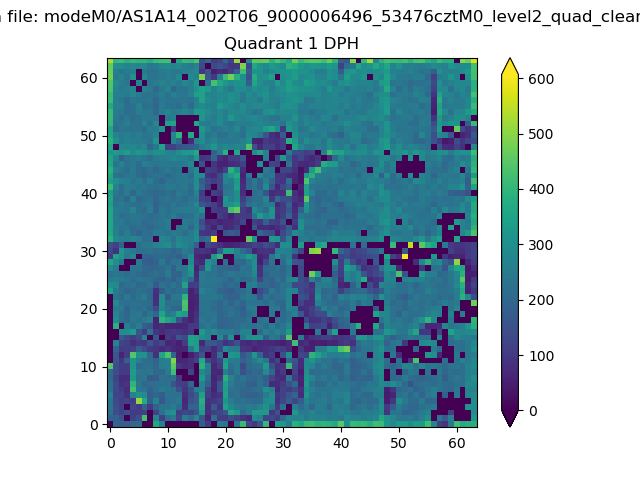 |
Quadrant B |
|---|---|---|---|
| Quadrant D | 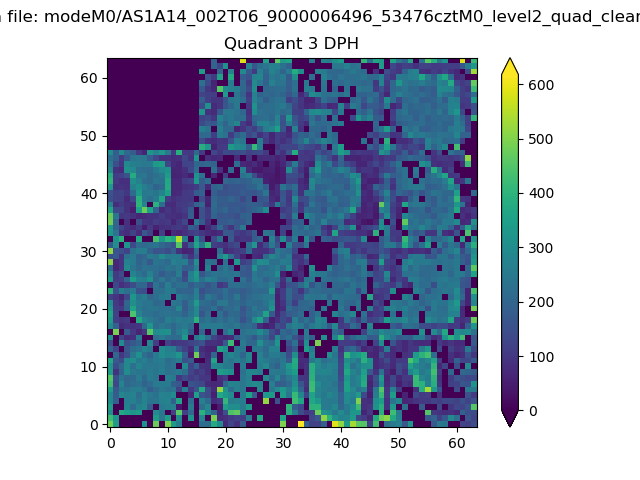 |
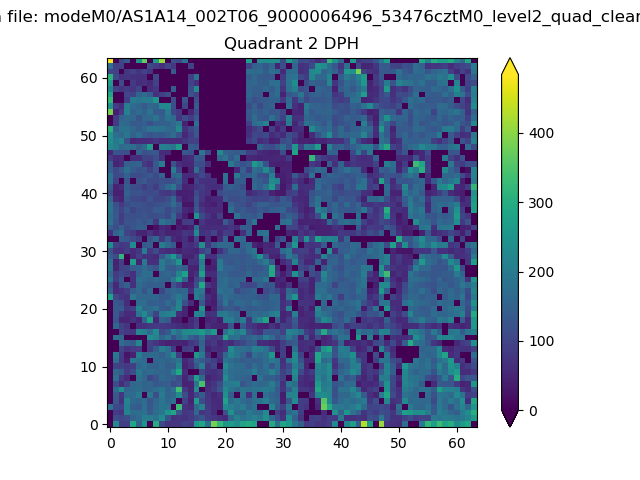 |
Quadrant C |
| Plot type | Count rate plots | Images |
|---|---|---|
| Comparison with Poisson distribution Blue bars denote a histogram of data divided into 1 sec bins. Red curve is a Poisson curve with rate = median count rate of data. |
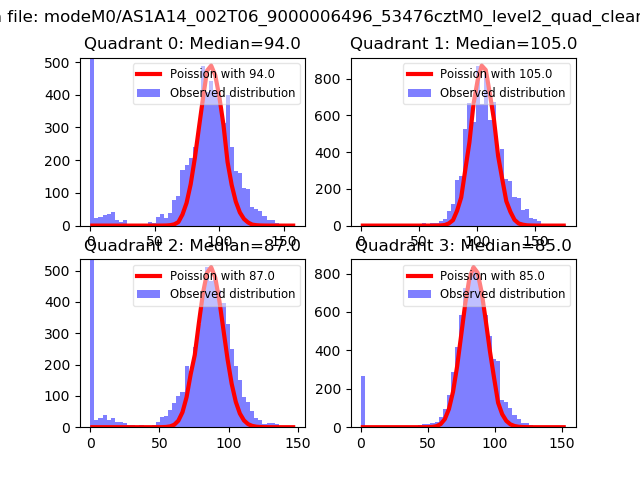 |
 |
| Quadrant-wise count rates Data is divided into 100 sec bins |
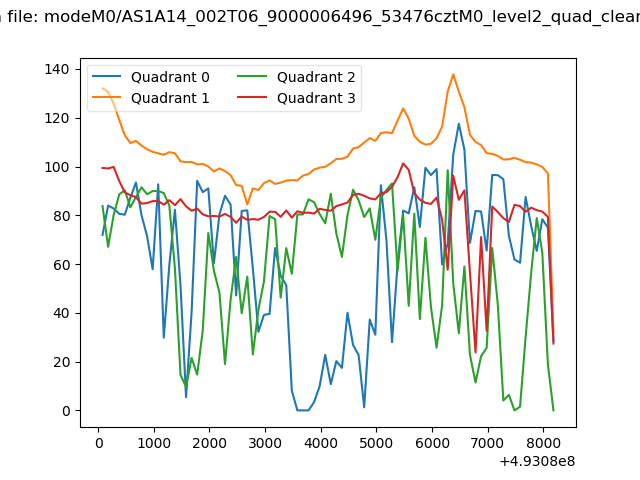 |
|
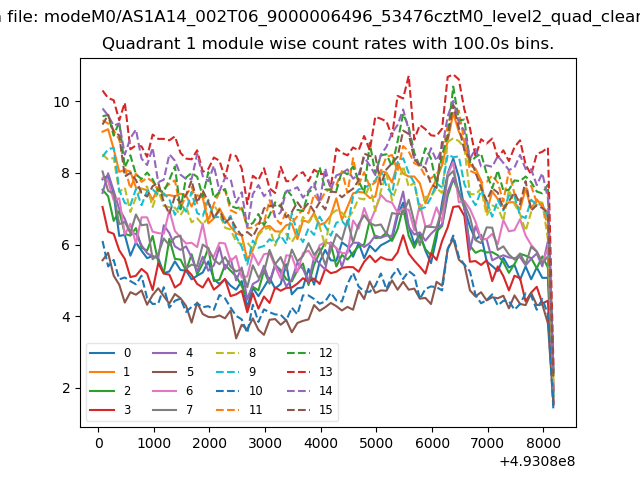
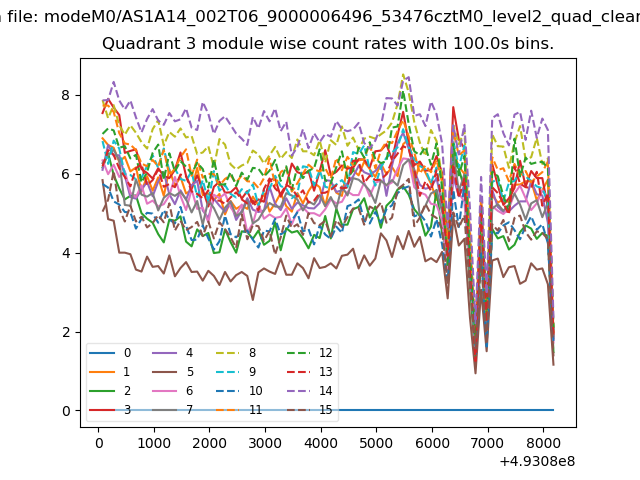
| Module-wise count rates for Quadrant A Data is divided into 100 sec bins |
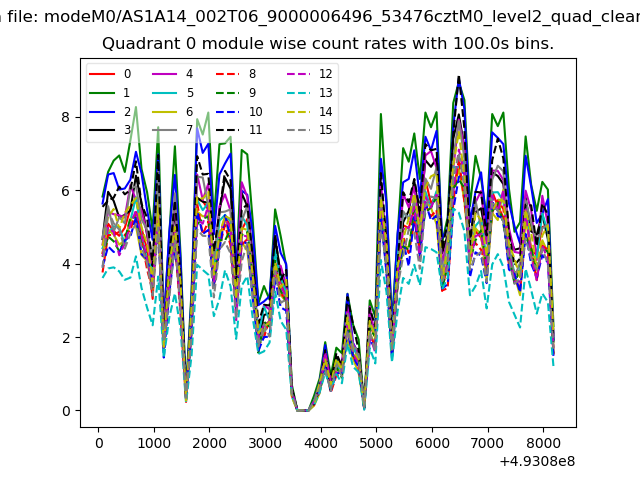 |
 |
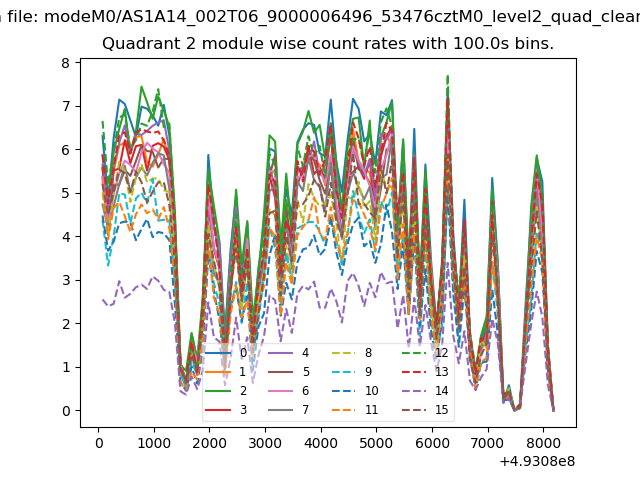
| Module-wise count rates for Quadrant B Data is divided into 100 sec bins |
 |
 |
| Module-wise count rates for Quadrant C Data is divided into 100 sec bins |
 |
 |
| Module-wise count rates for Quadrant D Data is divided into 100 sec bins |
 |
 |
| Parameter | Plot |
|---|---|
| CZT HV Monitor | 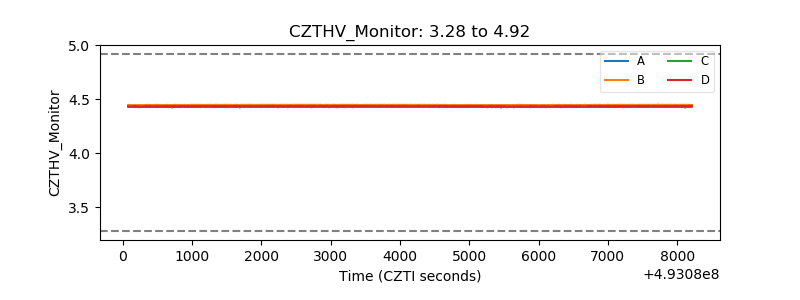 |
| D_VDD | 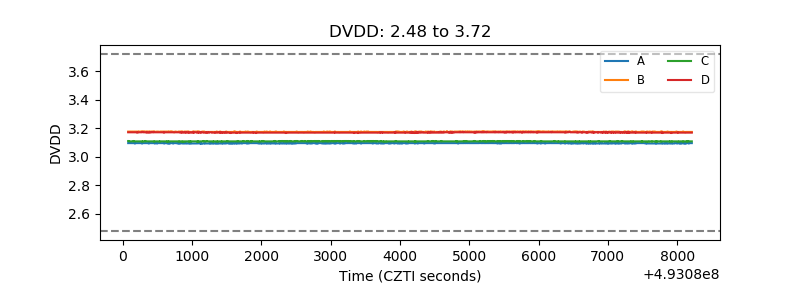 |
| Temperature 1 | 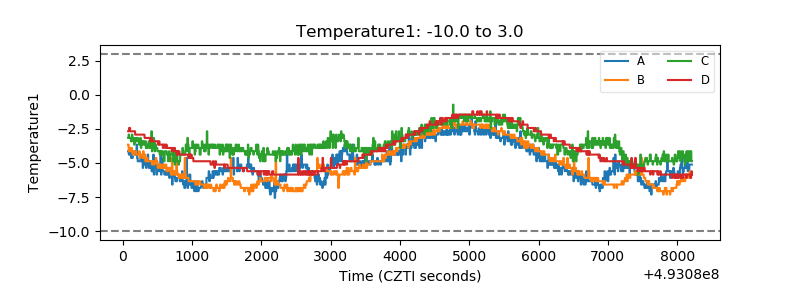 |
| Veto HV Monitor |  |
| Veto LLD | 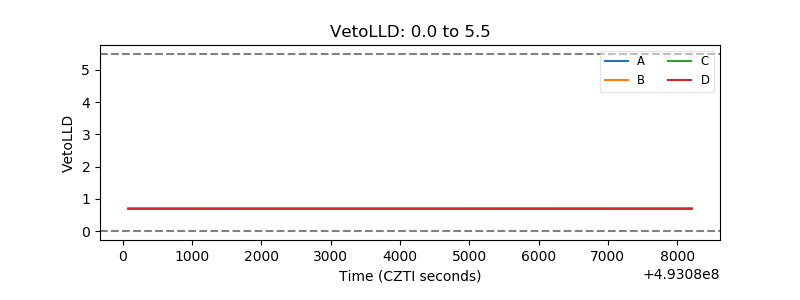 |
| Alpha Counter |  |
| _CPM_Rate | 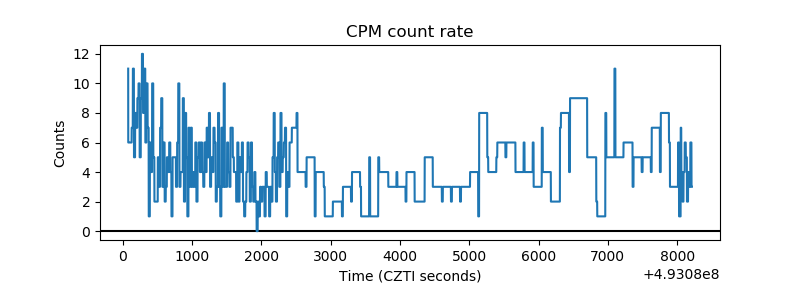 |
| CZT Counter | 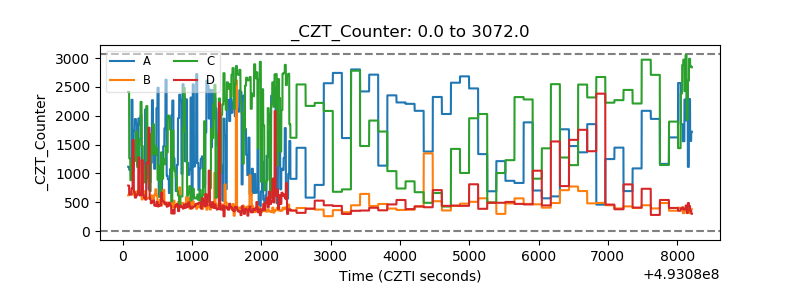 |
| +2.5 Volts monitor |  |
| +5 Volts monitor |  |
| _ROLL_ROT | 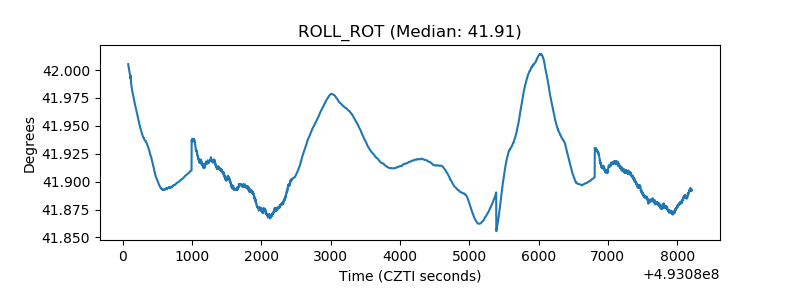 |
| _Roll_DEC | 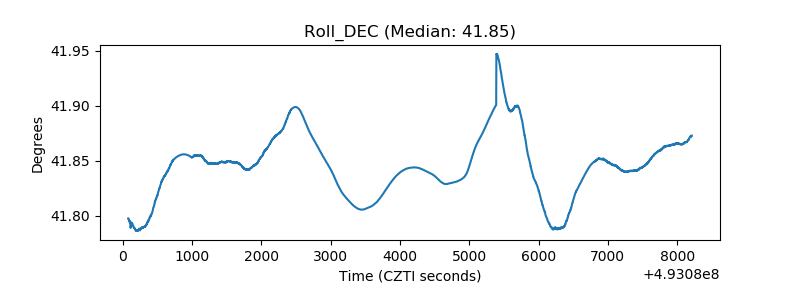 |
| _Roll_RA | 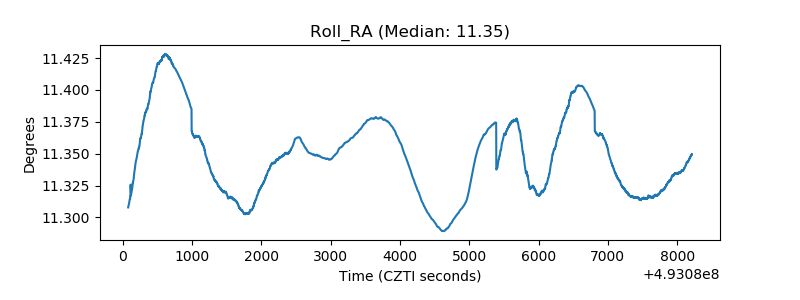 |
| Veto Counter | 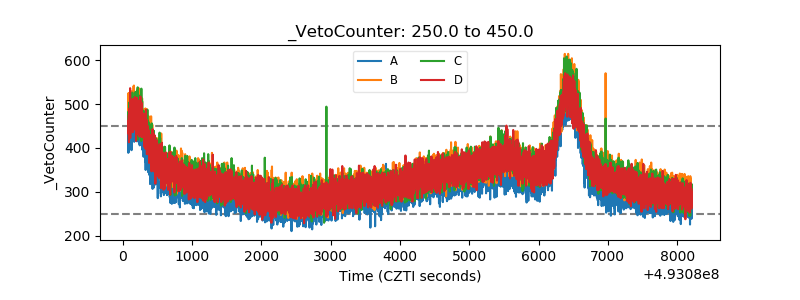 |