| Param | Original file | Final file |
|---|---|---|
| Filename | modeM0/AS1A14_002T06_9000006496_53479cztM0_level2.fits | modeM0/AS1A14_002T06_9000006496_53479cztM0_level2_quad_clean.evt |
| Size (bytes) | 2,409,013,440 | 217,978,560 |
| Size | 2.2 GB | 207.9 MB |
| Events in quadrant A | 28,722,915 | 1,193,651 |
| Events in quadrant B | 9,563,126 | 1,892,367 |
| Events in quadrant C | 39,412,747 | 677,789 |
| Events in quadrant D | 10,018,988 | 1,532,989 |
| Mode M9 | |||
|---|---|---|---|
| Quadrant | BADHDUFLAG | Total packets | Discarded packets |
| A | 0 | 14 | 0 |
| B | 0 | 14 | 0 |
| C | 0 | 14 | 0 |
| D | 0 | 14 | 0 |
| Mode SS | |||
|---|---|---|---|
| Quadrant | BADHDUFLAG | Total packets | Discarded packets |
| A | 0 | 386 | 0 |
| B | 0 | 386 | 0 |
| C | 0 | 386 | 0 |
| D | 0 | 386 | 0 |
| Mode M0 | |||
|---|---|---|---|
| Quadrant | BADHDUFLAG | Total packets | Discarded packets |
| A | 0 | 98518 | 3 |
| B | 0 | 42030 | 3 |
| C | 0 | 130102 | 3 |
| D | 0 | 44009 | 4 |
| Quadrant | Total seconds | Saturated seconds | Saturation percentage |
|---|---|---|---|
| A | 18890 | 6830 | 36.156697% |
| B | 18891 | 448 | 2.371500% |
| C | 18891 | 12041 | 63.739347% |
| D | 18890 | 476 | 2.519852% |
Noise dominated data is calculated using 1-second bins in cleaned event files. If a bin has >2000 counts, and if more than 50% of those come from <1% of pixels, then it is considered to be noise-dominated and hence unusable.
| Quadrant | # 1 sec bins | Bins with >0 counts | Bins with >2000 counts | High rate bins dominated by noise | Noise dominated (total time) | Noise dominated (detector-on time) | Marked lightcurve |
|---|---|---|---|---|---|---|---|
| A | 20270 | 18890 | 6081 | 6081 | 30.00% | 32.19% | 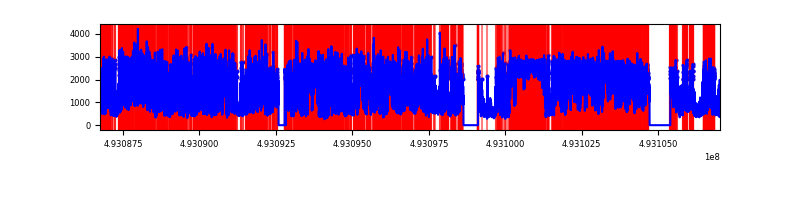 |
| B | 20271 | 18891 | 103 | 103 | 0.51% | 0.55% | 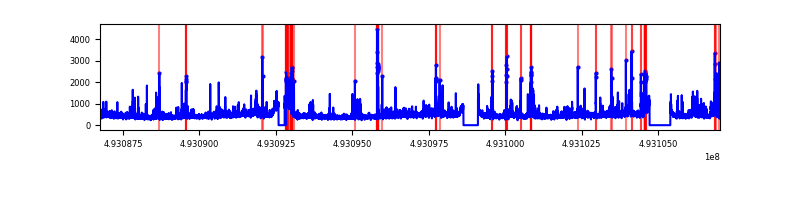 |
| C | 20270 | 18890 | 11637 | 11637 | 57.41% | 61.60% | 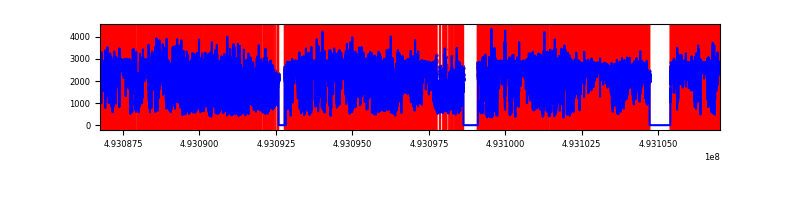 |
| D | 20270 | 18893 | 372 | 372 | 1.84% | 1.97% | 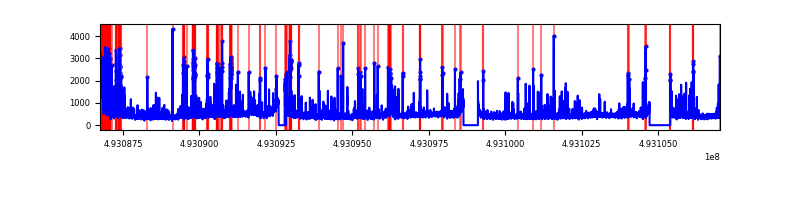 |
Top three noisy pixels from each quadrant. If the there are fewer than three noisy pixels in the level2.evt file, extra rows are filled as -1
| Pixel properties | Quadrant properties | ||||||
|---|---|---|---|---|---|---|---|
| Quadrant | DetID | PixID | Counts | Sigma | Mean | Median | Sigma |
| A | 3 | 63 | 14319161 | 34254.9 | 1707 | 1669 | 418.0 |
| A | 3 | 62 | 4303476 | 10292.16 | 1707 | 1669 | 418.0 |
| A | 15 | 174 | 2977130 | 7118.85 | 1707 | 1669 | 418.0 |
| B | 10 | 254 | 467223 | 1072.61 | 2018 | 1941 | 433.8 |
| B | 5 | 185 | 285460 | 653.59 | 2018 | 1941 | 433.8 |
| B | 15 | 20 | 193486 | 441.57 | 2018 | 1941 | 433.8 |
| C | 7 | 64 | 16049088 | 45172.57 | 1300 | 1288 | 355.3 |
| C | 1 | 241 | 7765707 | 21855.88 | 1300 | 1288 | 355.3 |
| C | 15 | 224 | 4001182 | 11259.21 | 1300 | 1288 | 355.3 |
| D | 3 | 12 | 999899 | 1826.49 | 1954 | 1869 | 546.4 |
| D | 5 | 173 | 169240 | 306.3 | 1954 | 1869 | 546.4 |
| D | 7 | 70 | 148365 | 268.1 | 1954 | 1869 | 546.4 |
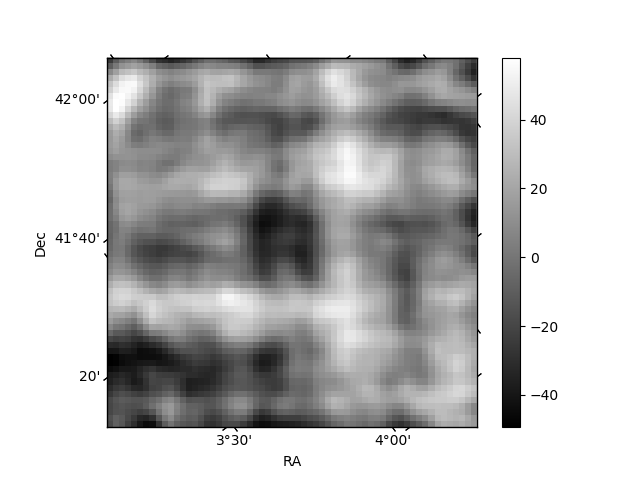
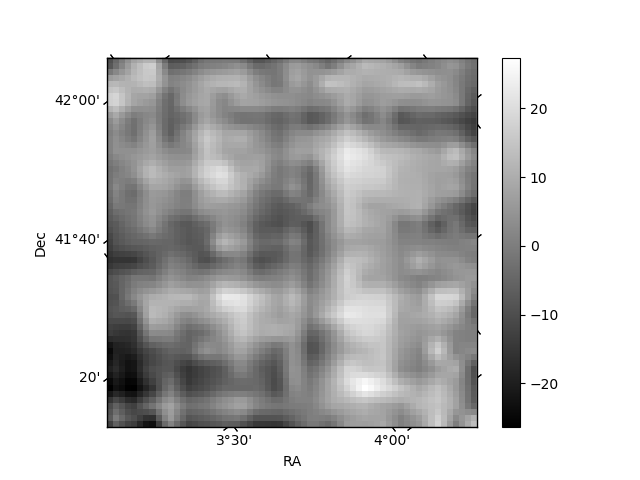
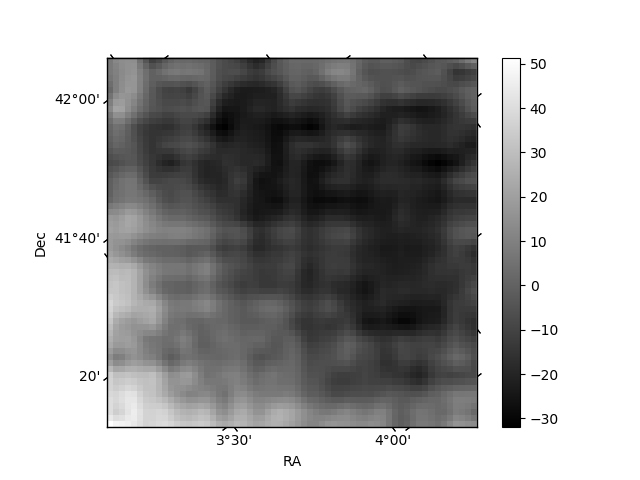
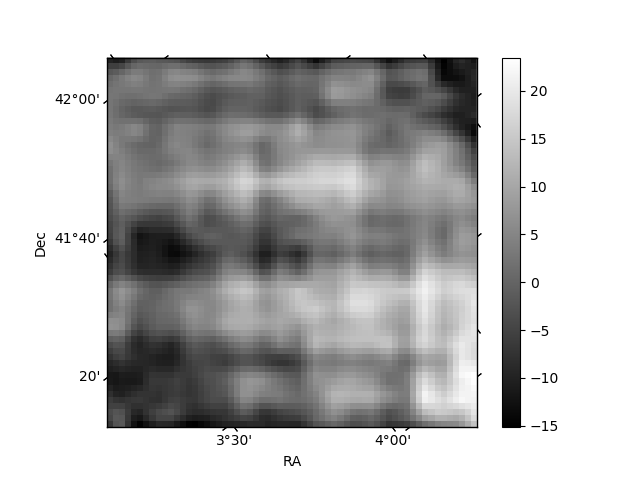
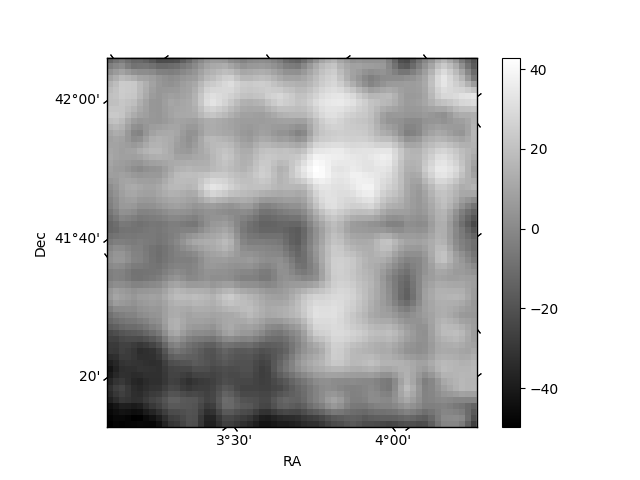
Histogram calculated using DETX and DETY for each event in the final _common_clean file
| Quadrant A | 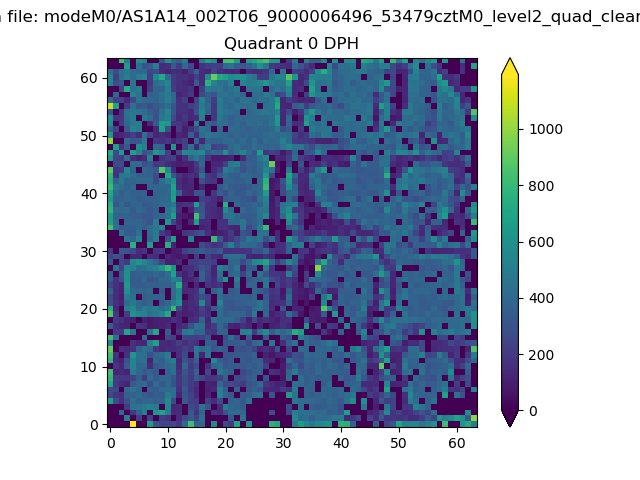 |
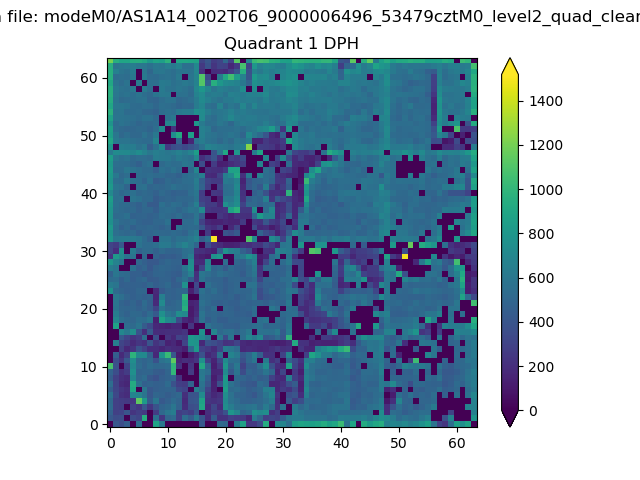 |
Quadrant B |
|---|---|---|---|
| Quadrant D | 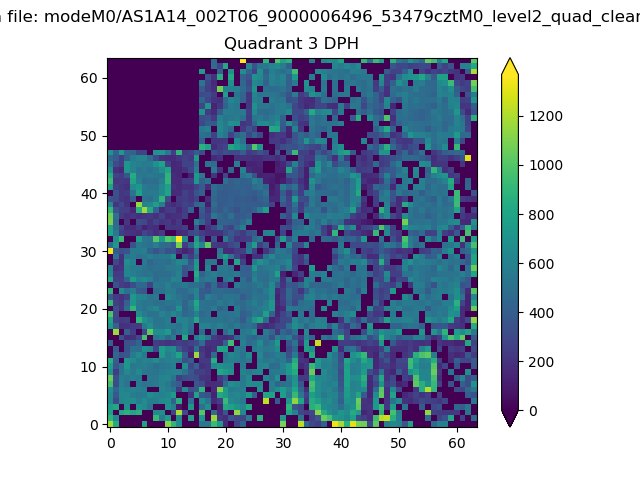 |
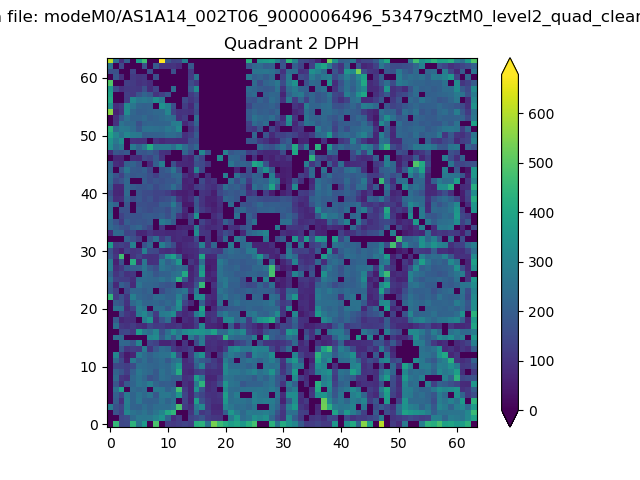 |
Quadrant C |
| Plot type | Count rate plots | Images |
|---|---|---|
| Comparison with Poisson distribution Blue bars denote a histogram of data divided into 1 sec bins. Red curve is a Poisson curve with rate = median count rate of data. |
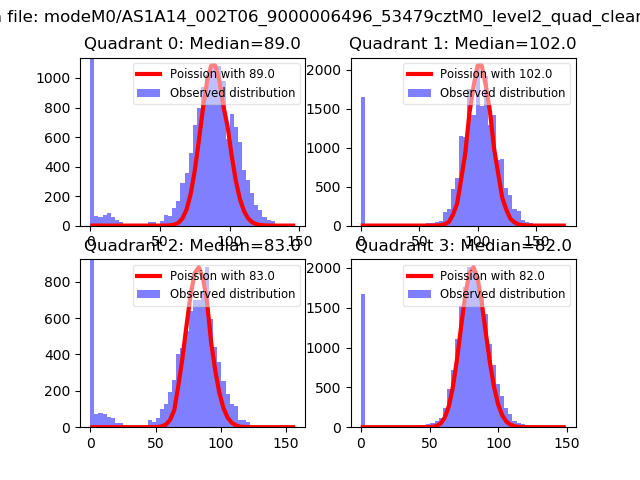 |
 |
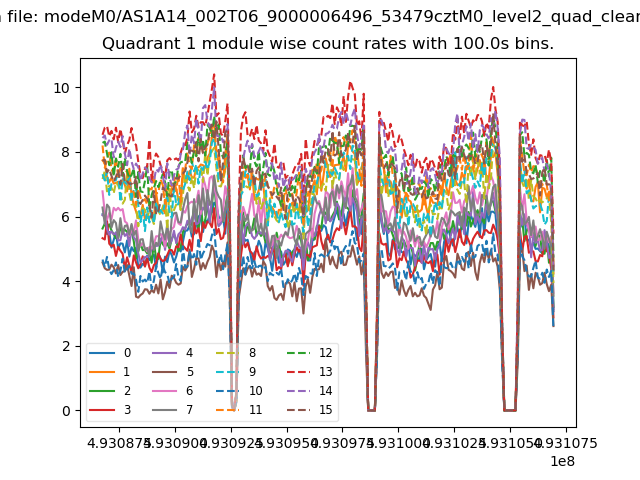
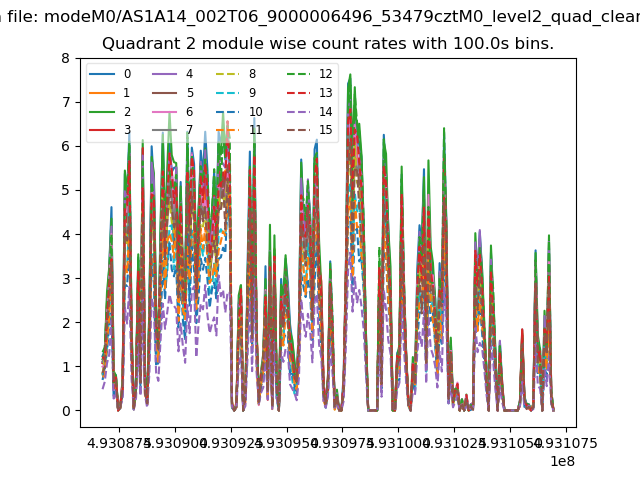
| Quadrant-wise count rates Data is divided into 100 sec bins |
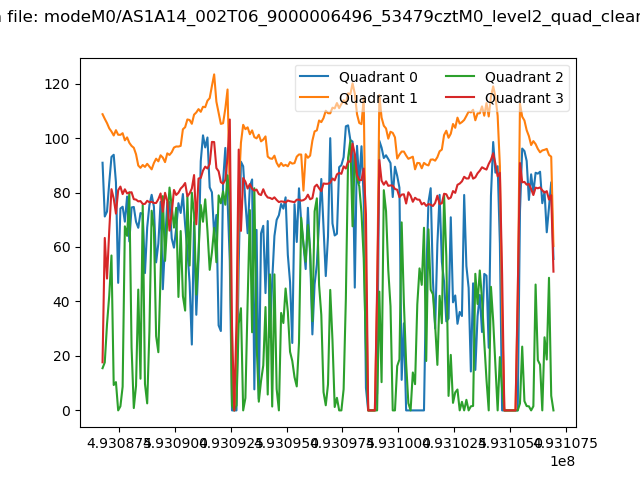 |
|
| Module-wise count rates for Quadrant A Data is divided into 100 sec bins |
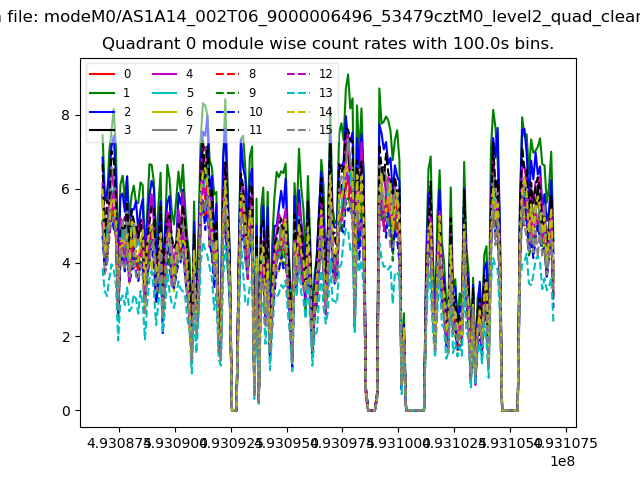 |
 |
| Module-wise count rates for Quadrant B Data is divided into 100 sec bins |
 |
 |
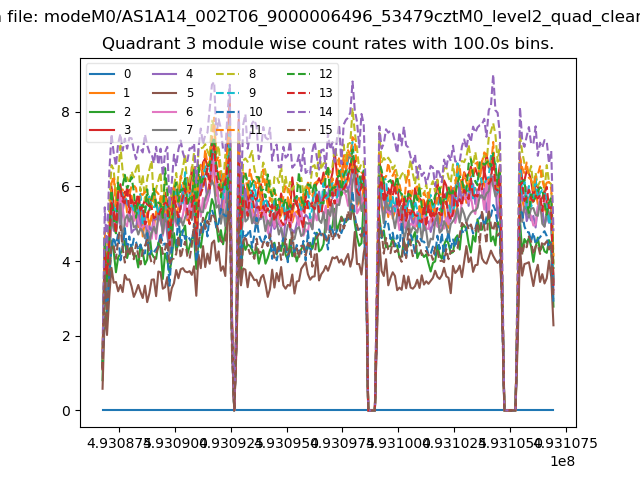
| Module-wise count rates for Quadrant C Data is divided into 100 sec bins |
 |
 |
| Module-wise count rates for Quadrant D Data is divided into 100 sec bins |
 |
 |
| Parameter | Plot |
|---|---|
| CZT HV Monitor | 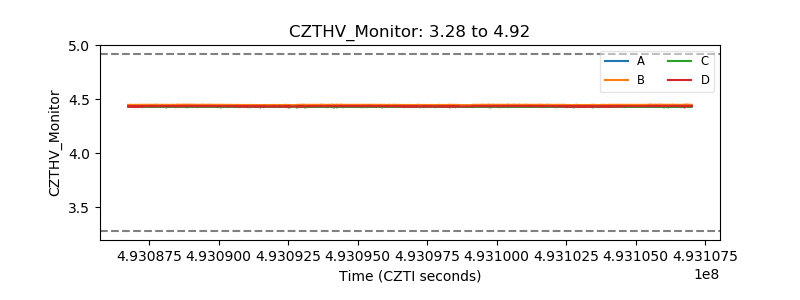 |
| D_VDD | 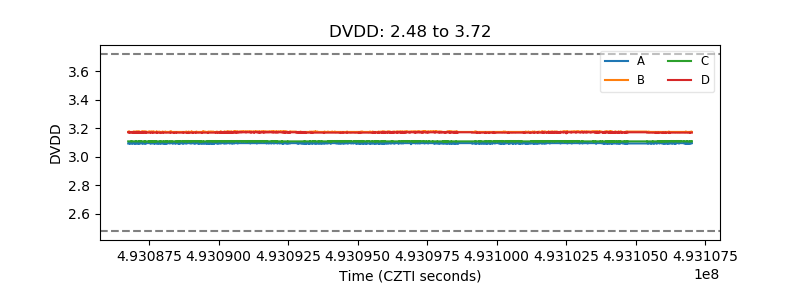 |
| Temperature 1 | 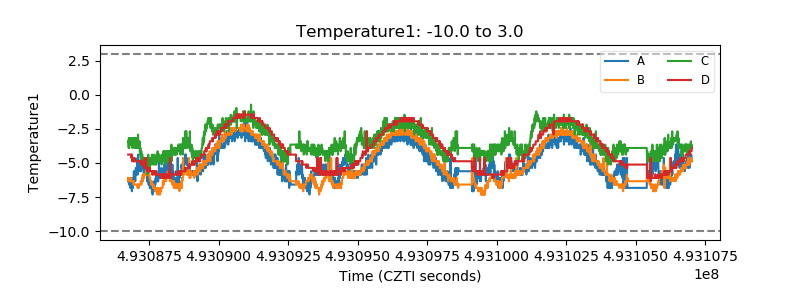 |
| Veto HV Monitor | 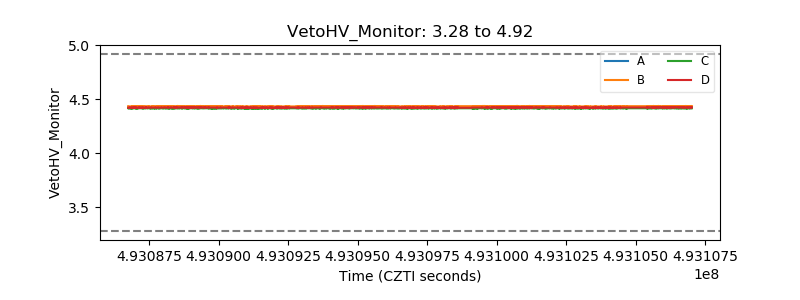 |
| Veto LLD | 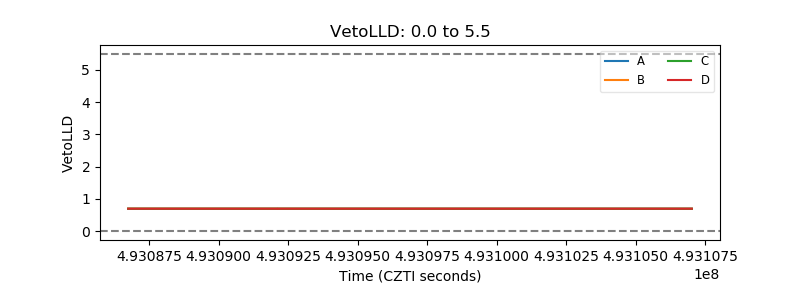 |
| Alpha Counter | 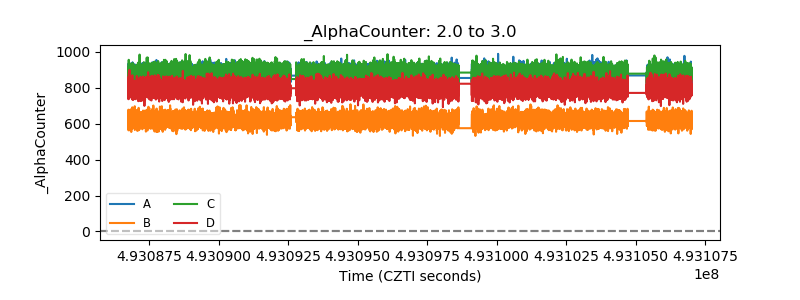 |
| _CPM_Rate | 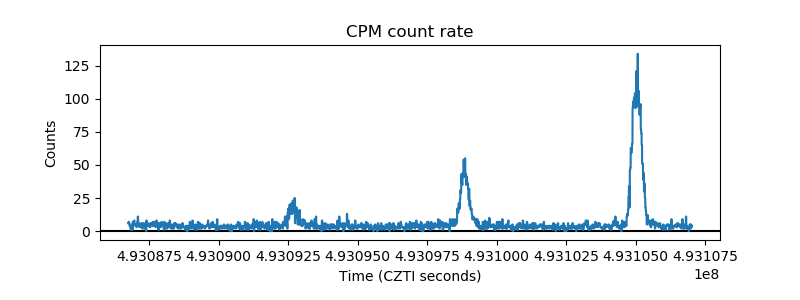 |
| CZT Counter | 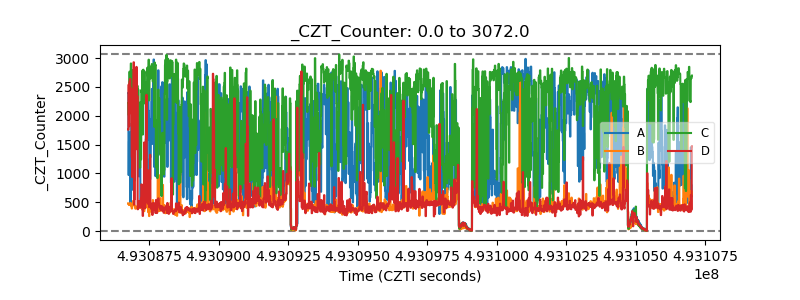 |
| +2.5 Volts monitor |  |
| +5 Volts monitor | 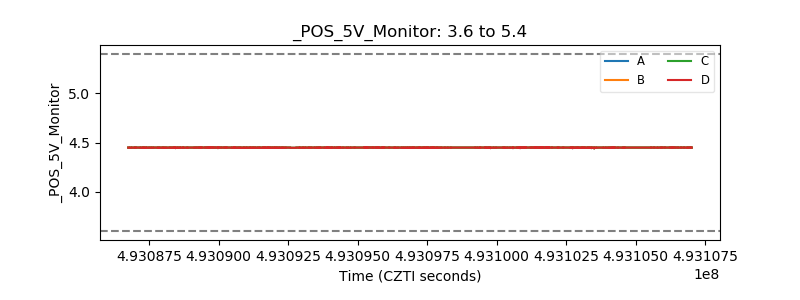 |
| _ROLL_ROT | 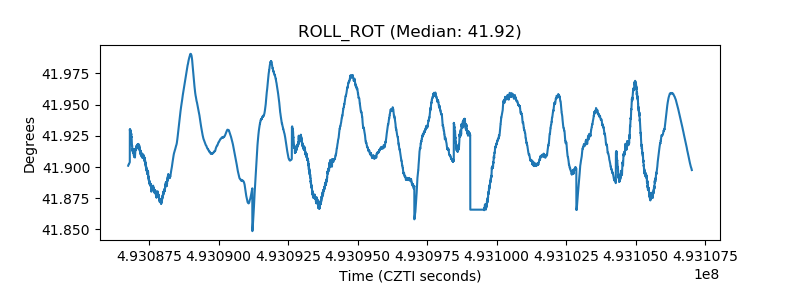 |
| _Roll_DEC | 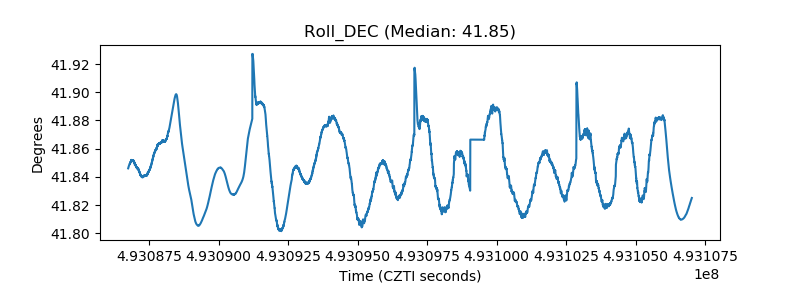 |
| _Roll_RA | 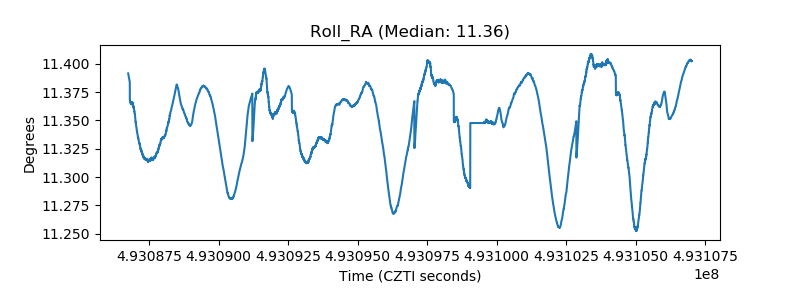 |
| Veto Counter | 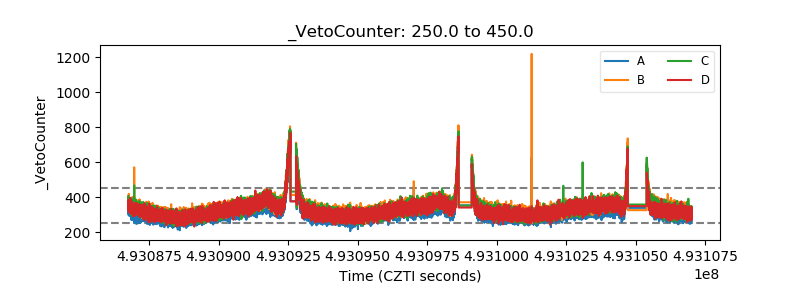 |