| Param | Original file | Final file |
|---|---|---|
| Filename | modeM0/AS1A14_002T06_9000006496_53480cztM0_level2.fits | modeM0/AS1A14_002T06_9000006496_53480cztM0_level2_quad_clean.evt |
| Size (bytes) | 754,862,400 | 76,055,040 |
| Size | 719.9 MB | 72.5 MB |
| Events in quadrant A | 8,574,722 | 480,985 |
| Events in quadrant B | 3,346,217 | 639,406 |
| Events in quadrant C | 12,777,188 | 223,134 |
| Events in quadrant D | 2,765,681 | 527,579 |
| Mode M9 | |||
|---|---|---|---|
| Quadrant | BADHDUFLAG | Total packets | Discarded packets |
| A | 0 | 9 | 0 |
| B | 0 | 9 | 0 |
| C | 0 | 9 | 0 |
| D | 0 | 9 | 0 |
| Mode SS | |||
|---|---|---|---|
| Quadrant | BADHDUFLAG | Total packets | Discarded packets |
| A | 0 | 126 | 0 |
| B | 0 | 126 | 0 |
| C | 0 | 126 | 0 |
| D | 0 | 126 | 0 |
| Mode M0 | |||
|---|---|---|---|
| Quadrant | BADHDUFLAG | Total packets | Discarded packets |
| A | 0 | 29772 | 1 |
| B | 0 | 14112 | 1 |
| C | 0 | 42224 | 7 |
| D | 0 | 12870 | 1 |
| Quadrant | Total seconds | Saturated seconds | Saturation percentage |
|---|---|---|---|
| A | 6177 | 1530 | 24.769305% |
| B | 6177 | 103 | 1.667476% |
| C | 6176 | 3965 | 64.200130% |
| D | 6177 | 53 | 0.858022% |
Noise dominated data is calculated using 1-second bins in cleaned event files. If a bin has >2000 counts, and if more than 50% of those come from <1% of pixels, then it is considered to be noise-dominated and hence unusable.
| Quadrant | # 1 sec bins | Bins with >0 counts | Bins with >2000 counts | High rate bins dominated by noise | Noise dominated (total time) | Noise dominated (detector-on time) | Marked lightcurve |
|---|---|---|---|---|---|---|---|
| A | 7061 | 6176 | 1359 | 1359 | 19.25% | 22.00% | 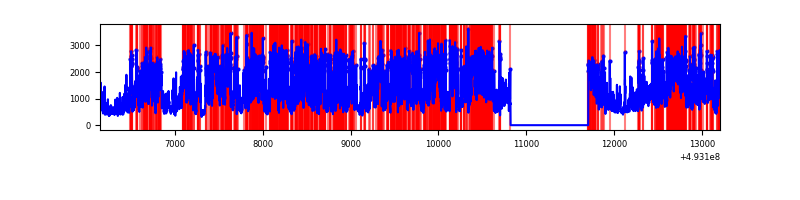 |
| B | 7062 | 6177 | 37 | 37 | 0.52% | 0.60% | 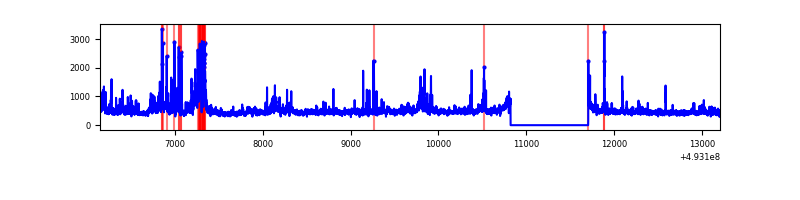 |
| C | 7060 | 6175 | 3929 | 3929 | 55.65% | 63.63% | 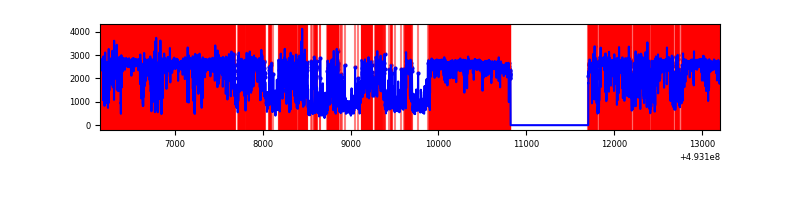 |
| D | 7062 | 6177 | 17 | 17 | 0.24% | 0.28% | 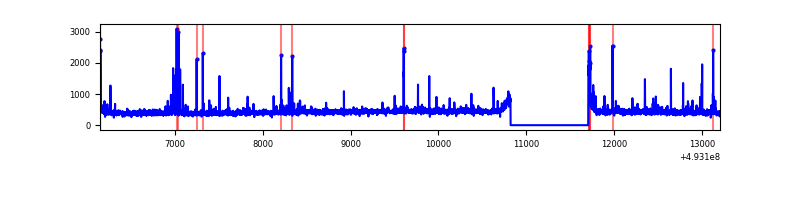 |
Top three noisy pixels from each quadrant. If the there are fewer than three noisy pixels in the level2.evt file, extra rows are filled as -1
| Pixel properties | Quadrant properties | ||||||
|---|---|---|---|---|---|---|---|
| Quadrant | DetID | PixID | Counts | Sigma | Mean | Median | Sigma |
| A | 3 | 63 | 3169187 | 21018.54 | 616 | 602 | 150.8 |
| A | 15 | 174 | 1216421 | 8065.03 | 616 | 602 | 150.8 |
| A | 3 | 62 | 1122940 | 7444.93 | 616 | 602 | 150.8 |
| B | 10 | 254 | 498624 | 3519.05 | 660 | 636 | 141.5 |
| B | 5 | 185 | 91823 | 644.38 | 660 | 636 | 141.5 |
| B | 10 | 28 | 40441 | 281.28 | 660 | 636 | 141.5 |
| C | 7 | 64 | 7685878 | 66109.49 | 419 | 415 | 116.3 |
| C | 9 | 38 | 1186366 | 10201.42 | 419 | 415 | 116.3 |
| C | 15 | 224 | 1140177 | 9804.1 | 419 | 415 | 116.3 |
| D | 3 | 12 | 99684 | 546.36 | 644 | 616 | 181.3 |
| D | 5 | 173 | 50800 | 276.76 | 644 | 616 | 181.3 |
| D | 13 | 170 | 42820 | 232.75 | 644 | 616 | 181.3 |
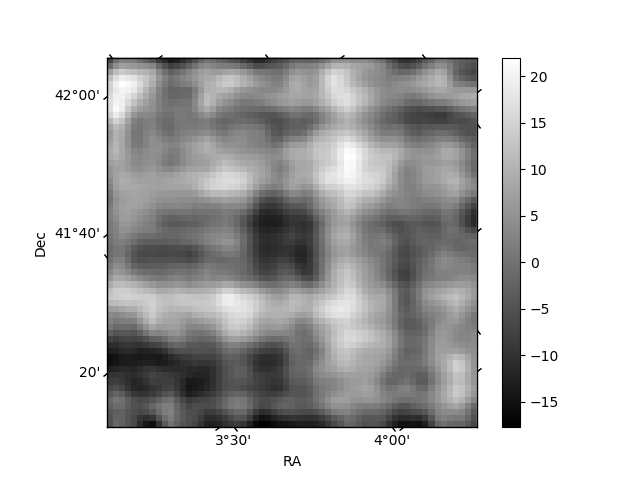
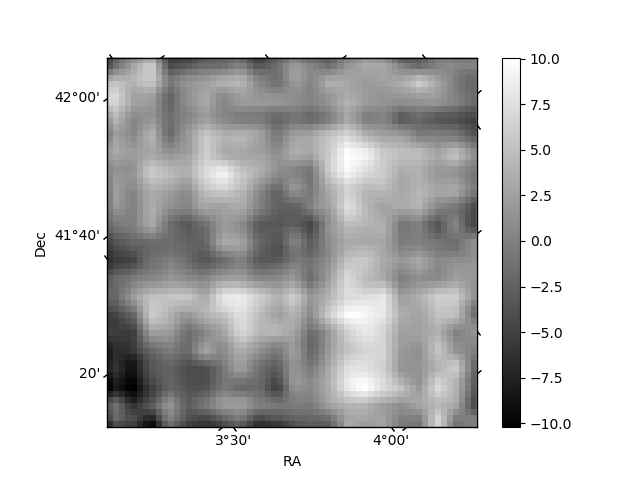
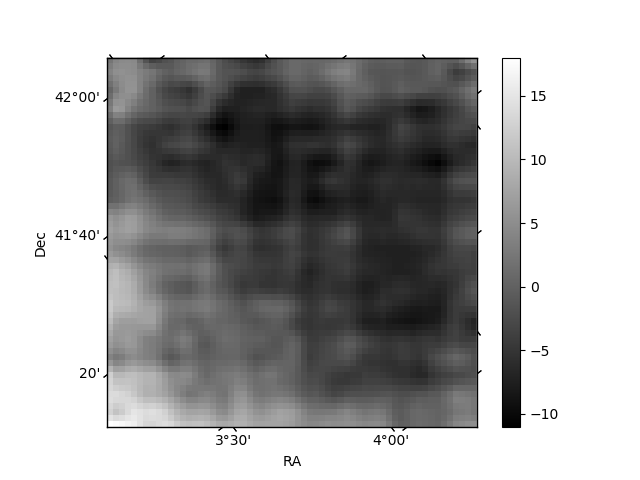
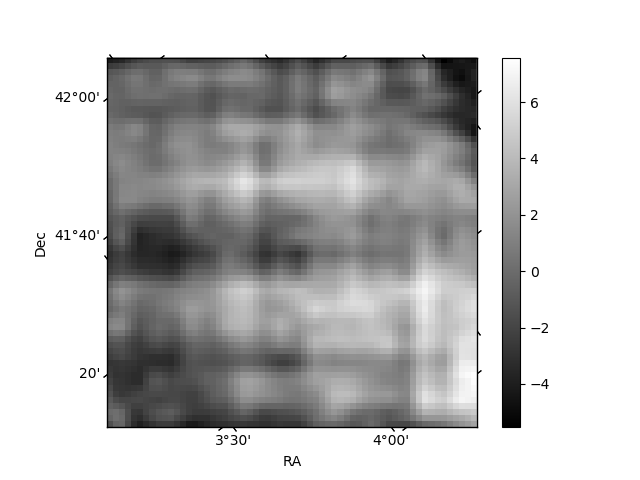
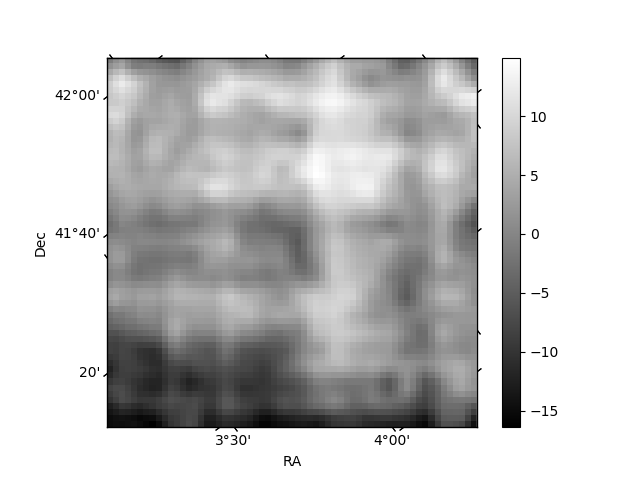
Histogram calculated using DETX and DETY for each event in the final _common_clean file
| Quadrant A | 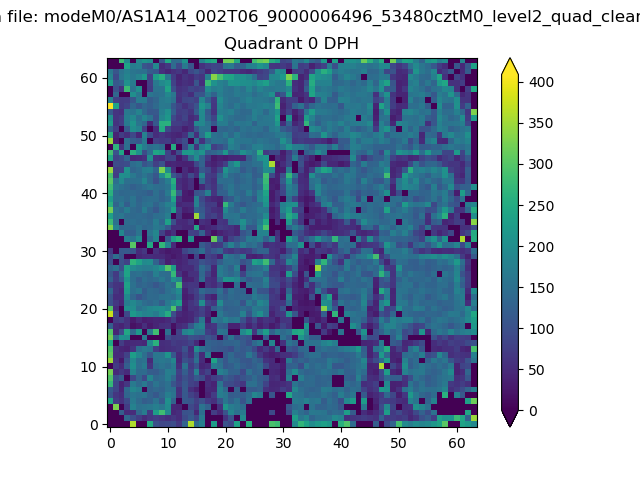 |
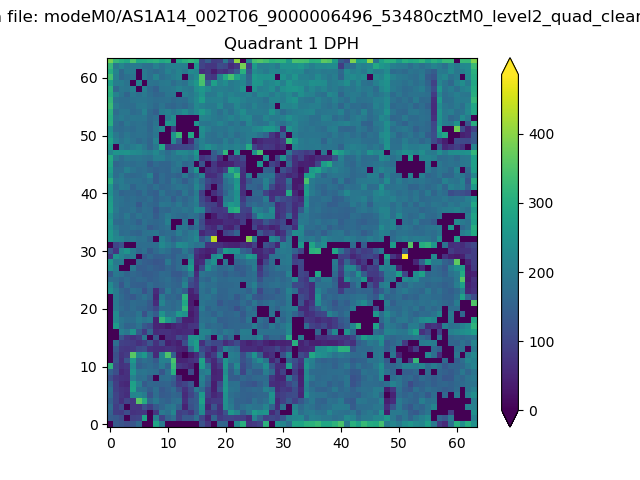 |
Quadrant B |
|---|---|---|---|
| Quadrant D | 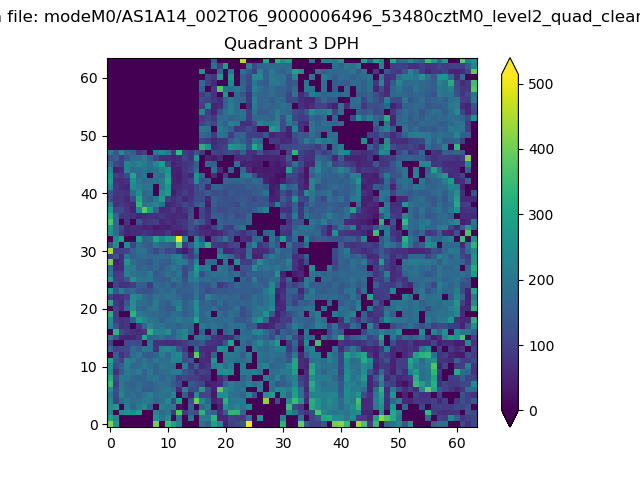 |
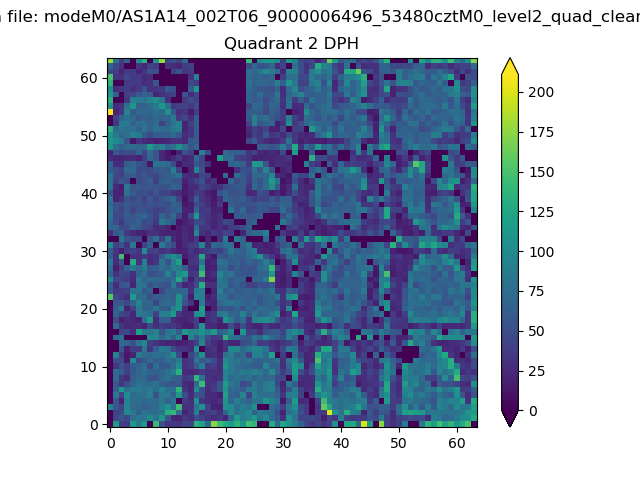 |
Quadrant C |
| Plot type | Count rate plots | Images |
|---|---|---|
| Comparison with Poisson distribution Blue bars denote a histogram of data divided into 1 sec bins. Red curve is a Poisson curve with rate = median count rate of data. |
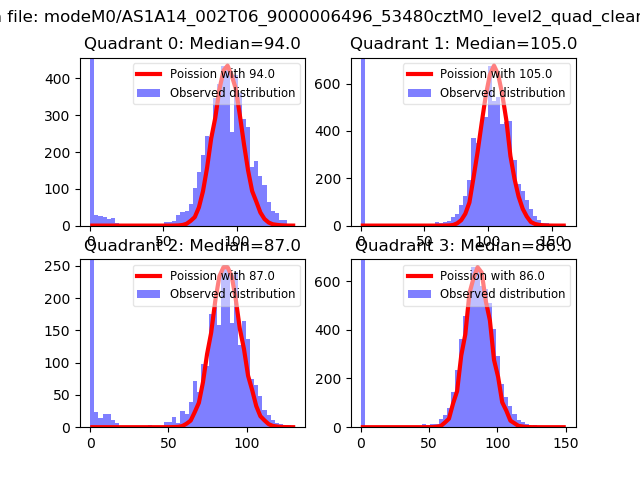 |
 |
| Quadrant-wise count rates Data is divided into 100 sec bins |
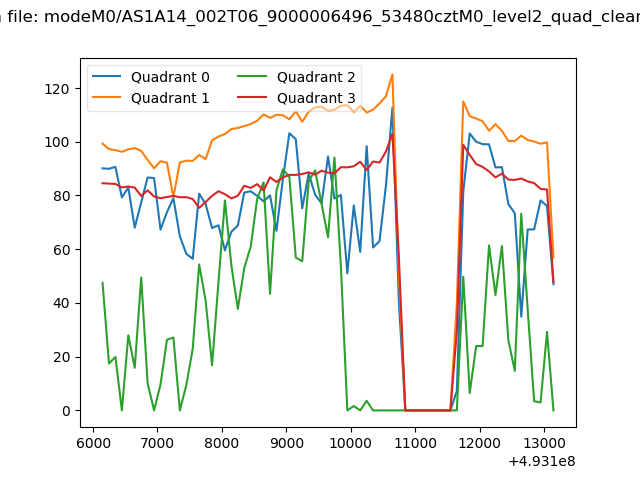 |
|
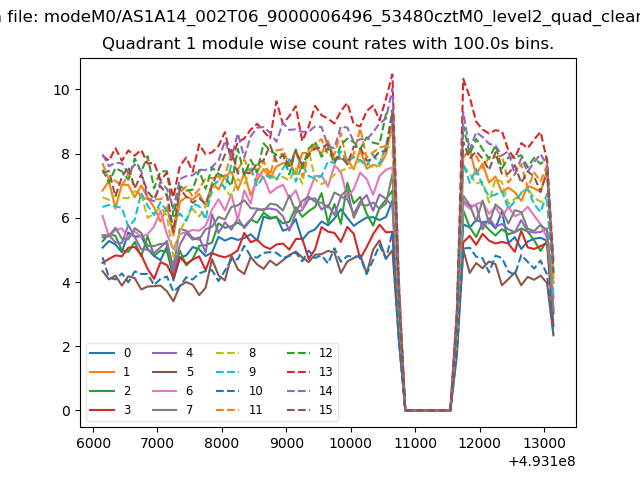
| Module-wise count rates for Quadrant A Data is divided into 100 sec bins |
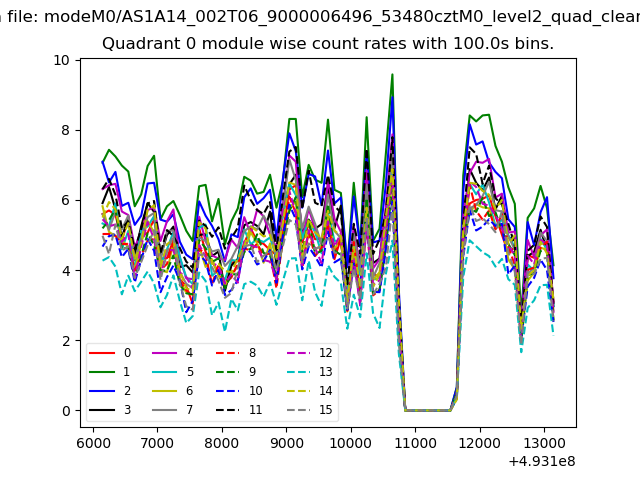 |
 |
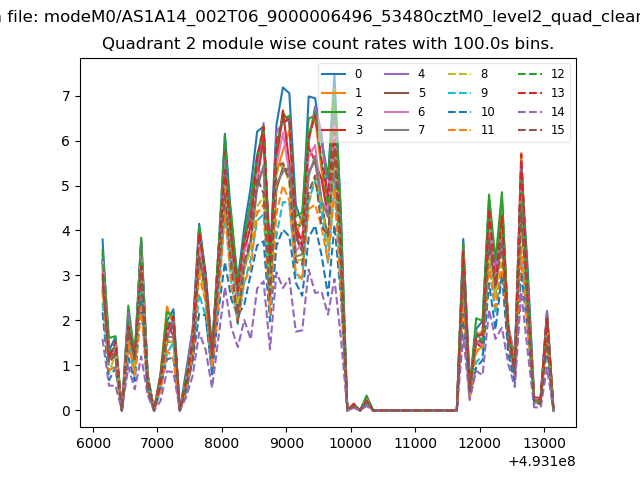
| Module-wise count rates for Quadrant B Data is divided into 100 sec bins |
 |
 |
| Module-wise count rates for Quadrant C Data is divided into 100 sec bins |
 |
 |
| Module-wise count rates for Quadrant D Data is divided into 100 sec bins |
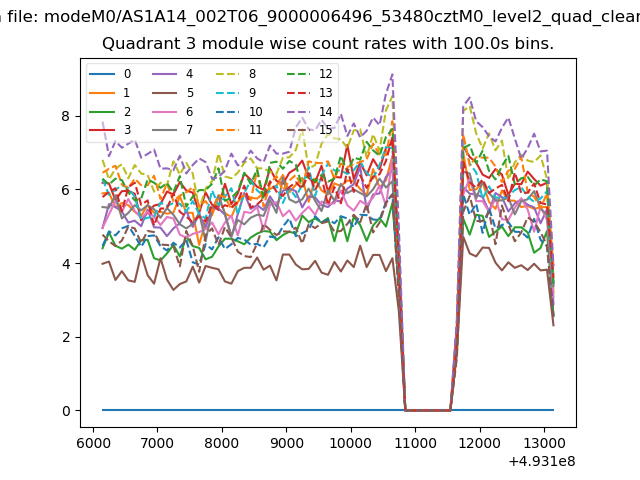 |
 |
| Parameter | Plot |
|---|---|
| CZT HV Monitor | 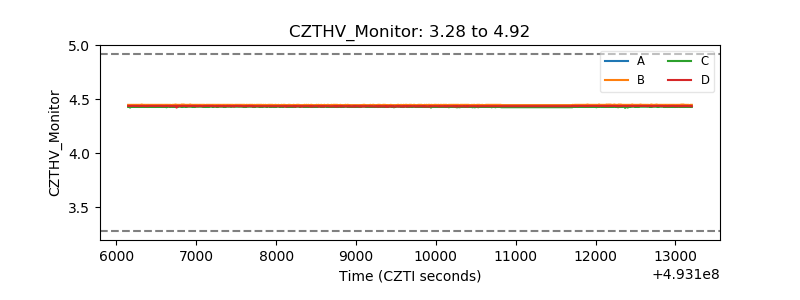 |
| D_VDD | 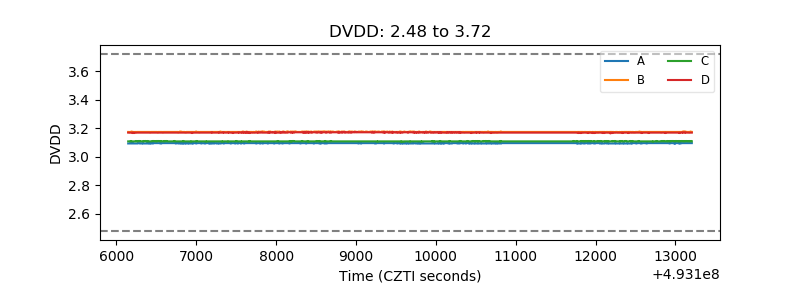 |
| Temperature 1 | 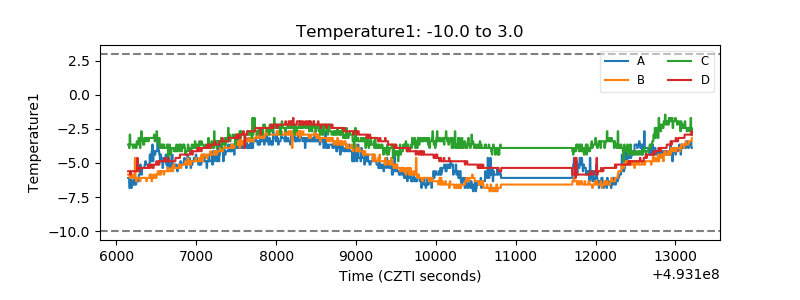 |
| Veto HV Monitor | 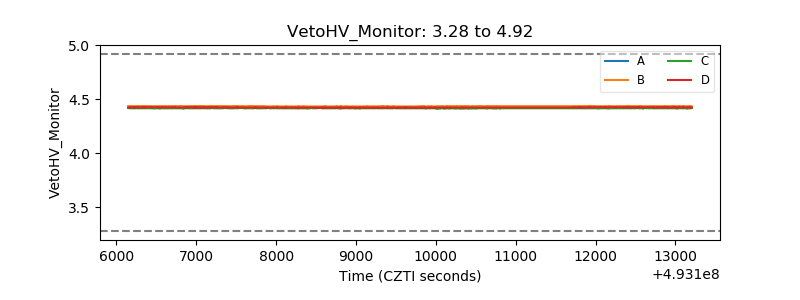 |
| Veto LLD | 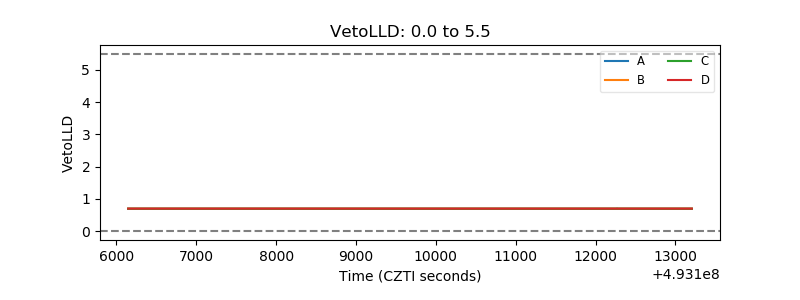 |
| Alpha Counter | 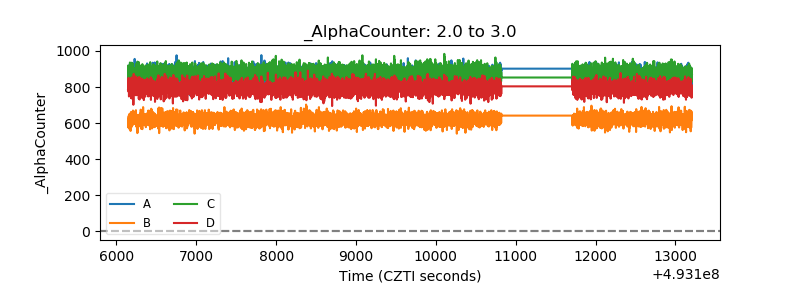 |
| _CPM_Rate | 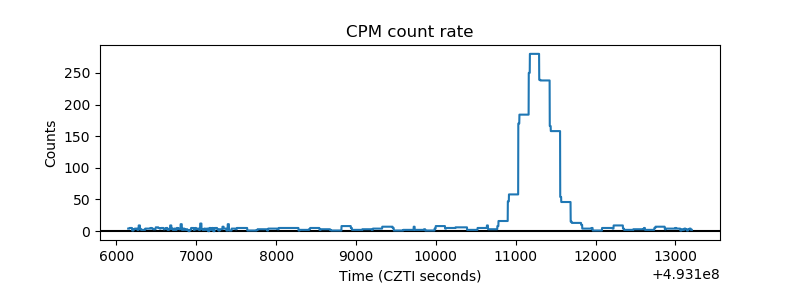 |
| CZT Counter | 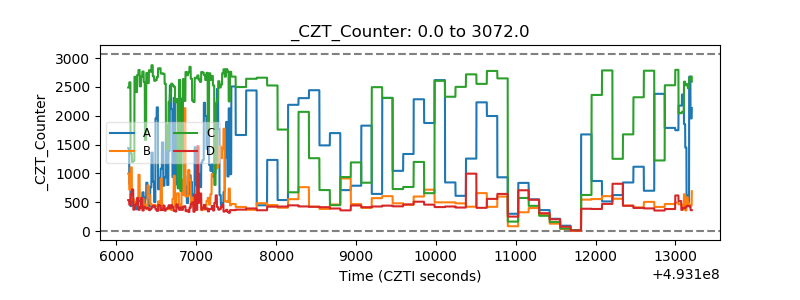 |
| +2.5 Volts monitor |  |
| +5 Volts monitor |  |
| _ROLL_ROT | 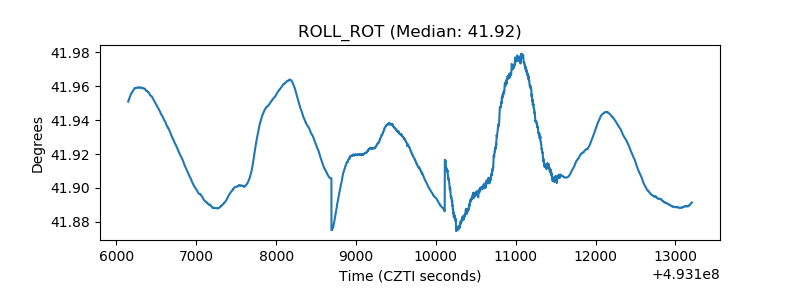 |
| _Roll_DEC | 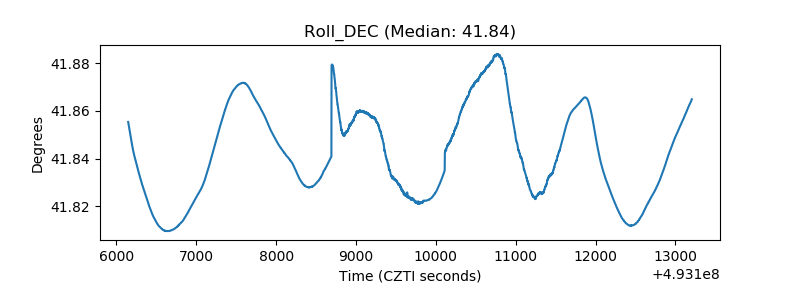 |
| _Roll_RA | 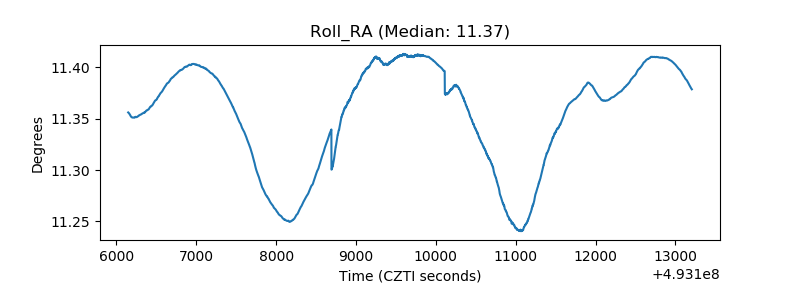 |
| Veto Counter | 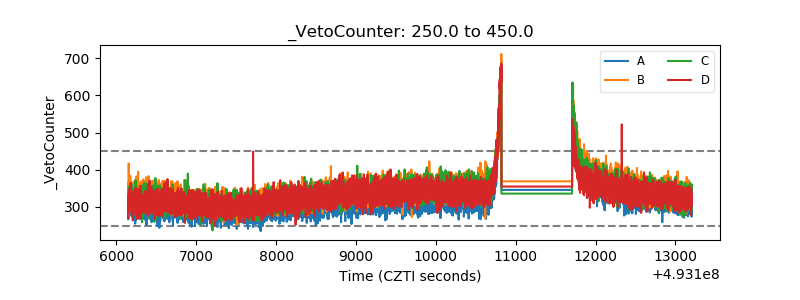 |