| Param | Original file | Final file |
|---|---|---|
| Filename | modeM0/AS1A14_002T06_9000006496_53482cztM0_level2.fits | modeM0/AS1A14_002T06_9000006496_53482cztM0_level2_quad_clean.evt |
| Size (bytes) | 923,281,920 | 73,607,040 |
| Size | 880.5 MB | 70.2 MB |
| Events in quadrant A | 10,858,667 | 410,909 |
| Events in quadrant B | 4,541,485 | 652,687 |
| Events in quadrant C | 15,132,349 | 143,805 |
| Events in quadrant D | 3,140,350 | 566,351 |
| Mode M9 | |||
|---|---|---|---|
| Quadrant | BADHDUFLAG | Total packets | Discarded packets |
| A | 0 | 10 | 0 |
| B | 0 | 10 | 0 |
| C | 0 | 10 | 0 |
| D | 0 | 10 | 0 |
| Mode SS | |||
|---|---|---|---|
| Quadrant | BADHDUFLAG | Total packets | Discarded packets |
| A | 0 | 134 | 0 |
| B | 0 | 134 | 0 |
| C | 0 | 134 | 0 |
| D | 0 | 134 | 0 |
| Mode M0 | |||
|---|---|---|---|
| Quadrant | BADHDUFLAG | Total packets | Discarded packets |
| A | 0 | 36748 | 1 |
| B | 0 | 17846 | 1 |
| C | 0 | 49403 | 2 |
| D | 0 | 14070 | 1 |
| Quadrant | Total seconds | Saturated seconds | Saturation percentage |
|---|---|---|---|
| A | 6513 | 2698 | 41.424843% |
| B | 6514 | 500 | 7.675775% |
| C | 6513 | 5167 | 79.333640% |
| D | 6513 | 87 | 1.335790% |
Noise dominated data is calculated using 1-second bins in cleaned event files. If a bin has >2000 counts, and if more than 50% of those come from <1% of pixels, then it is considered to be noise-dominated and hence unusable.
| Quadrant | # 1 sec bins | Bins with >0 counts | Bins with >2000 counts | High rate bins dominated by noise | Noise dominated (total time) | Noise dominated (detector-on time) | Marked lightcurve |
|---|---|---|---|---|---|---|---|
| A | 7528 | 6513 | 2534 | 2534 | 33.66% | 38.91% | 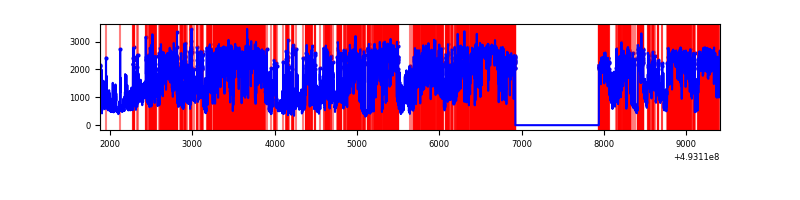 |
| B | 7529 | 6514 | 395 | 395 | 5.25% | 6.06% | 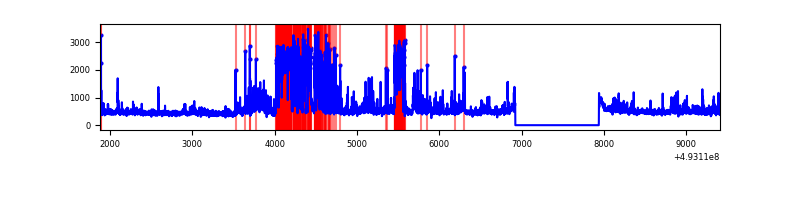 |
| C | 7527 | 6512 | 5152 | 5152 | 68.45% | 79.12% | 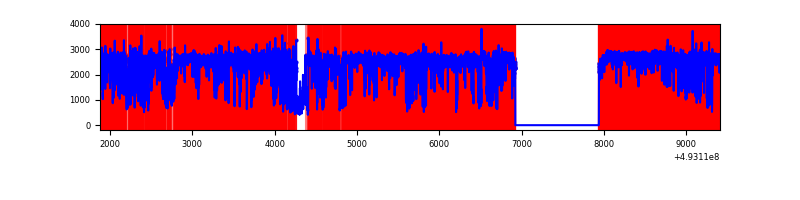 |
| D | 7528 | 6514 | 55 | 55 | 0.73% | 0.84% | 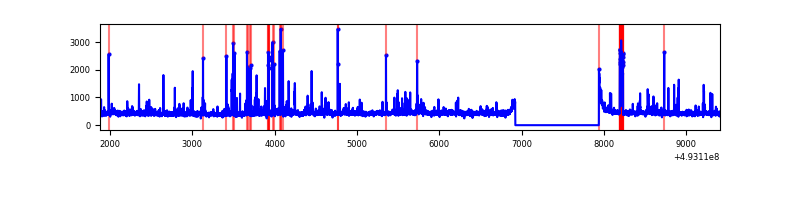 |
Top three noisy pixels from each quadrant. If the there are fewer than three noisy pixels in the level2.evt file, extra rows are filled as -1
| Pixel properties | Quadrant properties | ||||||
|---|---|---|---|---|---|---|---|
| Quadrant | DetID | PixID | Counts | Sigma | Mean | Median | Sigma |
| A | 3 | 63 | 5276502 | 35338.6 | 603 | 590 | 149.3 |
| A | 15 | 174 | 1464456 | 9805.12 | 603 | 590 | 149.3 |
| A | 4 | 249 | 932365 | 6241.12 | 603 | 590 | 149.3 |
| B | 2 | 249 | 931317 | 6312.62 | 688 | 666 | 147.4 |
| B | 5 | 185 | 285513 | 1932.12 | 688 | 666 | 147.4 |
| B | 10 | 254 | 106296 | 716.49 | 688 | 666 | 147.4 |
| C | 7 | 64 | 7925209 | 76860.87 | 371 | 367 | 103.1 |
| C | 15 | 224 | 2509515 | 24335.54 | 371 | 367 | 103.1 |
| C | 1 | 241 | 2354831 | 22835.3 | 371 | 367 | 103.1 |
| D | 3 | 12 | 162275 | 829.9 | 690 | 660 | 194.7 |
| D | 2 | 120 | 100049 | 510.36 | 690 | 660 | 194.7 |
| D | 5 | 173 | 50974 | 258.36 | 690 | 660 | 194.7 |
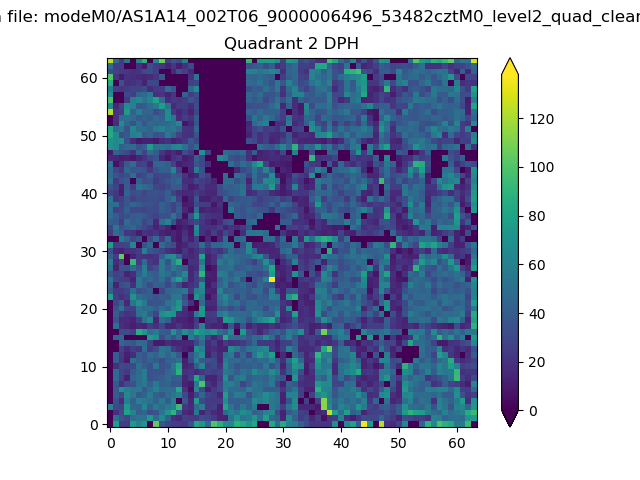
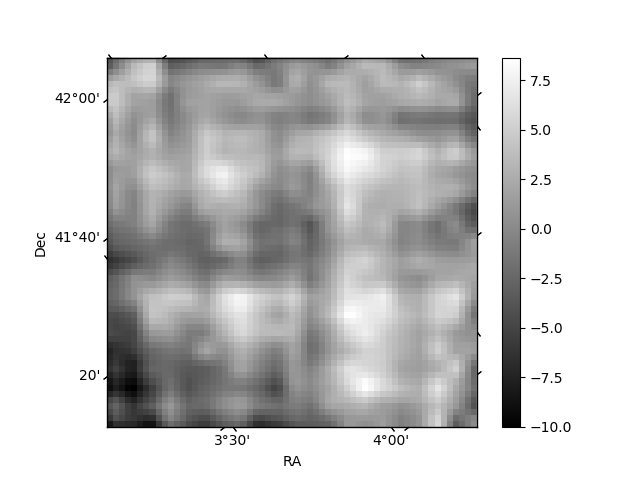
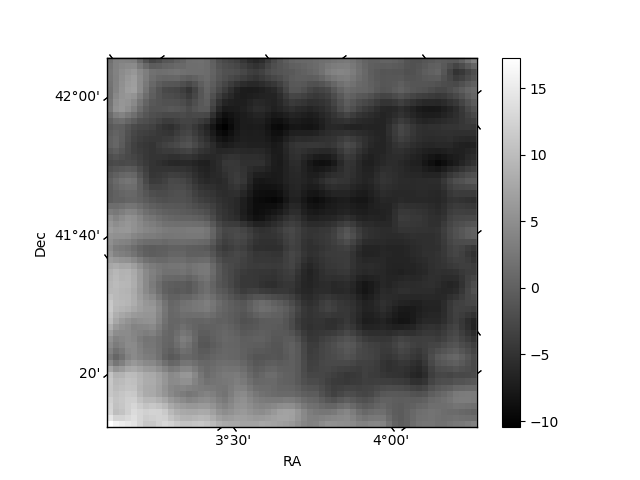
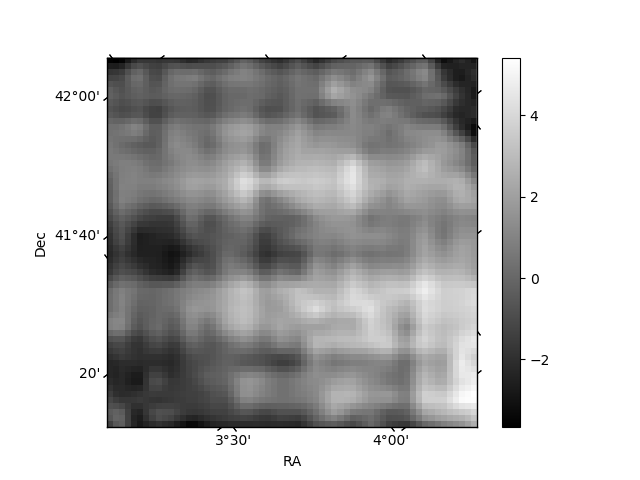
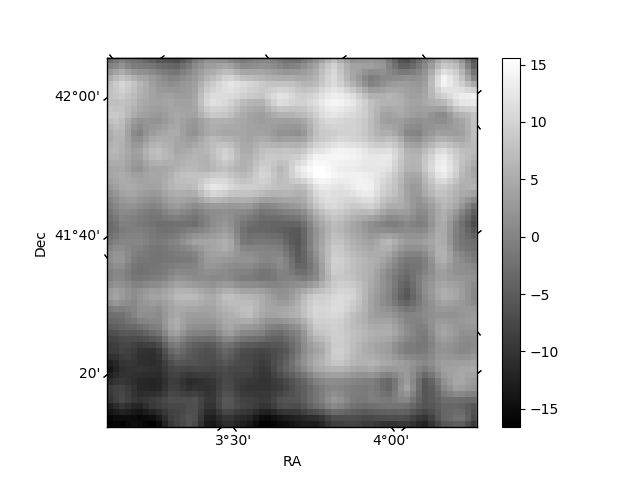
Histogram calculated using DETX and DETY for each event in the final _common_clean file
| Quadrant A | 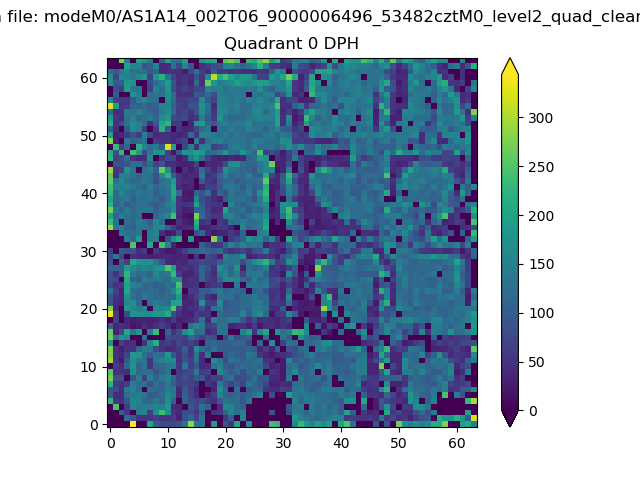 |
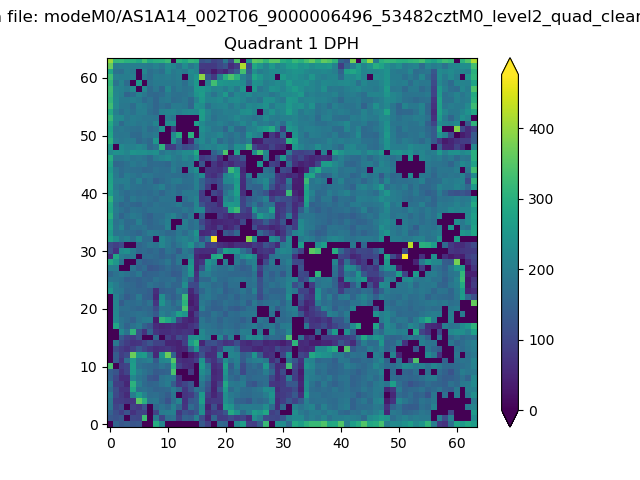 |
Quadrant B |
|---|---|---|---|
| Quadrant D | 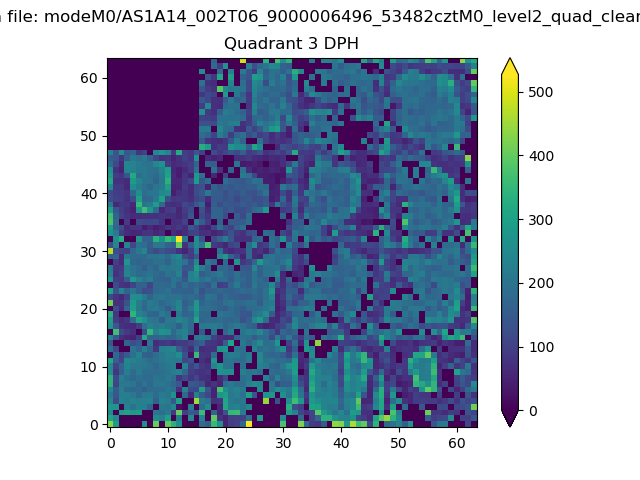 |
 |
Quadrant C |
| Plot type | Count rate plots | Images |
|---|---|---|
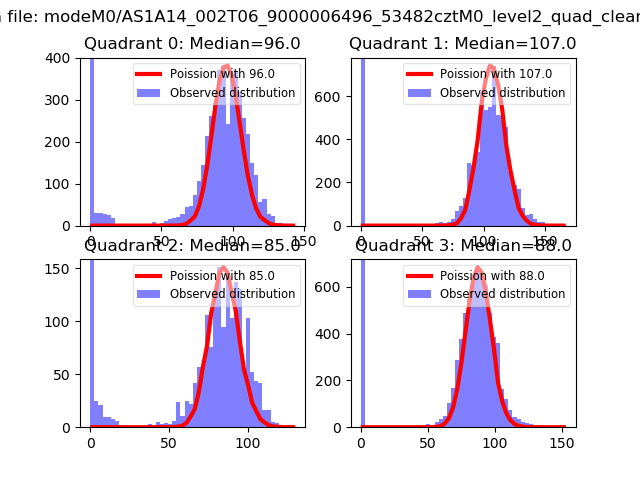
| Comparison with Poisson distribution Blue bars denote a histogram of data divided into 1 sec bins. Red curve is a Poisson curve with rate = median count rate of data. |
 |
 |
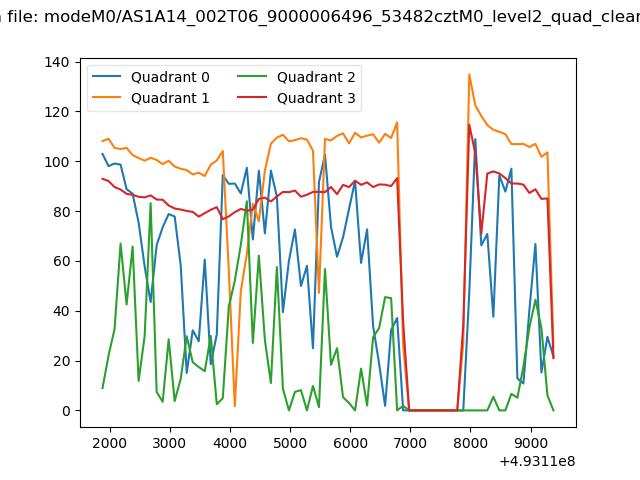
| Quadrant-wise count rates Data is divided into 100 sec bins |
 |
|
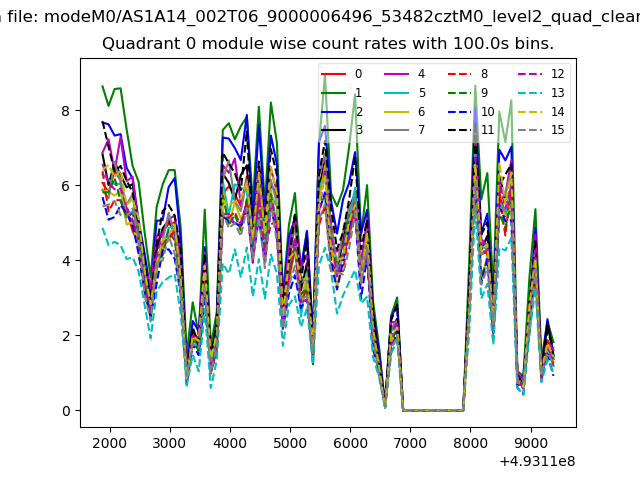
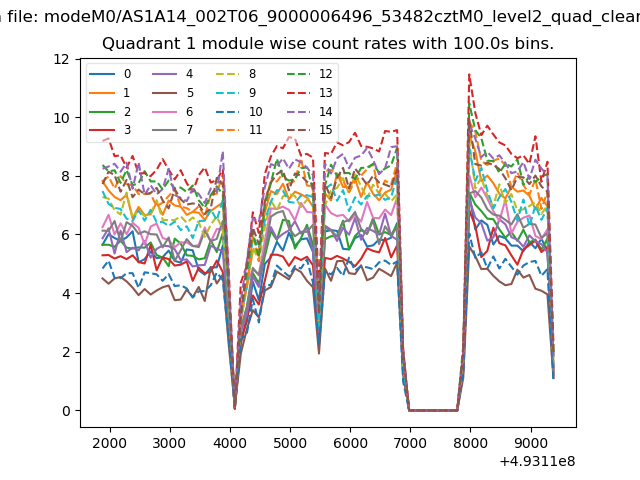
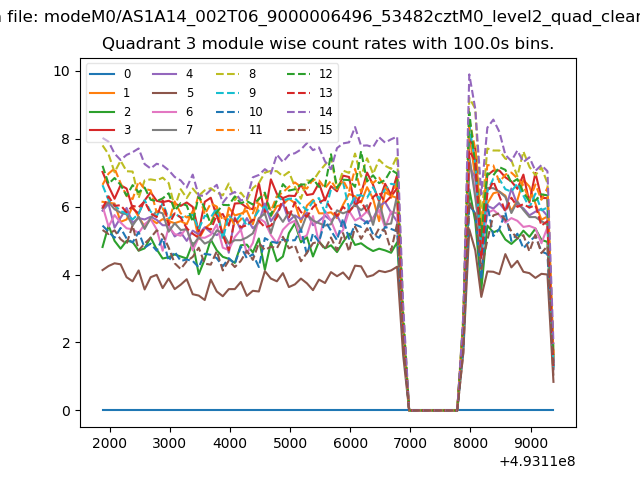
| Module-wise count rates for Quadrant A Data is divided into 100 sec bins |
 |
 |
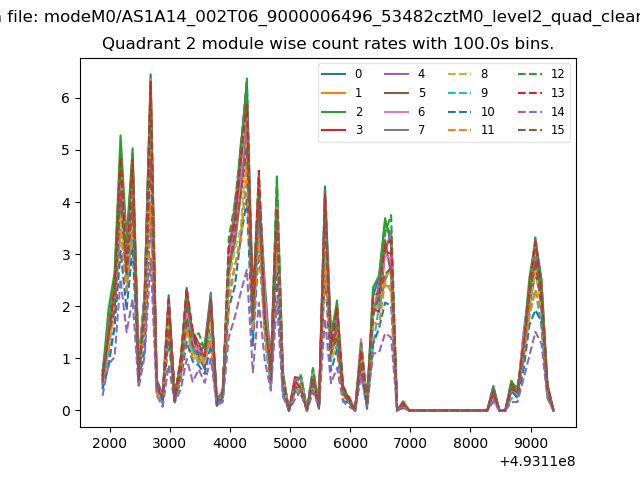
| Module-wise count rates for Quadrant B Data is divided into 100 sec bins |
 |
 |
| Module-wise count rates for Quadrant C Data is divided into 100 sec bins |
 |
 |
| Module-wise count rates for Quadrant D Data is divided into 100 sec bins |
 |
 |
| Parameter | Plot |
|---|---|
| CZT HV Monitor | 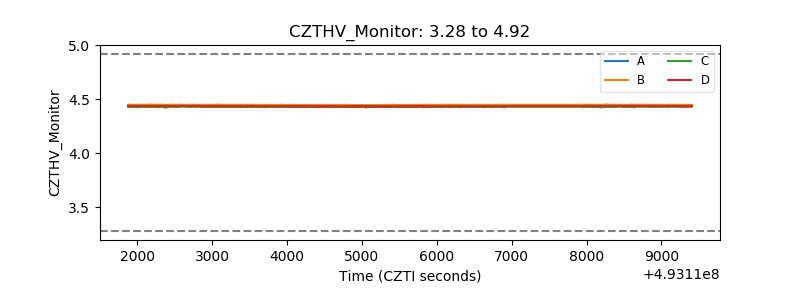 |
| D_VDD | 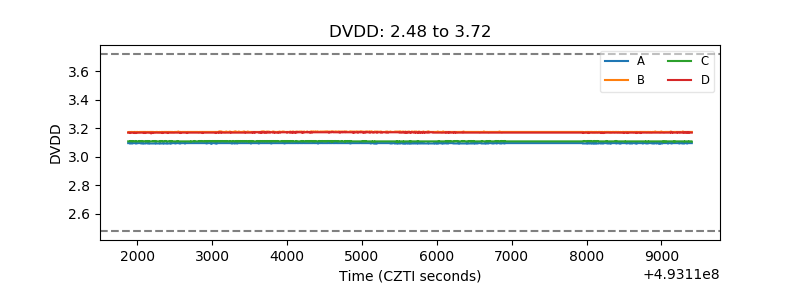 |
| Temperature 1 | 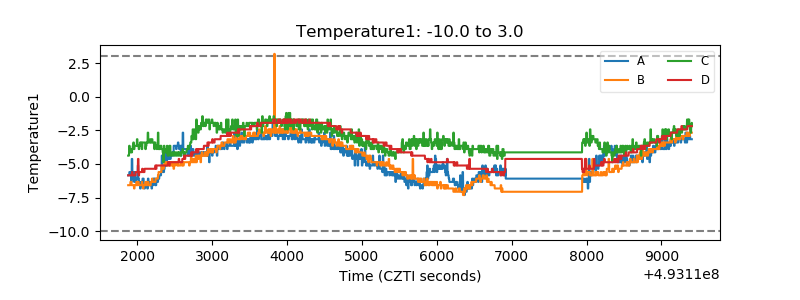 |
| Veto HV Monitor |  |
| Veto LLD | 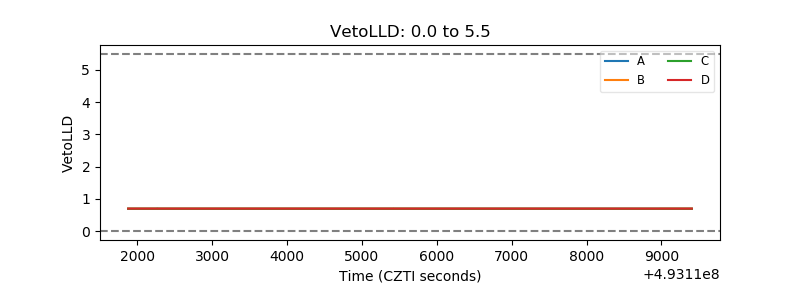 |
| Alpha Counter | 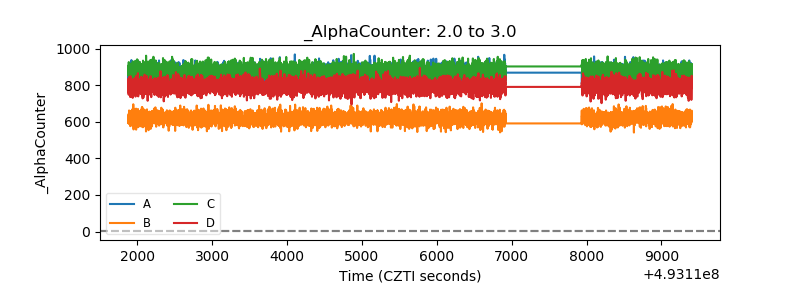 |
| _CPM_Rate | 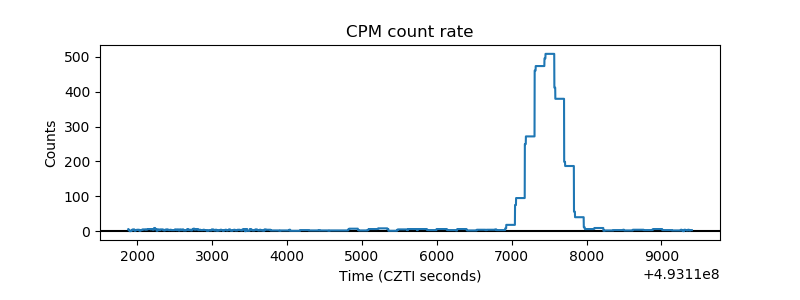 |
| CZT Counter | 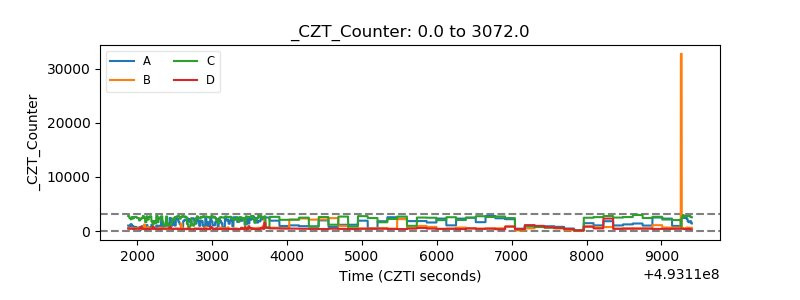 |
| +2.5 Volts monitor |  |
| +5 Volts monitor |  |
| _ROLL_ROT | 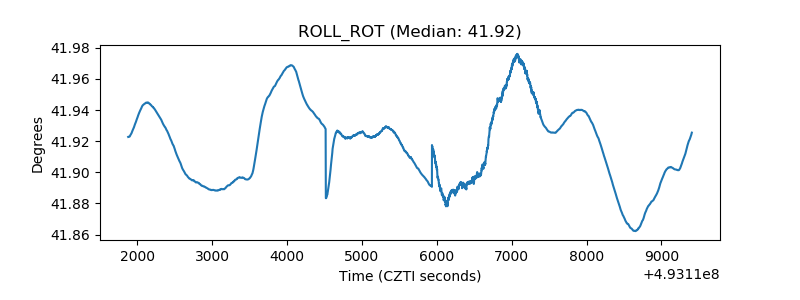 |
| _Roll_DEC | 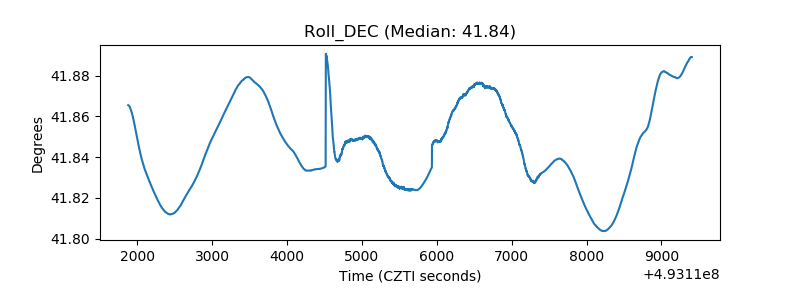 |
| _Roll_RA | 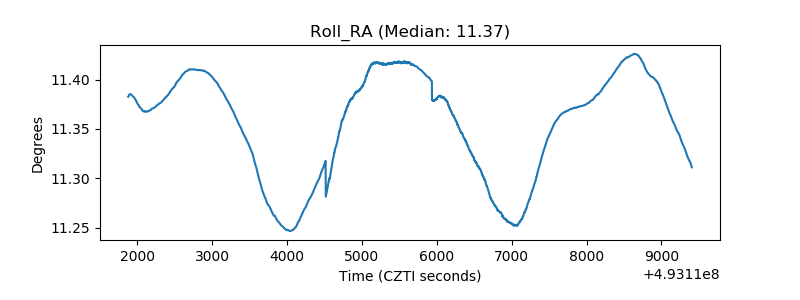 |
| Veto Counter | 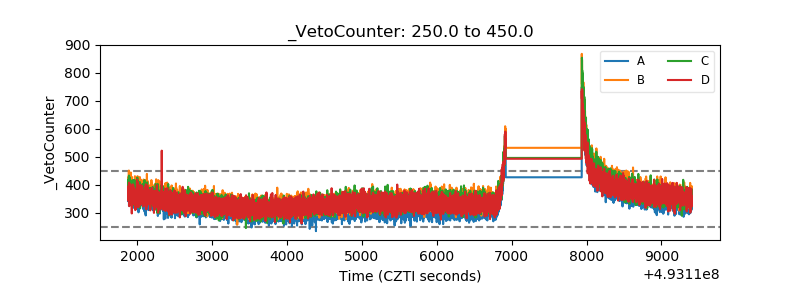 |