| Param | Original file | Final file |
|---|---|---|
| Filename | modeM0/AS1A14_002T06_9000006496_53483cztM0_level2.fits | modeM0/AS1A14_002T06_9000006496_53483cztM0_level2_quad_clean.evt |
| Size (bytes) | 893,376,000 | 78,289,920 |
| Size | 852.0 MB | 74.7 MB |
| Events in quadrant A | 10,636,693 | 439,219 |
| Events in quadrant B | 3,928,380 | 713,652 |
| Events in quadrant C | 14,107,698 | 186,389 |
| Events in quadrant D | 3,895,165 | 578,529 |
| Mode M9 | |||
|---|---|---|---|
| Quadrant | BADHDUFLAG | Total packets | Discarded packets |
| A | 0 | 11 | 0 |
| B | 0 | 11 | 0 |
| C | 0 | 11 | 0 |
| D | 0 | 11 | 0 |
| Mode SS | |||
|---|---|---|---|
| Quadrant | BADHDUFLAG | Total packets | Discarded packets |
| A | 0 | 132 | 0 |
| B | 0 | 132 | 0 |
| C | 0 | 132 | 0 |
| D | 0 | 132 | 0 |
| Mode M0 | |||
|---|---|---|---|
| Quadrant | BADHDUFLAG | Total packets | Discarded packets |
| A | 0 | 36109 | 1 |
| B | 0 | 15941 | 1 |
| C | 0 | 46409 | 1 |
| D | 0 | 16167 | 5 |
| Quadrant | Total seconds | Saturated seconds | Saturation percentage |
|---|---|---|---|
| A | 6489 | 2597 | 40.021575% |
| B | 6489 | 150 | 2.311604% |
| C | 6489 | 4695 | 72.353213% |
| D | 6488 | 177 | 2.728113% |
Noise dominated data is calculated using 1-second bins in cleaned event files. If a bin has >2000 counts, and if more than 50% of those come from <1% of pixels, then it is considered to be noise-dominated and hence unusable.
| Quadrant | # 1 sec bins | Bins with >0 counts | Bins with >2000 counts | High rate bins dominated by noise | Noise dominated (total time) | Noise dominated (detector-on time) | Marked lightcurve |
|---|---|---|---|---|---|---|---|
| A | 7579 | 6489 | 2389 | 2389 | 31.52% | 36.82% | 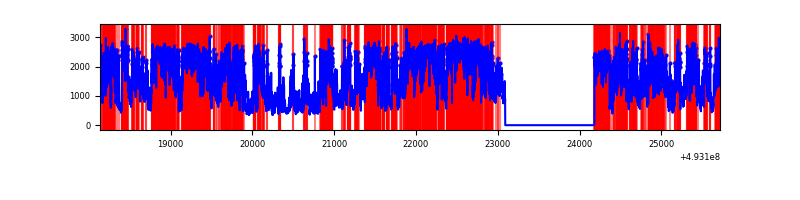 |
| B | 7579 | 6489 | 39 | 39 | 0.51% | 0.60% | 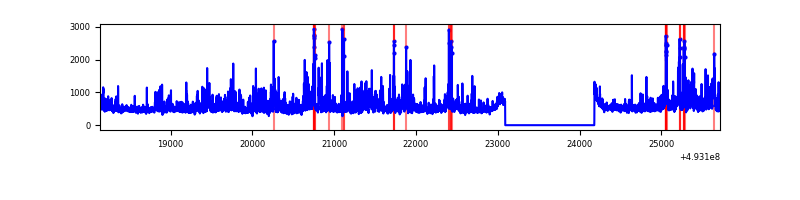 |
| C | 7578 | 6488 | 4602 | 4602 | 60.73% | 70.93% | 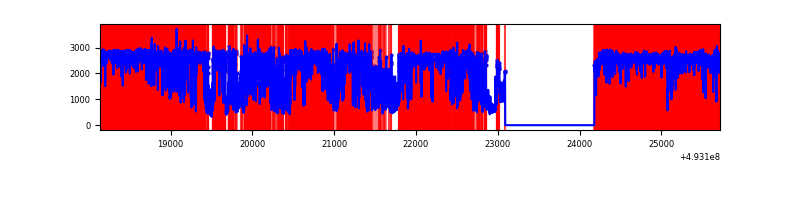 |
| D | 7578 | 6488 | 103 | 103 | 1.36% | 1.59% | 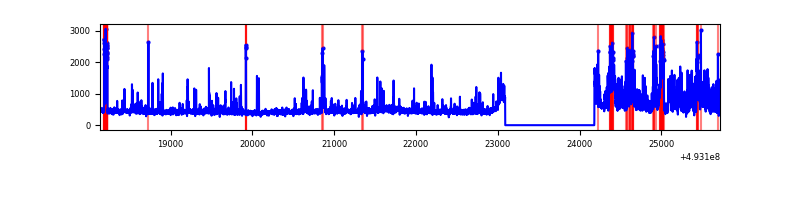 |
Top three noisy pixels from each quadrant. If the there are fewer than three noisy pixels in the level2.evt file, extra rows are filled as -1
| Pixel properties | Quadrant properties | ||||||
|---|---|---|---|---|---|---|---|
| Quadrant | DetID | PixID | Counts | Sigma | Mean | Median | Sigma |
| A | 3 | 63 | 7031687 | 45560.44 | 637 | 623 | 154.3 |
| A | 3 | 62 | 426634 | 2760.5 | 637 | 623 | 154.3 |
| A | 15 | 174 | 281985 | 1823.19 | 637 | 623 | 154.3 |
| B | 0 | 213 | 351447 | 2279.83 | 727 | 706 | 153.8 |
| B | 10 | 28 | 164144 | 1062.35 | 727 | 706 | 153.8 |
| B | 5 | 185 | 151353 | 979.21 | 727 | 706 | 153.8 |
| C | 7 | 64 | 9157729 | 84695.92 | 393 | 390 | 108.1 |
| C | 1 | 241 | 1411873 | 13054.76 | 393 | 390 | 108.1 |
| C | 15 | 224 | 993398 | 9184.3 | 393 | 390 | 108.1 |
| D | 3 | 144 | 547851 | 2707.98 | 710 | 679 | 202.1 |
| D | 12 | 35 | 170525 | 840.57 | 710 | 679 | 202.1 |
| D | 2 | 120 | 98997 | 486.58 | 710 | 679 | 202.1 |
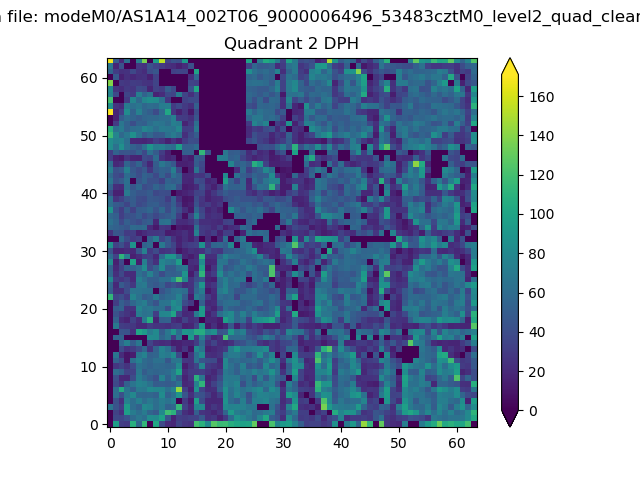
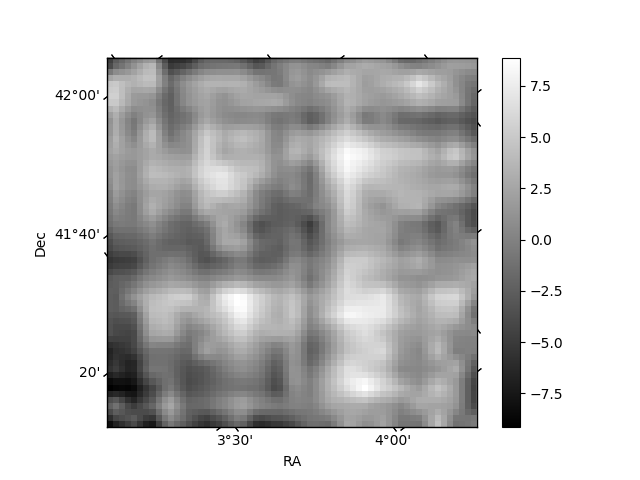
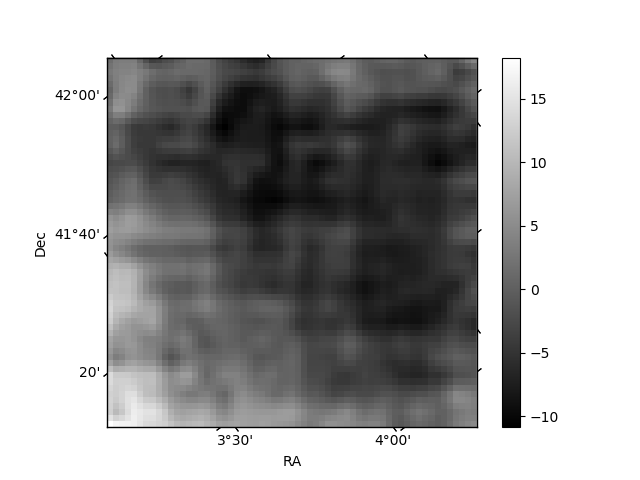
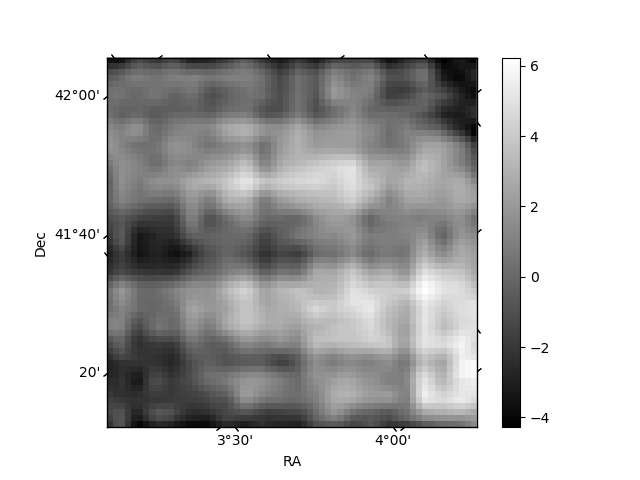
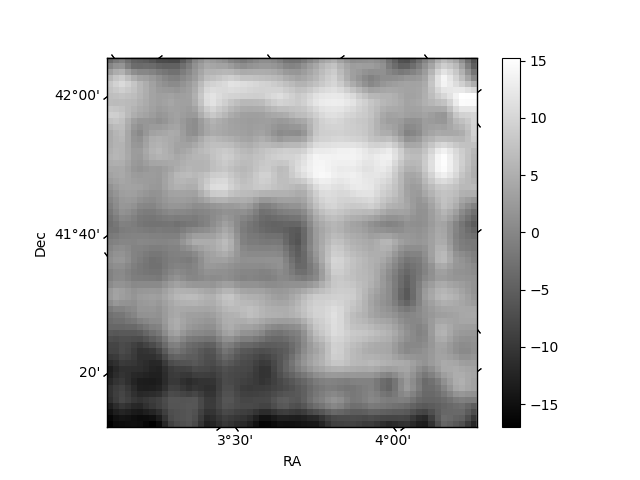
Histogram calculated using DETX and DETY for each event in the final _common_clean file
| Quadrant A | 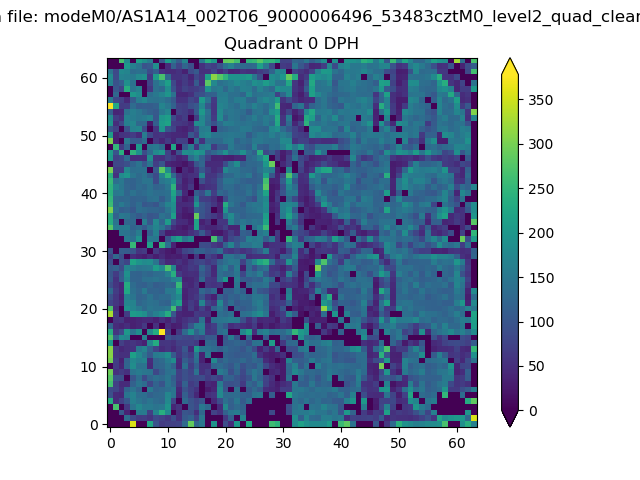 |
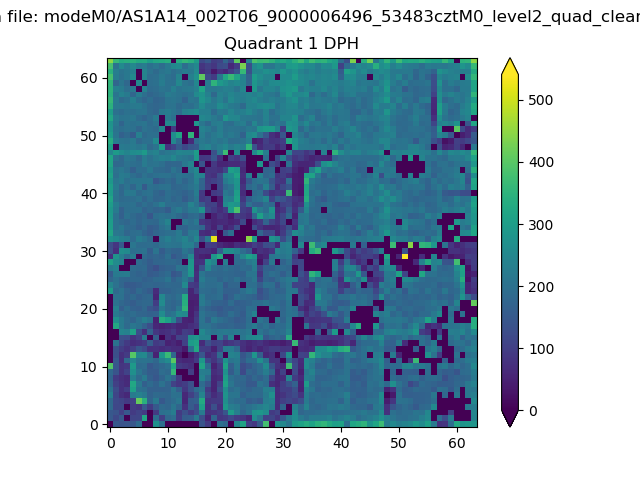 |
Quadrant B |
|---|---|---|---|
| Quadrant D | 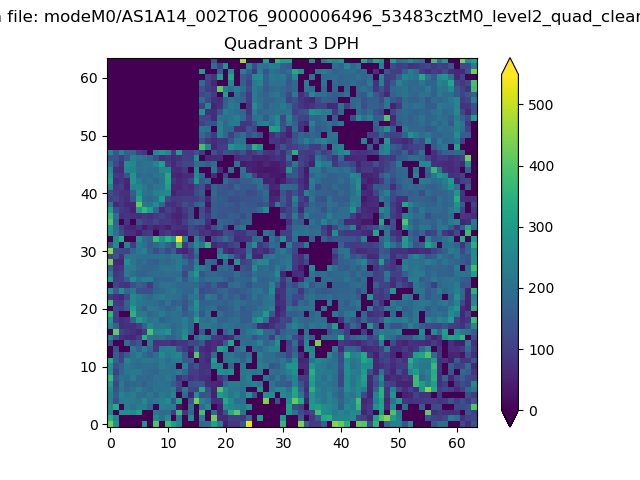 |
 |
Quadrant C |
| Plot type | Count rate plots | Images |
|---|---|---|
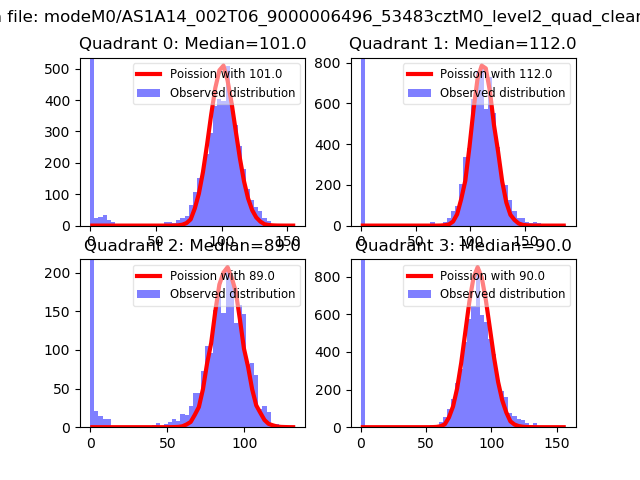
| Comparison with Poisson distribution Blue bars denote a histogram of data divided into 1 sec bins. Red curve is a Poisson curve with rate = median count rate of data. |
 |
 |
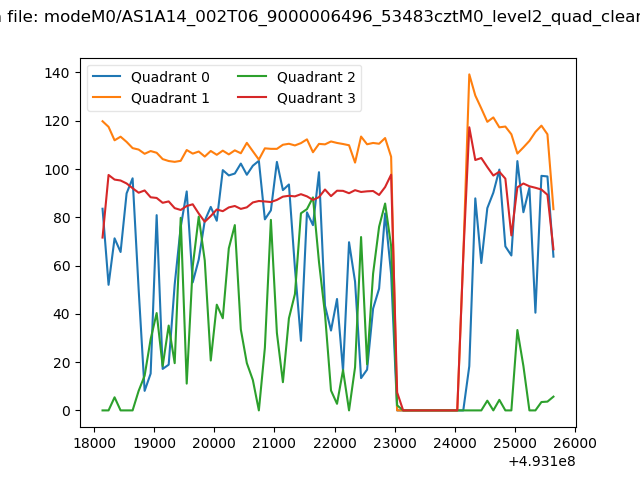
| Quadrant-wise count rates Data is divided into 100 sec bins |
 |
|
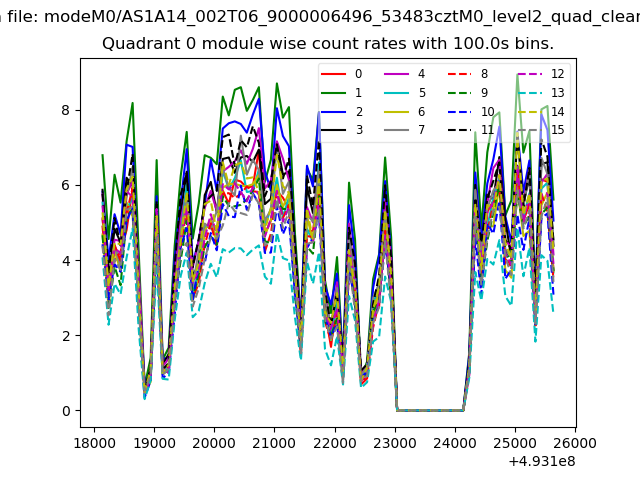
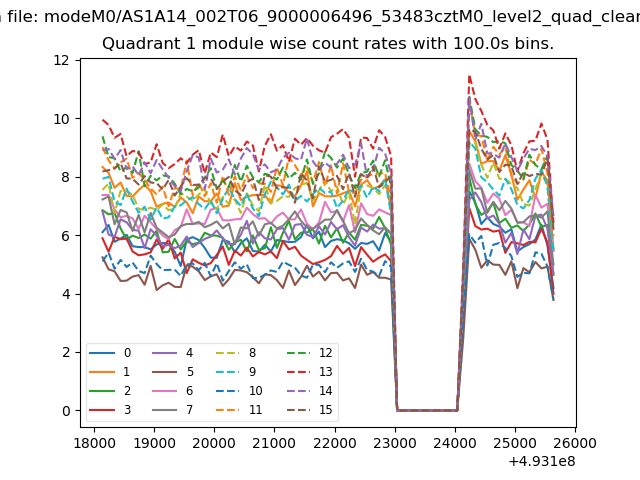
| Module-wise count rates for Quadrant A Data is divided into 100 sec bins |
 |
 |
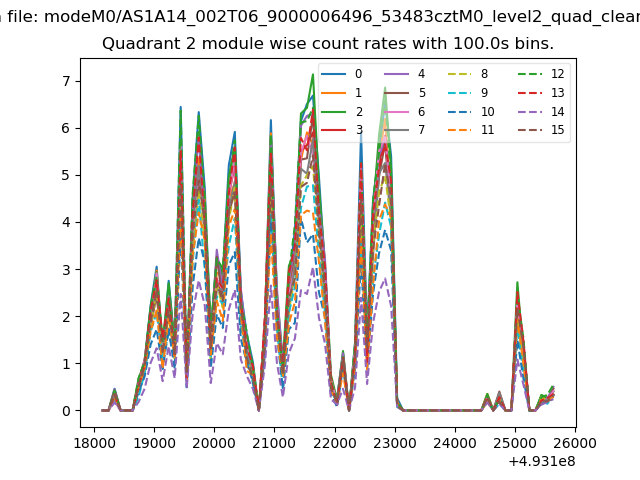
| Module-wise count rates for Quadrant B Data is divided into 100 sec bins |
 |
 |
| Module-wise count rates for Quadrant C Data is divided into 100 sec bins |
 |
 |
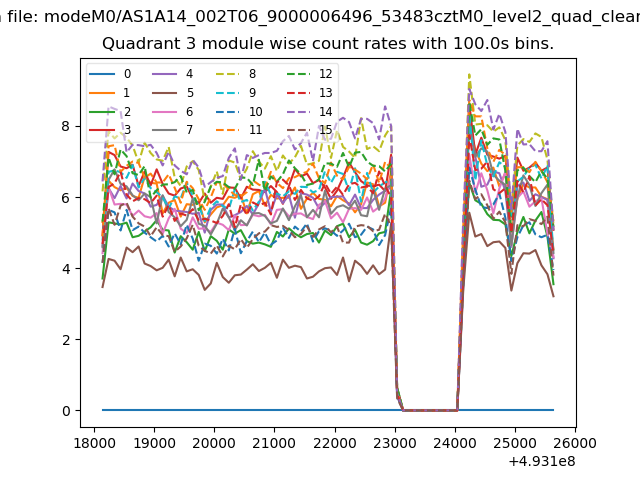
| Module-wise count rates for Quadrant D Data is divided into 100 sec bins |
 |
 |
| Parameter | Plot |
|---|---|
| CZT HV Monitor | 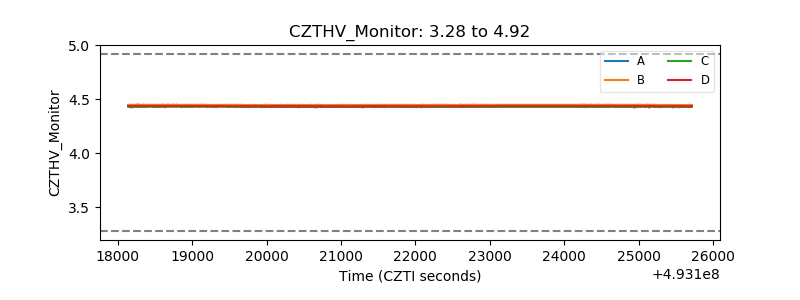 |
| D_VDD | 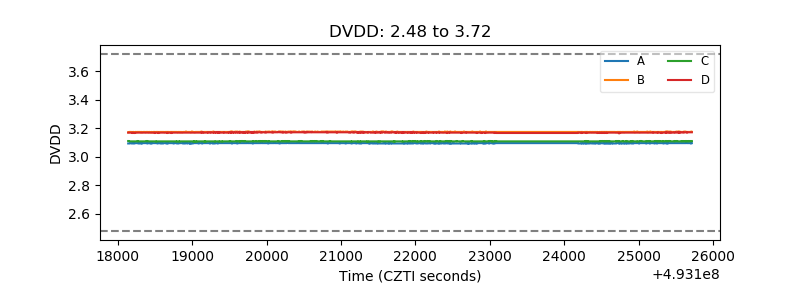 |
| Temperature 1 | 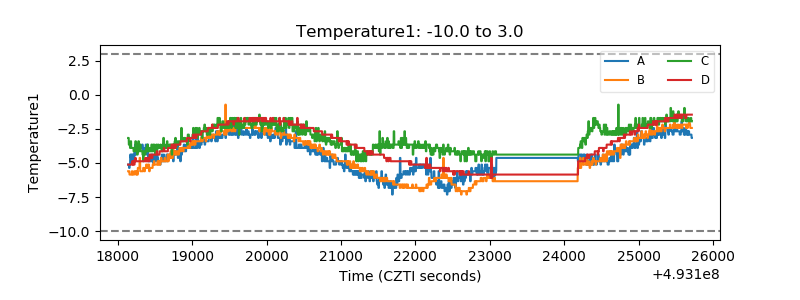 |
| Veto HV Monitor | 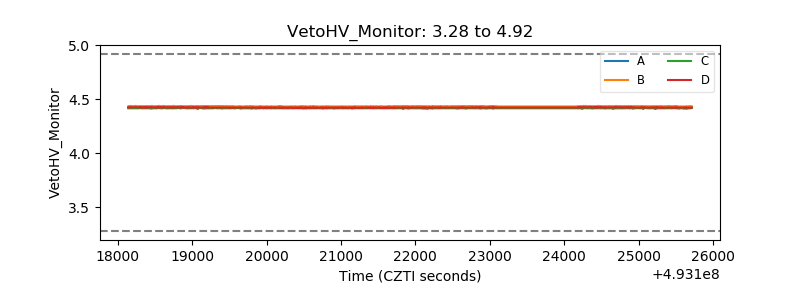 |
| Veto LLD | 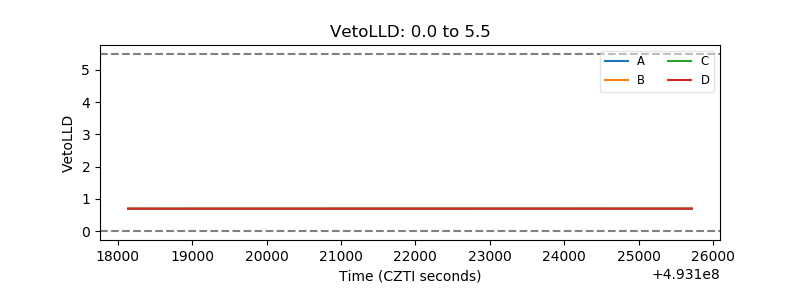 |
| Alpha Counter | 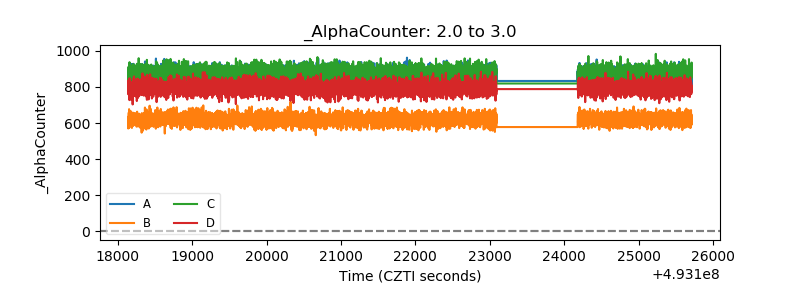 |
| _CPM_Rate | 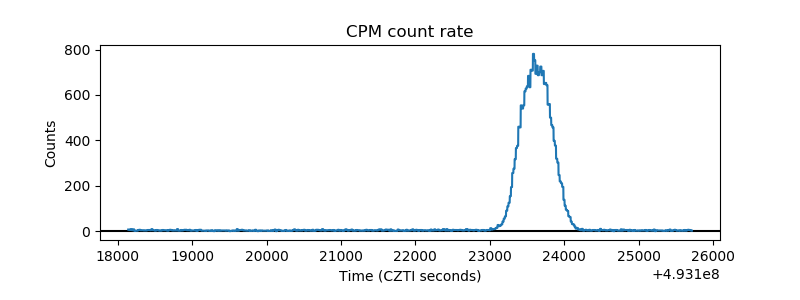 |
| CZT Counter | 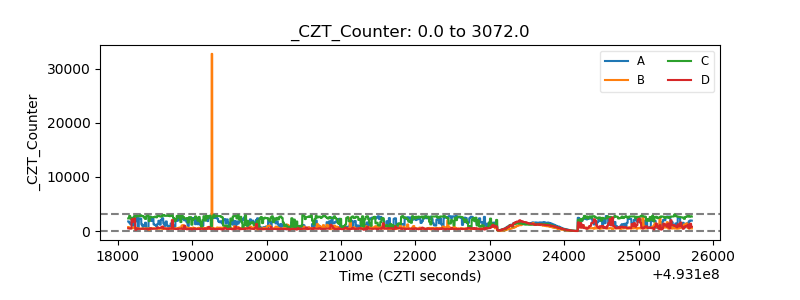 |
| +2.5 Volts monitor |  |
| +5 Volts monitor |  |
| _ROLL_ROT | 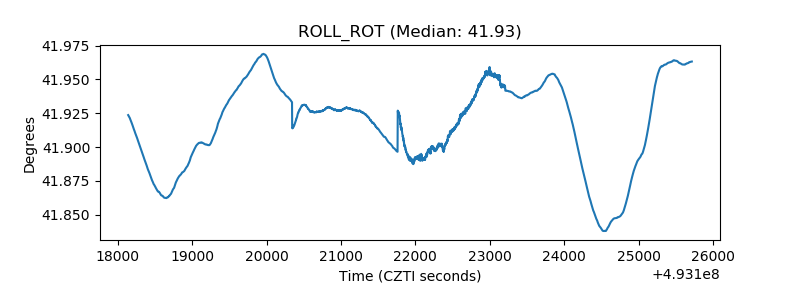 |
| _Roll_DEC | 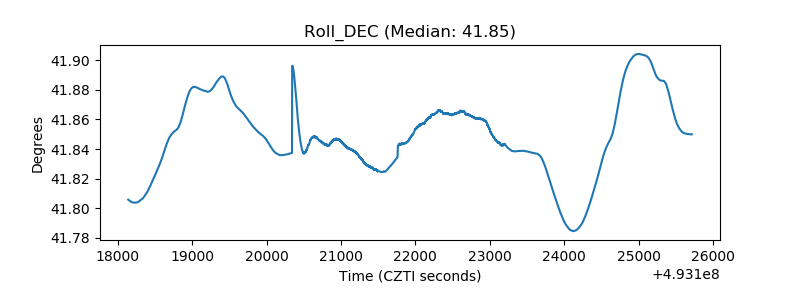 |
| _Roll_RA | 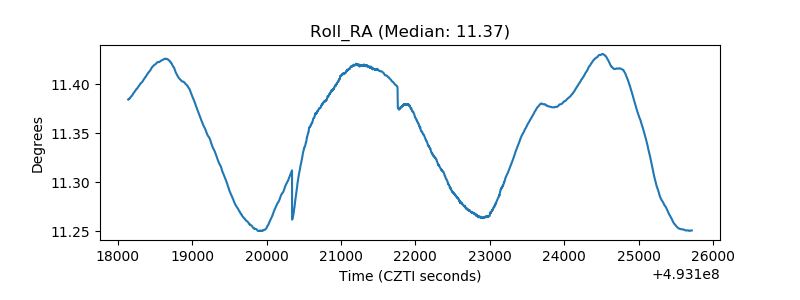 |
| Veto Counter | 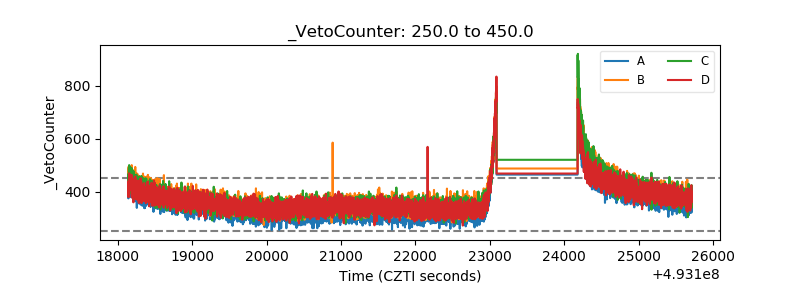 |